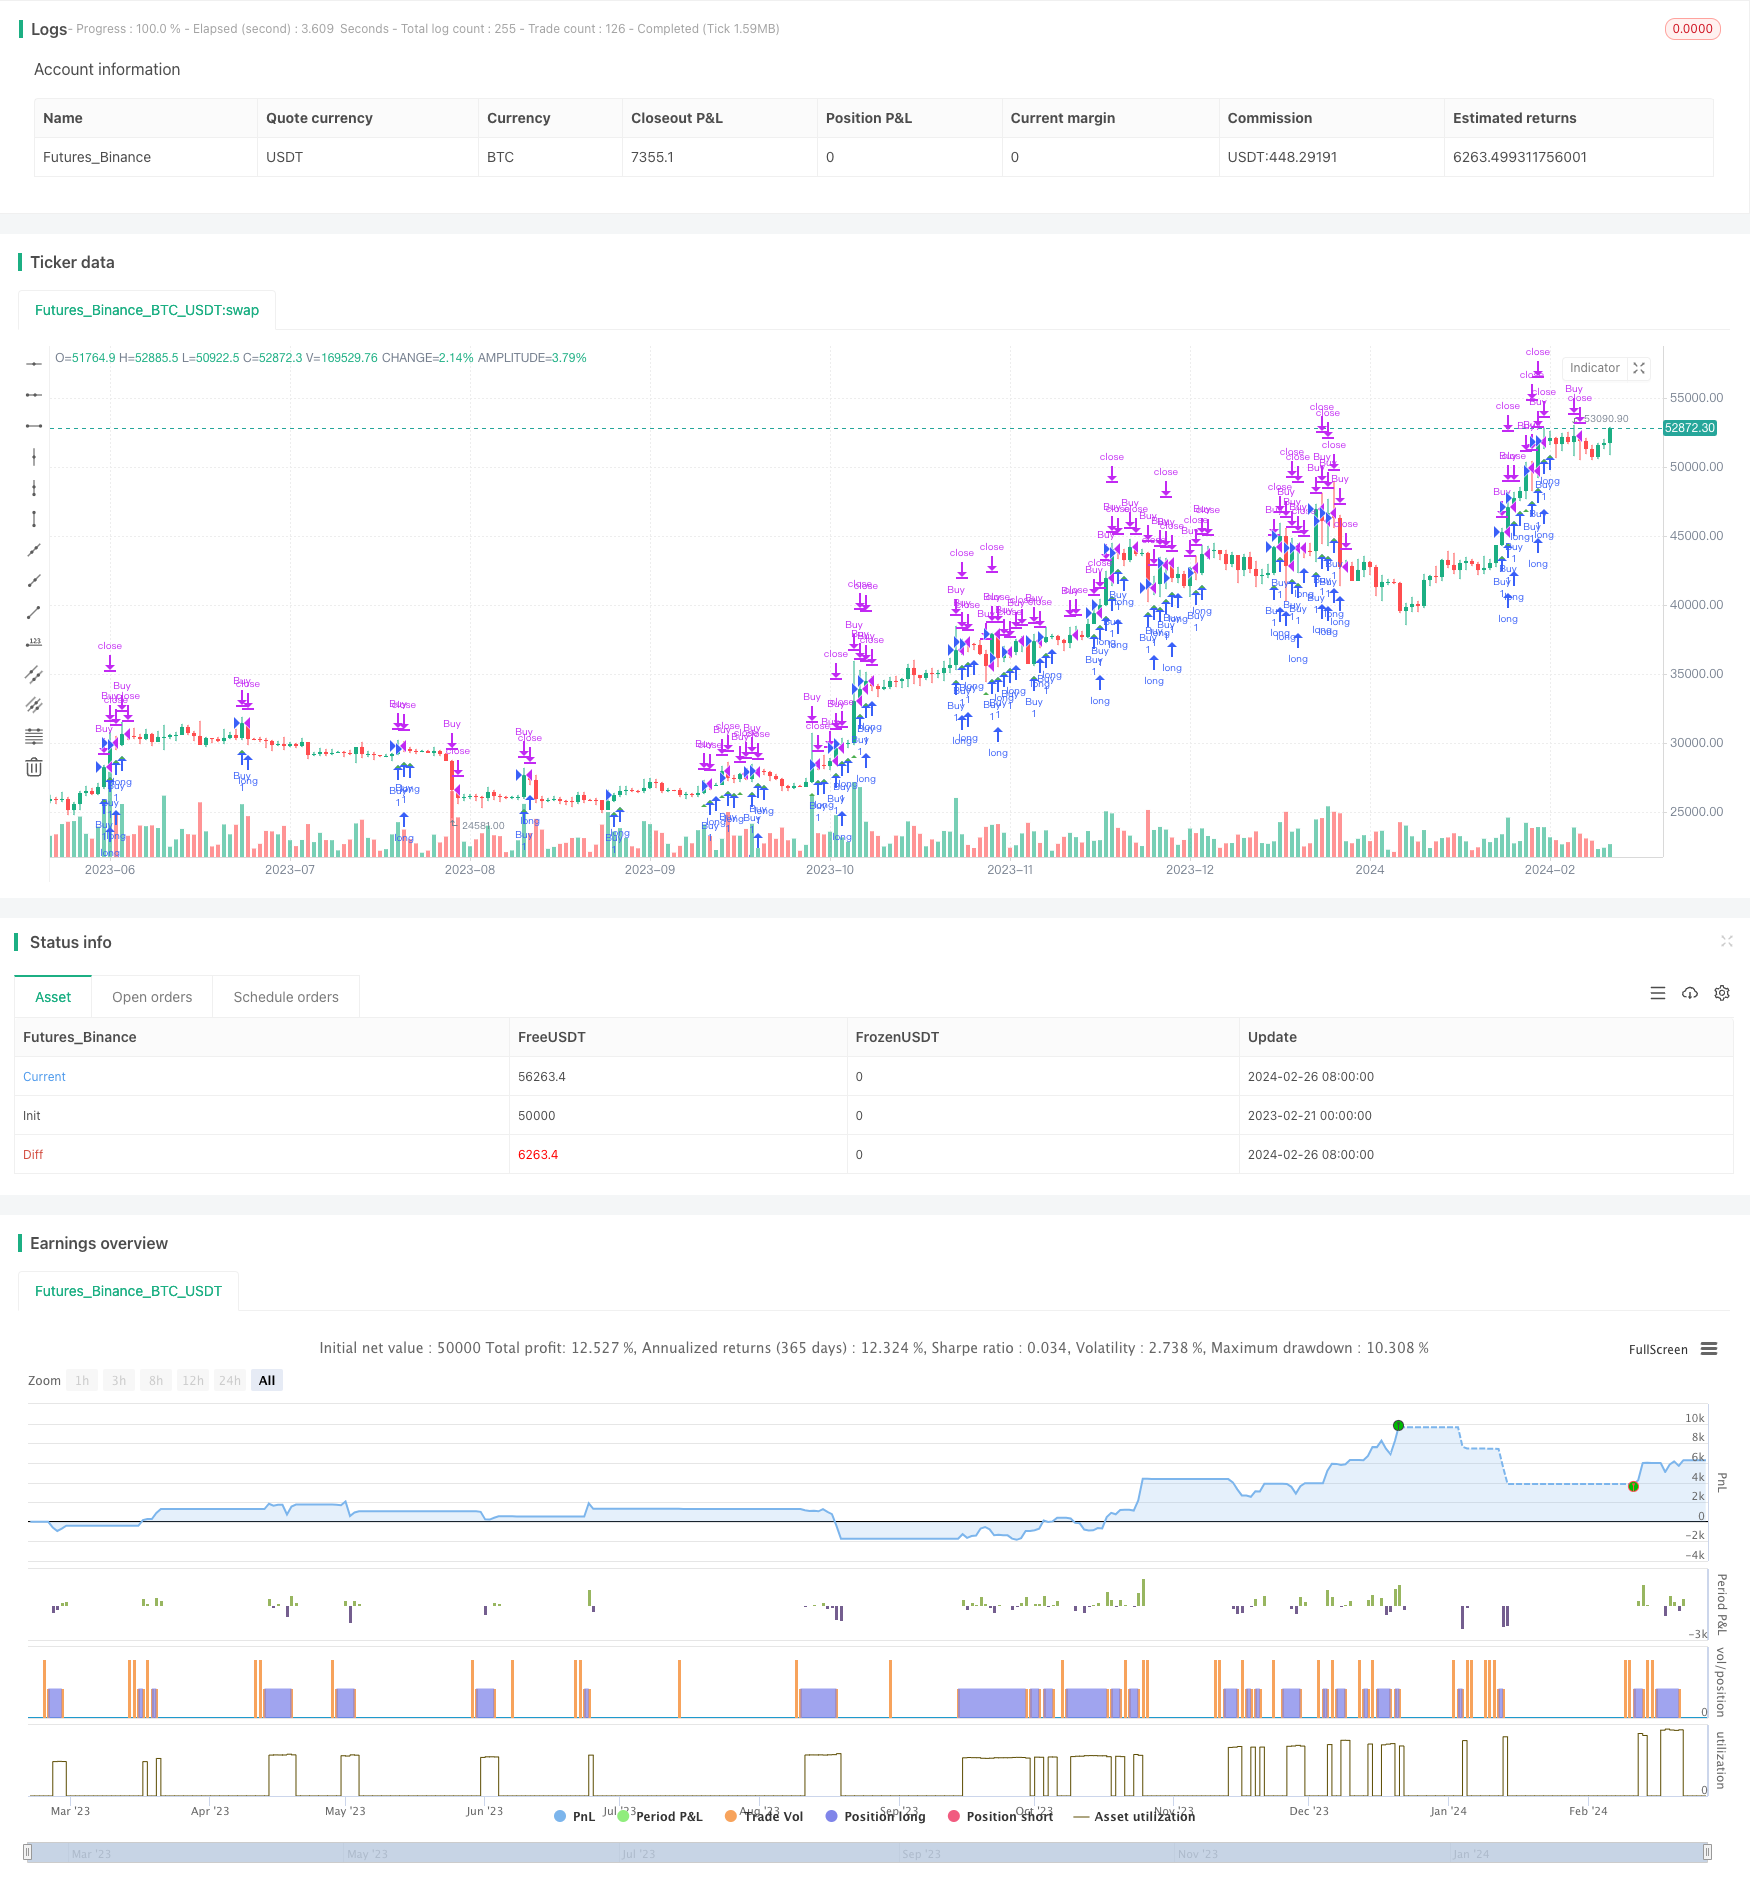
ギャップを切り開く戦略
作者: リン・ハーンチャオチャン, 日付: 2024-02-28 17:12:52タグ:

この戦略は,変動平均と価格差を計算し,ショックの時に頻繁に開場しないようにして,ロングエントリーを決定することで,市場の傾向の方向性を判断します.
戦略の概要
- 市場全体の動向を決定するために20期間の単純な移動平均値を使用する
- 最近の物価変動を判断するために 3 期間の高低価格差を使用する
- 価格がMAより高く,差が20期間の平均値よりも大きい場合,ロング
- 価格が入場価格の98%を下回ると退場
戦略原則
この戦略は,MAと価格変動を組み合わせて,トレンドの間上向きの機会を把握します.
価格がMAを超えると上昇傾向を示します.最近の3期間のHL差が20期間の平均値よりも大きい場合は,変動が増加し,エントリーが大きく上昇する可能性を示します.
オープン後,固定した ストップ・ロスト価格を設定します. 価格が下落すると退場します. 下落リスクを制御します.
利点
- トレンドと波動性の両方を判断することで,ショック時に頻繁な開設を避ける
- 価格差を用いてより強いブレイクシグナル
- ストップ・ロスはリスクをコントロールするのに役立ちます
リスク
- パラメータの調整が不適切で,取引が欠けている
- ストップ損失の幅が大きすぎると 損失が大きくなります
- 脱出は偽りかもしれない もっと要因が必要
リスク対策
- 最適な組み合わせのためのパラメータを最適化
- 市場変動ごとに複数のストップまたは適応ストップを使用
- 信号の信頼性を確認するために音量などの指標を追加します
改善の方向
- より良いエントリのためにBBのような変動指標を追加します
- 入力信号を確認するために音量を分析
- 株式指数を使用して,悪い取引を避けるために全体の市場を判断
- 移動/遅延停止を使用して,より多くの利益をロック
結論
この戦略は,単純で有用な指標でトレンド市場に入る前にショックと変動を効果的にフィルタリングし,不必要な取引を避ける.また,損失を制限するためにリスクはよく制御されています.さらなる最適化はさらに良い結果をもたらすことができます.
/*backtest
start: 2023-02-21 00:00:00
end: 2024-02-27 00:00:00
period: 1d
basePeriod: 1h
exchanges: [{"eid":"Futures_Binance","currency":"BTC_USDT"}]
*/

//@version=5
strategy("Estrategia de Diferencia HL y MA para Criptomonedas", shorttitle="HL MA Crypto Strategy-Ortiz", overlay=true)

// Definir longitud de MA y HL
ma_length = input(20, title="Longitud MA")
hl_length = input(3, title="Longitud HL")
exit_below_price = input(0.98, title="Salir por debajo de precio")

// Calcular MA
ma = ta.sma(close, ma_length)

// Calcular HL
hh = ta.highest(high, hl_length)
ll = ta.lowest(low, hl_length)
hl = hh - ll

// Condiciones de tendencia alcista
bullish_trend = close > ma

// Condiciones de entrada y salida
long_condition = close > ma and close > ma[1] and hl > ta.sma(hl, ma_length)
short_condition = false // No operar en tendencia bajista
exit_condition = low < close * exit_below_price

// Entrada y salida de la estrategia
if (long_condition)
    strategy.entry("Buy", strategy.long)
if (short_condition)
    strategy.entry("Sell", strategy.short)
if (exit_condition)
    strategy.close("Buy")

// Plot de señales en el gráfico
plotshape(long_condition, style=shape.triangleup, location=location.belowbar, color=color.green, size=size.small, title="Buy Signal")
plotshape(short_condition, style=shape.triangledown, location=location.abovebar, color=color.red, size=size.small, title="Sell Signal")
もっと
- Bitlinc MARSI トレーディング戦略
- ボリンジャー帯の追跡戦略
- スーパートレンド ブレイクアウト戦略
- 二重EMA戦略分析
- 突破口のコールバック・トレーディング戦略
- 移動平均のクロスオーバートレンド戦略
- 価格チャネルロボットホワイトボックス戦略
- 単純な移動平均値トレンド 定量戦略
- ATR ストップ ロス 購入 戦略
- バイノミアルモメンタムブレイク逆転戦略
- ATR トレイリングストップ戦略とフィボナッチリトレースメント目標
- ボリンジャー・バンドス ブレイクトレンド・トレード戦略
- 移動平均逆転戦略に基づいて
- ゴールデン・クロスオーバーに基づく短期的突破戦略
- 圧縮指標に基づく多期トレンド取引戦略
- モメント・ライン・クロスオーバー EMA 9株MACD戦略
- 定量振動指標の組み合わせ戦略
- イチモク・クラウド・トレンド 戦略をフォローする
- 日中二重移動平均取引戦略
- マヤ の 宝物 狩り の ガイド