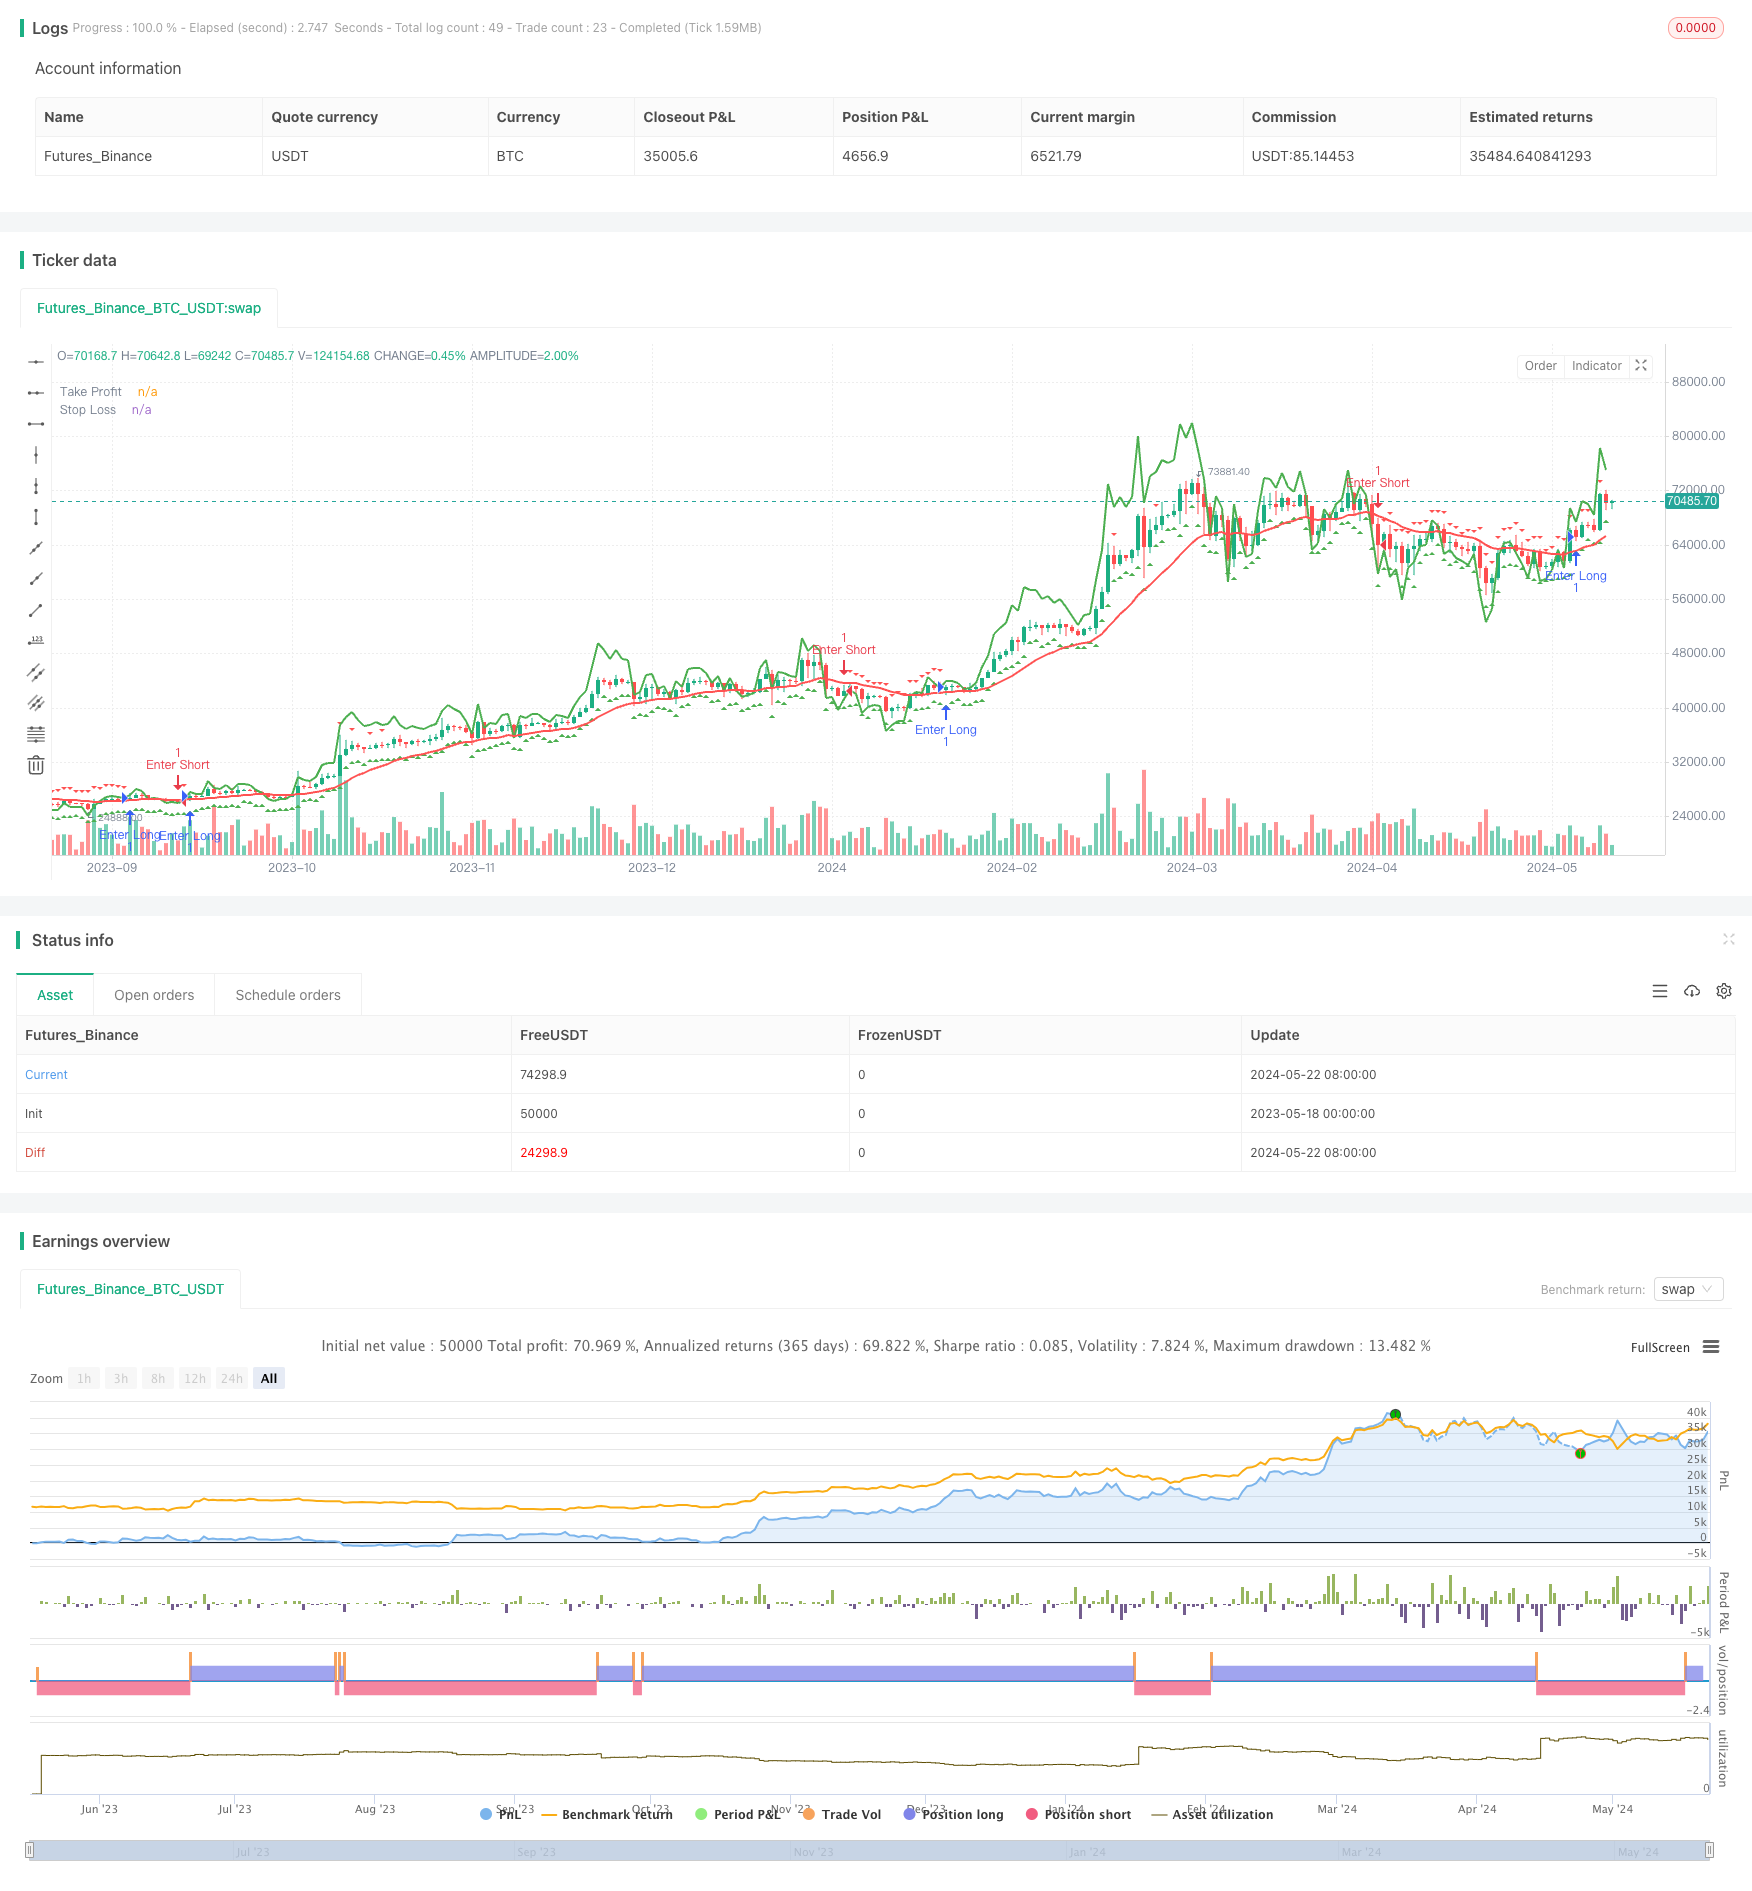
SMCとEMAの戦略とP&L予測
作者: リン・ハーンチャオチャン開催日:2024年5月24日 18時05分39秒タグ:エイマSMC

概要
この戦略は,現在の市場トレンドを決定するために,異なる期間の2つの指数関数移動平均値 (EMA) を使用する.速いEMAがスローEMAよりも高くなった場合,それは上昇傾向とみなされ,逆の方で,速いEMAがスローEMAよりも低い場合,それは下落傾向とみなされる.さらに,戦略はリスク対報酬比を計算し,取引のリスク管理を最適化するのに役立つ利益とストップ損失レベルを設定する.
戦略原則
この戦略の基本原理は,異なる期間のEMAを活用して市場動向を把握することである.高速EMA (10期間のEMA) がスローEMA (20期間のEMA) の上にあるとき,市場は上昇傾向にあると考えられ,戦略は購入信号を生成する.逆に,高速EMAがスローEMAの下にあるとき,市場は下落傾向にあると考えられ,戦略は販売信号を生成する.
トレンド識別に加えて,戦略はリスク管理の概念も導入している.リスク対報酬比を計算することによって,各取引の潜在的なリスクと報酬を評価する.さらに,戦略は,潜在的な損失を制限し,利益をロックするのに役立つEMAの位置に基づいて利益とストップ損失レベルを計算する.
戦略 の 利点
- シンプルで効果的: 戦略は,EMAの簡単なクロスオーバーを使用して,傾向を決定し,理解し,実行しやすくします.
- リスク管理:リスク対報酬比を計算し,利益とストップ損失のレベルを設定することで,戦略はリスク管理を最適化するのに役立ちます.
- 適応性: 戦略は,EMA期間とリスク/リターン比の限界値を調整することによって,異なる市場状況に適応できます.
戦略リスク
- 誤った信号: 不安定な市場やトレンドの転換点では,EMAクロスオーバーが誤った信号を生み出し,不正な取引決定につながる可能性があります.
- 遅延: EMAクロスオーバーは,トレンドが既に確立された後に信号を生成し,初期取引機会を逃す傾向を追求する戦略である.
- 固定ストップ損失: 戦略は固定ストップ損失レベルを使用し,非常に不安定な市場で頻繁なストップアウトにつながり,戦略の業績に影響を与える可能性があります.
戦略の最適化方向
- 他の指標を組み込む: RSI,MACDなどの他の技術指標を組み合わせることで,信号の信頼性と精度を向上させる.
- ダイナミックストップ損失: 市場の変動やATRのような指標に基づいてストップ損失レベルをダイナミックに調整し,市場の変化により良く適応します.
- パラメータ最適化:バックテストと最適化を通じて,戦略のパフォーマンスを向上させるために最適なEMA期間とリスク対報酬比の限界値を見つけます.
概要
この戦略は,トレンドを特定するためにEMAクロスオーバーを使用し,リスク管理の概念を導入し,トレーダーにシンプルで効果的な取引フレームワークを提供します. 戦略は,誤った信号や遅れなどのリスクに直面する可能性がありますが,他の指標を組み込み,動的ストップ損失を実装し,パラメータを最適化することでさらなる改善が可能です. 全体的に,さらなる研究と最適化に値する戦略です.
/*backtest
start: 2023-05-18 00:00:00
end: 2024-05-23 00:00:00
period: 1d
basePeriod: 1h
exchanges: [{"eid":"Futures_Binance","currency":"BTC_USDT"}]
*/

//@version=5
strategy("SMC & EMA Strategy with P&L Projections", shorttitle="SMC-EMA", overlay=true)

// Define EMAs
ema_fast = ta.ema(close, 10)
ema_slow = ta.ema(close, 20)

// Calculate SMC conditions (you can adjust these based on your understanding)
is_bullish = ema_fast > ema_slow
is_bearish = ema_fast < ema_slow

// Draw order blocks
plotshape(is_bullish, style=shape.triangleup, location=location.belowbar, color=color.green, size=size.small, title="Buy Signal")
plotshape(is_bearish, style=shape.triangledown, location=location.abovebar, color=color.red, size=size.small, title="Sell Signal")

// Calculate risk-to-reward ratio
entry_price = close
take_profit = entry_price + (entry_price - ema_slow)  // Example: 1:1 risk-to-reward
stop_loss = entry_price - (entry_price - ema_slow)

// Calculate P&L
profit = take_profit - entry_price
loss = entry_price - stop_loss
risk_reward_ratio = profit / loss

// Display alerts
alertcondition(is_bullish, title="Buy Alert", message="Smart Money Buy Signal")
alertcondition(is_bearish, title="Sell Alert", message="Smart Money Sell Signal")

// Plot take profit and stop loss levels
plot(take_profit, color=color.green, linewidth=2, title="Take Profit")
plot(stop_loss, color=color.red, linewidth=2, title="Stop Loss")

// Draw risk-to-reward ratio
plotshape(risk_reward_ratio >= 1 ? 1 : 0, style=shape.triangleup, location=location.belowbar, color=color.green, size=size.small, title="Risk-Reward Ratio (Green)")
plotshape(risk_reward_ratio < 1 ? 1 : 0, style=shape.triangledown, location=location.abovebar, color=color.red, size=size.small, title="Risk-Reward Ratio (Red)")


if is_bullish
    strategy.entry("Enter Long", strategy.long)
else if is_bearish
    strategy.entry("Enter Short", strategy.short)
関連性
- サポートブレイクに基づく戦略をフォローする動的ATR傾向
- インテリジェント・インスティチュチュショナル・トレーディング・ストラクチャー モメント・ストラテジー
- コンボ 2/20 EMA & バンドパスフィルター
- EMA トレンドクラウド
- 短期シグナル戦略と EMAのクロスオーバー
- イチモク雲スムーズオシレーター
- 複数のEMAのゴールデンクロス戦略
- 全体キャンドルシグナルシステムとダブルEMAモメンタムトレンド・トレード戦略
- ダイナミック・デュアル・EMA・クロスオーバー・量子的取引戦略
- バックテスト - 指標
もっと
- 高度な15分チャート取引シグナル戦略
- PSAR と EMA ベースの定量取引戦略
- 標準偏差 DEV 取引戦略 相対強度指数 RSI と単純な移動平均 SMA をベースに
- MA,SMA 双重移動平均のクロスオーバー戦略
- リスク・リターン比率と技術分析に基づくブールフラグ・ブレイクストラテジー
- 多要素融合戦略
- Bollinger Bands + RSI + マルチMA トレンド戦略
- QQEとRSIをベースにした長期・短期信号戦略
- ゼロラグ MACD ダブルクロスオーバー取引戦略 - 短期トレンドキャプチャに基づく高周波取引
- 平均本格的な範囲をフォローするトレンドストップ戦略
- Nadaraya-Watson 封筒 多重確認動的ストップ損失戦略
- ダイナミック・テイク・プロフィート・ボリンガー・バンド戦略
- CCI + MA クロスオーバー・プルバック・買い戦略
- 高流動性通貨ペアの短期短期短期販売戦略
- MOST インディケーター 双重位置適応戦略
- Bollinger Bands RSI トレーディング戦略
- リアルタイムの価格戦略で購入・販売量ヒートマップ
- 2つの移動平均回帰取引戦略
- 多指標量的な取引戦略 - スーパー指標7対1戦略
- SMK ULTRA TREND 二重移動平均のクロスオーバー戦略