纳达拉亚-沃森带状图多重确认动态止损策略
Author: ChaoZhang, Date: 2024-05-24 17:58:47Tags: ADXDIRSIMAE

概述
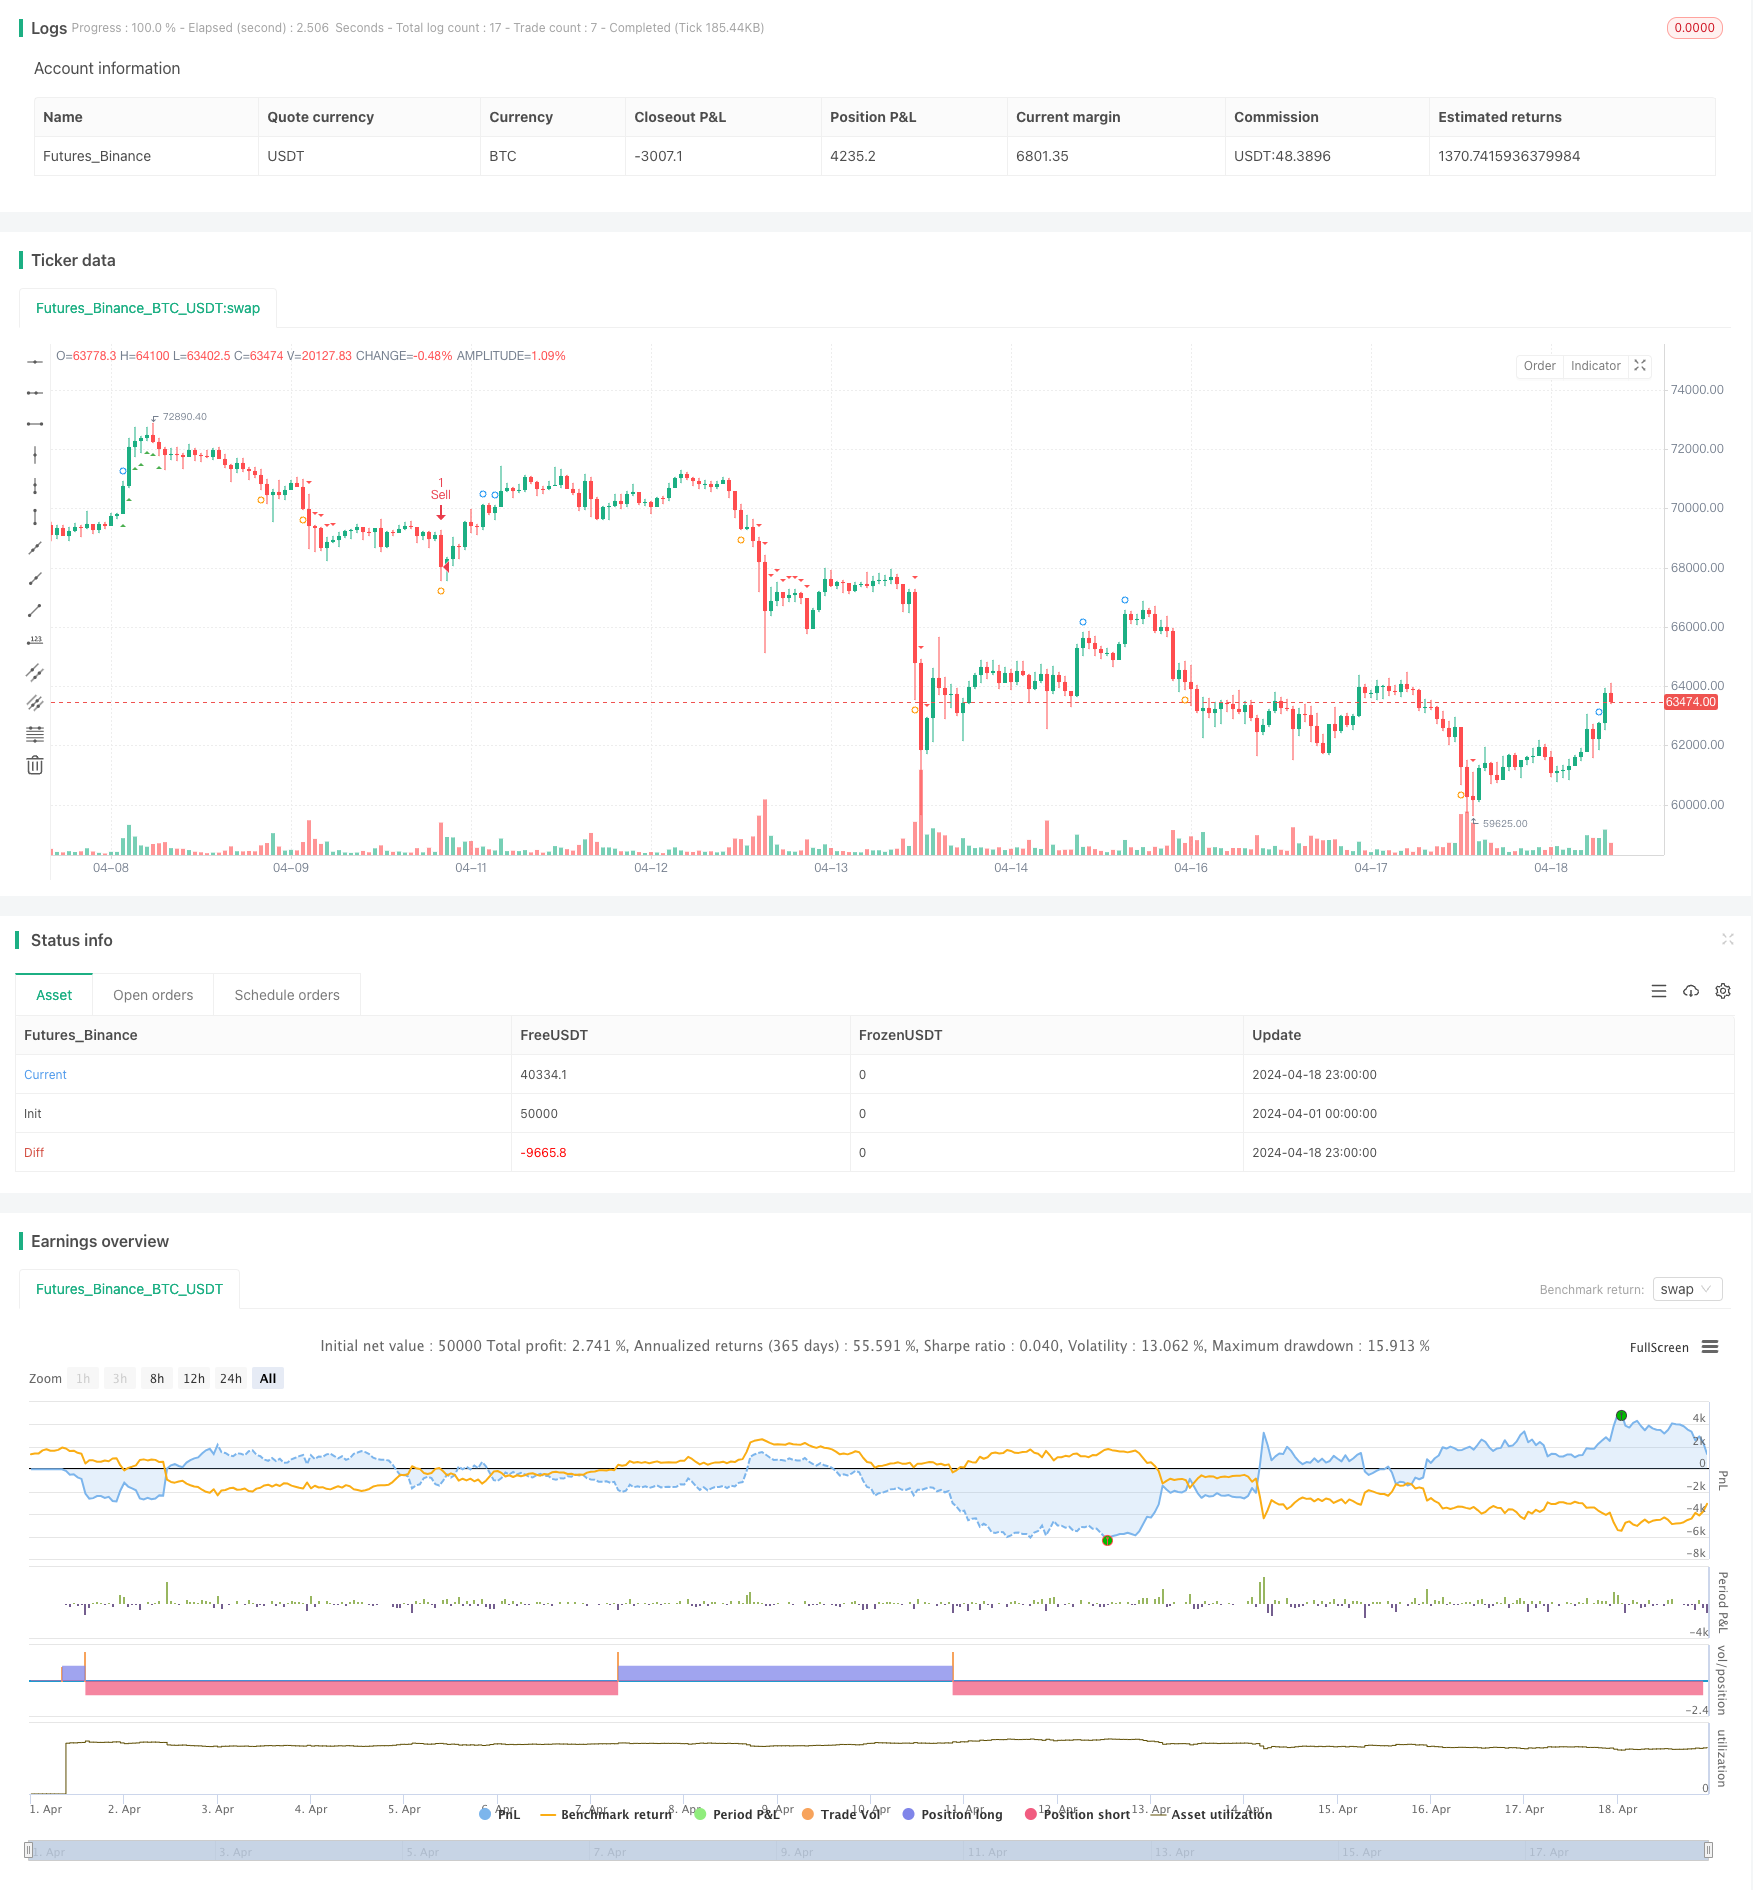
该策略利用纳达拉亚-沃森带状图对价格进行平滑处理,并根据平滑后的价格计算上下轨。然后使用ADX和DI指标判断趋势强度和方向,RSI指标确认趋势动能,同时通过价格突破上下轨来识别潜在的突破点。最后结合趋势、突破点和动能等多重信号来执行交易,并采用动态止损来管理风险。
策略原理
- 使用纳达拉亚-沃森带状图对价格进行平滑处理,计算上下轨。
- 利用ADX和DI指标判断趋势强度和方向。当ADX大于阈值,且+DI大于-DI时表示上升趋势,反之为下降趋势。
- 判断价格是否突破带状图上轨或下轨,分别表示潜在的向上突破和向下突破。
- 使用RSI指标确认趋势动能。当RSI大于70表示上升动能,小于30表示下降动能。
- 结合趋势、突破点和动能等多重信号来执行交易:
- 当存在强上升趋势、向上突破和上升动能时开多仓。
- 当存在强下降趋势、向下突破和下降动能时开空仓。
- 采用动态止损来管理风险,止损价格根据最高价/最低价和收盘价计算得出。
- 通过在图表上标注趋势线、突破点和动能信号,直观展示策略信号。
策略优势
- 纳达拉亚-沃森带状图可以有效平滑价格数据,减少噪音干扰。
- 多重信号确认机制提高了信号可靠性,趋势、突破点和动能信号互为补充,共同验证交易机会。
- 动态止损管理可以更好地适应市场波动,降低风险。止损价格根据最高价/最低价和收盘价计算得出,可以跟随市场调整。
- 在图表上直观标注趋势线、突破点和动能信号,方便用户观察和解读策略信号。
策略风险
- 在震荡市场或趋势转折期,频繁的突破信号可能导致过度交易和亏损。
- 动态止损在趋势反转时可能无法及时止损,导致回撤加大。
- 策略参数如纳达拉亚-沃森带状图的带宽、ADX的阈值等需要根据不同市场和标的进行优化,参数设置不当可能影响策略效果。
策略优化方向
- 引入更多有效的趋势判断指标,如MACD、均线系统等,提高趋势判断的准确性和稳定性。
- 优化动态止损计算方法,如考虑ATR、SAR等与波动率相关的指标,使止损更加灵活有效。
- 针对不同市场特点,如趋势型、震荡型等,设置不同的参数组合,提高策略的适应性。
- 加入仓位管理模块,根据市场趋势、波动率等因素动态调整仓位,控制风险。
总结
该策略通过纳达拉亚-沃森带状图平滑价格,结合ADX、DI等趋势指标和RSI动能指标,以及价格突破点等多重信号,构建了一个较为完善的交易系统。动态止损管理可以一定程度上适应市场变化,控制风险。但在实际应用中仍需注意优化趋势判断、动态止损和参数设置等方面,以提高策略的稳健性和盈利能力。
/*backtest
start: 2024-04-01 00:00:00
end: 2024-04-18 23:59:59
period: 1h
basePeriod: 15m
exchanges: [{"eid":"Futures_Binance","currency":"BTC_USDT"}]
*/

//@version=5
strategy("Nadaraya-Watson Envelope with Multi-Confirmation and Dynamic Stop-Loss", overlay=true)

// Input parameters
h = input.float(7.2, "Bandwidth", minval=0)
mult = input.float(2.1, minval=0)
src = input(close, "Source")

// ADX and DI Input Parameters
adxLength = input.int(14, "ADX Length")
adxThreshold = input.float(25, "ADX Threshold")
adxSmoothing = input.int(14, "ADX Smoothing")

// Calculate ADX and DI
[dmiPlus, dmiMinus, adx] = ta.dmi(adxLength, adxSmoothing)
strongTrendUp = dmiPlus > dmiMinus and adx > adxThreshold
strongTrendDown = dmiMinus > dmiPlus and adx > adxThreshold

// Nadaraya-Watson Envelope Calculation
gauss(x, h) =>
    math.exp(-(math.pow(x, 2) / (h * h * 2)))

coefs = array.new_float(0)
den = 0.0

for i = 0 to 100
    w = gauss(i, h)
    array.push(coefs, w)

den := array.sum(coefs)

out = 0.0
for i = 0 to 100
    out += src[i] * array.get(coefs, i)
out /= den
mae = ta.sma(math.abs(src - out), 100) * mult

upper = ta.sma(out + mae, 10)
lower = ta.sma(out - mae, 10)

// Confirmations
breakoutUp = ta.crossover(src, upper)
breakoutDown = ta.crossunder(src, lower)

// Original RSI period and thresholds
rsiPeriod = input.int(14, "RSI Period")
rsi = ta.rsi(src, rsiPeriod)
momentumUp = rsi > 70 and adx > adxThreshold
momentumDown = rsi < 30 and adx > adxThreshold

// // Plot ADX-based Trend Confirmation Lines
// if (strongTrendUp)
//     line.new(bar_index, low, bar_index + 1, low, color=color.new(color.blue, 50), width=2, style=line.style_dashed)

// if (strongTrendDown)
//     line.new(bar_index, high, bar_index + 1, high, color=color.new(color.red, 50), width=2, style=line.style_dashed)

// Plot Breakout Confirmation Dots
plotshape(series=breakoutUp, style=shape.circle, location=location.abovebar, color=color.blue, size=size.tiny, title="Breakout Up")
plotshape(series=breakoutDown, style=shape.circle, location=location.belowbar, color=color.orange, size=size.tiny, title="Breakout Down")

// Plot Momentum Confirmation Arrows
plotshape(series=momentumUp, style=shape.triangleup, location=location.belowbar, color=color.green, size=size.tiny, title="Momentum Up")
plotshape(series=momentumDown, style=shape.triangledown, location=location.abovebar, color=color.red, size=size.tiny, title="Momentum Down")

// Strategy Entry and Exit
var float stopLossLevel = na
var float highestPrice = na

potentialBuy = strongTrendUp and breakoutUp
potentialSell = strongTrendDown and breakoutDown
momentumConfirmUp = potentialBuy and momentumUp
momentumConfirmDown = potentialSell and momentumDown

if (momentumConfirmUp)
    strategy.entry("Buy", strategy.long)
    stopLossLevel := close * 0.90
    highestPrice := close

if (momentumConfirmDown)
    strategy.entry("Sell", strategy.short)
    stopLossLevel := close * 1.10
    highestPrice := close

if (strategy.position_size > 0)
    highestPrice := math.max(highestPrice, close)
    stopLossLevel := math.max(highestPrice * 0.85, close * 0.90)

if (strategy.position_size < 0)
    highestPrice := math.min(highestPrice, close)
    stopLossLevel := math.min(highestPrice * 1.15, close * 1.10)

// Close position if stop loss is hit
if (strategy.position_size > 0 and close < stopLossLevel)
    strategy.close("Buy")

if (strategy.position_size < 0 and close > stopLossLevel)
    strategy.close("Sell")
相关内容
- Laguerre RSI与ADX滤波交易信号策略
- 多重指标智能金字塔策略
- Johny's BOT
- VuManChu Cipher B + Divergences Strategy
- 多重均线超级趋势结合布林带突破交易策略
- 基于ATR动态管理的开市突破交易策略
- 多重技术指标交叉动量量化交易策略-基于EMA、RSI和ADX的整合分析
- 基于RSI动量和ADX趋势强度的资金管理系统
- 基于RSI、ADX和一目均衡图的多因子趋势跟踪量化交易策略
- 多指标趋势跟踪与波动突破策略
更多内容
- 基于PSAR与EMA的量化策略
- 基于相对强弱指数RSI和滑动平均SMA的波动率标准差DEV交易策略
- MA,SMA双均线交叉策略
- 基于风险回报比和技术分析的牛旗突破策略
- 多因子融合策略(Multi-factor Fusion Strategy)
- 布林带+RSI+多均线趋势策略
- 基于QQE指标和RSI指标的多空信号策略
- MACD双转换零滞后交易策略-基于短期趋势捕捉的高频交易
- 趋势跟踪平均真实波幅止损策略
- SMC与EMA策略以及P&L预测
- 波林格带动态止盈策略
- CCI+双均线交叉回撤买入策略
- 短线做空高流通货币对策略
- MOST指标双仓位自适应策略
- 布林带RSI交易策略
- 基于成交量热图与实时价格的买卖策略
- 双均线回归交易策略
- 多指标量化交易策略 - 7合1超级指标策略
- SMK ULTRA TREND 双均线交叉策略
- 五重强势移动平均策略