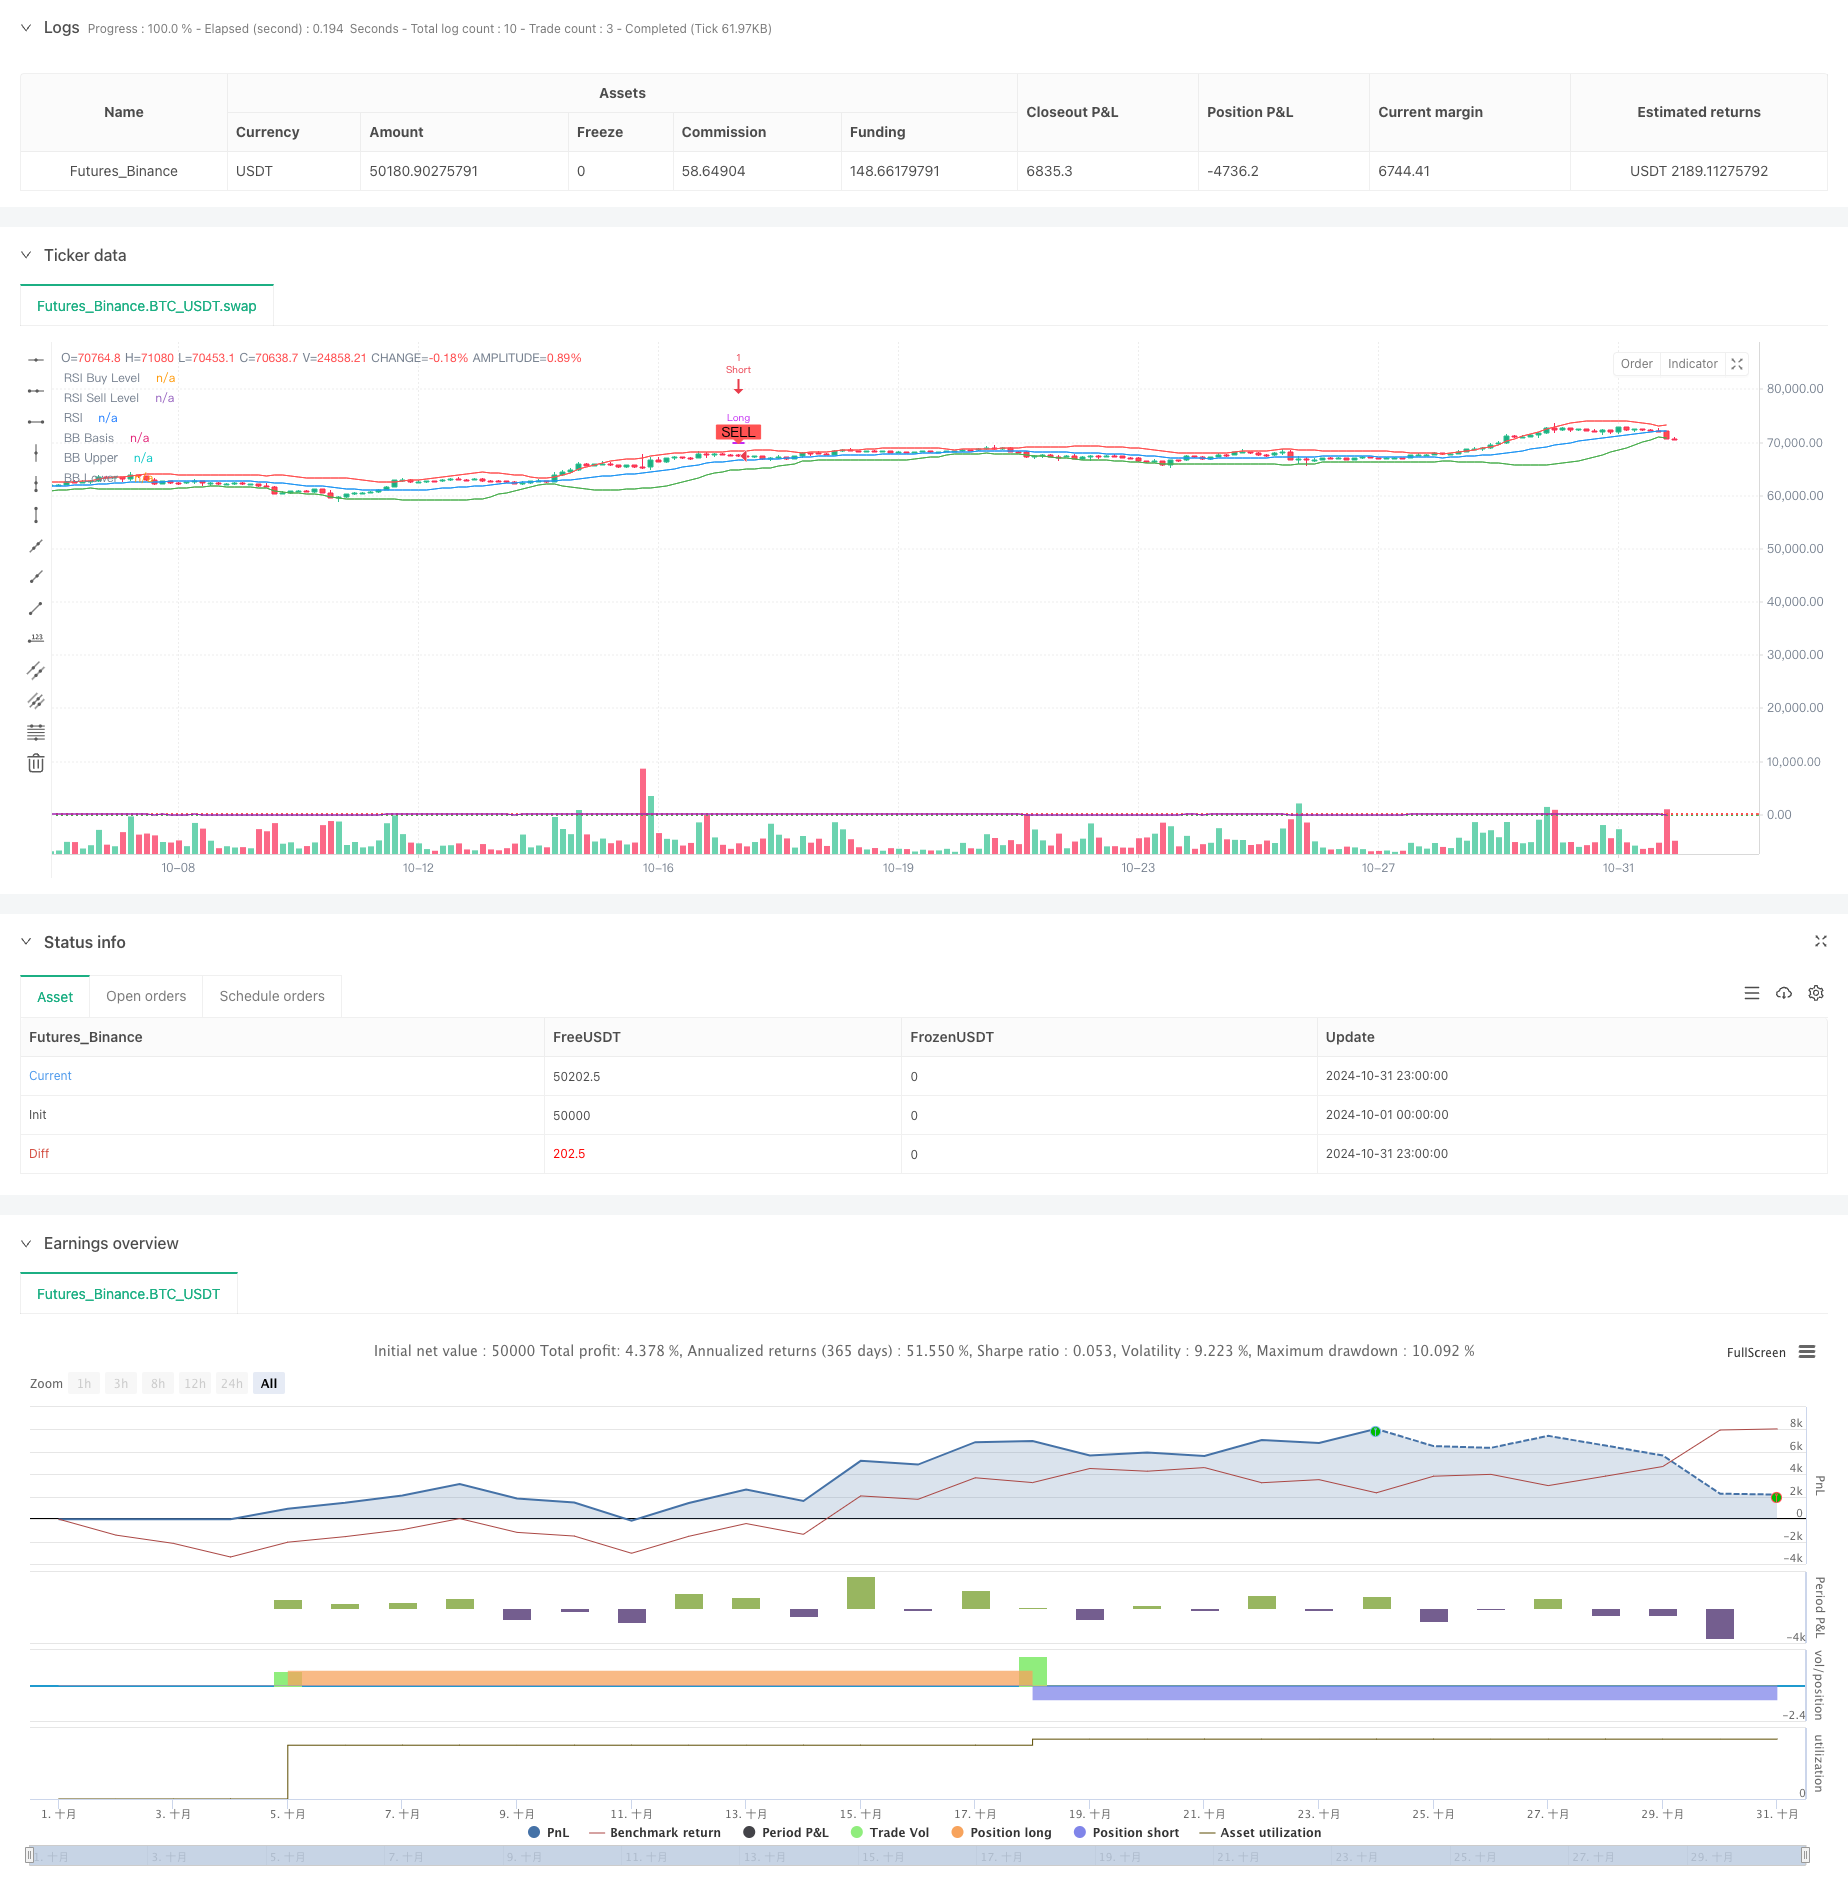
Bollinger Bands と RSI 統合による適応性振動トレンド取引戦略
作者: リン・ハーンチャオチャン,日付: 2024年11月12日11時35分58秒タグ:RSIBBマックド

概要
この戦略は,複数の技術指標を組み合わせて,ボリンジャーバンド,RSI,MACDを使用して,市場の振動やトレンド移行の間に取引機会を把握するトレンドフォローシステムである.この戦略は,リスク管理のための厳格な取引間隔制御によるピラミッド型ポジションサイズアプローチを採用している.
戦略の原則
基本的な論理は三重信号の確認に基づいています
- RSIは過売 (<45) と過買い (>55) のゾーンを特定する.
- ボリンジャー帯は価格位置を決定し,価格が帯に近づいたり,または違反したときの信号を生成します.
- MACDクロスオーバーはトレンドを確認し,RSIとボリンジャーバンド信号に準拠するとトレードを誘発する. この戦略は,過剰取引を防ぐために最低取引間隔 (15 期) を実施し,ピラミッド型ポジション管理を使用します.
戦略 の 利点
- 複数の技術指標のクロスバリダーションは,誤った信号を減らす
- ピラミッド構造により資本効率が向上する
- 最低取引間隔は取引頻度を効果的に制御します
- 調整可能な指標パラメータは,高度な適応性を提供します
- 自動的なポジション閉じるメカニズムは,リスクの露出を制御する.
戦略リスク
- 複数の指標が信号遅延を引き起こす可能性があります
- 振動市場における潜在的な頻繁な取引
- ピラミッド型ポジションは,トレンド逆転時により大きな損失をもたらす可能性があります.
- 固定RSIの
値が全ての市場条件に合致しない場合もある.
オプティマイゼーションの方向性
- 市場変動に基づく適応性RSIの
値を導入する - 信号確認のための音量指標を組み込む
- ピラミッド位置サイズ化アルゴリズムを最適化
- より柔軟なストップ・ロスのメカニズムを追加
- ダイナミックな取引間隔調整のために市場サイクル特性を考慮
概要
戦略は複数の技術指標の調整を通じてリスクを制御しながら安定したリターンを達成する.いくつかの固有の遅れにもかかわらず,戦略は適切なパラメータ最適化とリスク管理メカニズムを通じて良好な適応性と安定性を示している.将来の改善は,戦略のパフォーマンスをさらに向上させるために適応メカニズムと強化されたポジション管理の導入に焦点を当てることができる.
/*backtest
start: 2024-10-01 00:00:00
end: 2024-10-31 23:59:59
period: 3h
basePeriod: 3h
exchanges: [{"eid":"Futures_Binance","currency":"BTC_USDT"}]
*/

//@version=5
strategy("[ETH] Optimized Trend Strategy", shorttitle="Lorenzo-SuperScalping", overlay=true, pyramiding=3, initial_capital=100000, currency=currency.USD)

// === Input Parameters === //
trade_size = input.float(1.0, title="Trade Size (ETH)")
rsi_length = input.int(14, minval=1, title="RSI Length")
bb_length = input.int(20, minval=1, title="Bollinger Bands Length")
bb_mult = input.float(2.0, title="Bollinger Bands Multiplier")
macd_fast = input.int(12, minval=1, title="MACD Fast Length")
macd_slow = input.int(26, minval=1, title="MACD Slow Length")
macd_signal = input.int(9, minval=1, title="MACD Signal Length")

// === Indicators === //
// RSI
rsi = ta.rsi(close, rsi_length)

// Bollinger Bands
basis = ta.sma(close, bb_length)
dev = ta.stdev(close, bb_length) * bb_mult
upper_band = basis + dev
lower_band = basis - dev
plot(basis, color=color.blue, title="BB Basis")
plot(upper_band, color=color.red, title="BB Upper")
plot(lower_band, color=color.green, title="BB Lower")

// MACD
[macd_line, signal_line, _] = ta.macd(close, macd_fast, macd_slow, macd_signal)
macd_cross_up = ta.crossover(macd_line, signal_line)
macd_cross_down = ta.crossunder(macd_line, signal_line)

// === Signal Control Variables === //
var bool last_signal_buy = na
var int last_trade_bar = na

// === Buy Signal Condition === //
// - RSI below 45
// - Price near or below the lower Bollinger Band
// - MACD crossover
buy_signal = (rsi < 45 and close < lower_band * 1.02 and macd_cross_up)

// === Sell Signal Condition === //
// - RSI above 55
// - Price near or above the upper Bollinger Band
// - MACD crossunder
sell_signal = (rsi > 55 and close > upper_band * 0.98 and macd_cross_down)

// Ensure enough bars between trades
min_bars_between_trades = input.int(15, title="Minimum Bars Between Trades")
time_elapsed = na(last_trade_bar) or (bar_index - last_trade_bar) >= min_bars_between_trades

// === Execute Trades with Conditions === //
can_buy = buy_signal and (na(last_signal_buy) or not last_signal_buy) and time_elapsed
can_sell = sell_signal and (not na(last_signal_buy) and last_signal_buy) and time_elapsed

if (can_buy)
    // Close any existing short position before opening a long
    if strategy.position_size < 0
        strategy.close("Short")

    strategy.entry("Long", strategy.long, qty=trade_size)
    last_signal_buy := true
    last_trade_bar := bar_index

if (can_sell)
    // Close any existing long position and open a short position
    if strategy.position_size > 0
        strategy.close("Long")

    strategy.entry("Short", strategy.short, qty=trade_size)
    last_signal_buy := false
    last_trade_bar := bar_index

// === Plot Buy and Sell Signals === //
plotshape(series=can_buy, title="Buy Signal", location=location.belowbar, color=color.green, style=shape.labelup, text="BUY")
plotshape(series=can_sell, title="Sell Signal", location=location.abovebar, color=color.red, style=shape.labeldown, text="SELL")

// === RSI Levels for Visualization === //
hline(45, "RSI Buy Level", color=color.green, linewidth=1, linestyle=hline.style_dotted)
hline(55, "RSI Sell Level", color=color.red, linewidth=1, linestyle=hline.style_dotted)

// Plot the RSI for reference
plot(rsi, title="RSI", color=color.purple)
関連性
- 超三重指標 RSI-MACD-BB モメント逆転戦略
- 逆波動性ブレイクアウト戦略
- MACD-RSIクロスオーバートレンド ボリンジャーバンド最適化システムによる戦略をフォローする
- Bollinger Bands + RSI + マルチMA トレンド戦略
- 移動平均収束勢雲戦略
- 多指標の包括的な取引戦略:モメンタム,過剰購入/過剰販売,および不安定性の完璧な組み合わせ
- 高度な15分チャート取引シグナル戦略
- 多指標動的変動警告取引システム
- マルチテクニカル指標動的適応取引戦略 (MTDAT)
- 多トレンドモメンタムクロスオーバー戦略と波動性最適化システム
もっと
- E9 サメ32 パターン 定量的な価格ブレイク戦略
- オープンマーケット ダイナミックポジション調整 定量取引戦略
- 高勝率トレンドは逆転トレード戦略を意味する
- 2つの移動平均RSIトレンドモメンタム戦略
- 戦略をフォローするマルチインジケータ融合平均逆転傾向
- ATRベースのダイナミックなポジションマネジメントを備えたオープン後のブレイクアウト取引戦略
- 多指標統合とインテリジェントリスク管理 定量取引システム
- ATR波動性戦略を用いた多指標動的適応位置サイズ化
- RSI ダイナミックストップ・ロスのインテリジェント・トレーディング戦略
- 移動平均フィルター戦略による3回検証されたRSI平均逆転
- ADX (平均方向指数) とボリューム・ダイナミック・トレンド・トラッキング戦略
- 複数のボリューム・モメンタム・コンビネッド・トレーディング・戦略
- フィボナッチリトレースメントとエクステンション 多指標量的な取引戦略
- EMAフィルターによるクロスマーケット・オナイトポジション戦略
- 複数の技術指標に基づく平均逆転とトレンドフォロー戦略
- WebSocket 加速ドライバー
- 複数のスレッドが資金調達シンボルを手に入れる
- EMA/MACD/RSIのクロスオーバー戦略
- 多指標クロスオーバーモメンタム・トレーディング・戦略
- 変動停止クラウド戦略と移動平均クロスオーバーシステム