ダイナミックサポートとレジスタンス アダプティブピボット取引戦略
作者: リン・ハーンチャオチャン開催日:2025年1月10日 15:08:24タグ:ATRポイント

概要
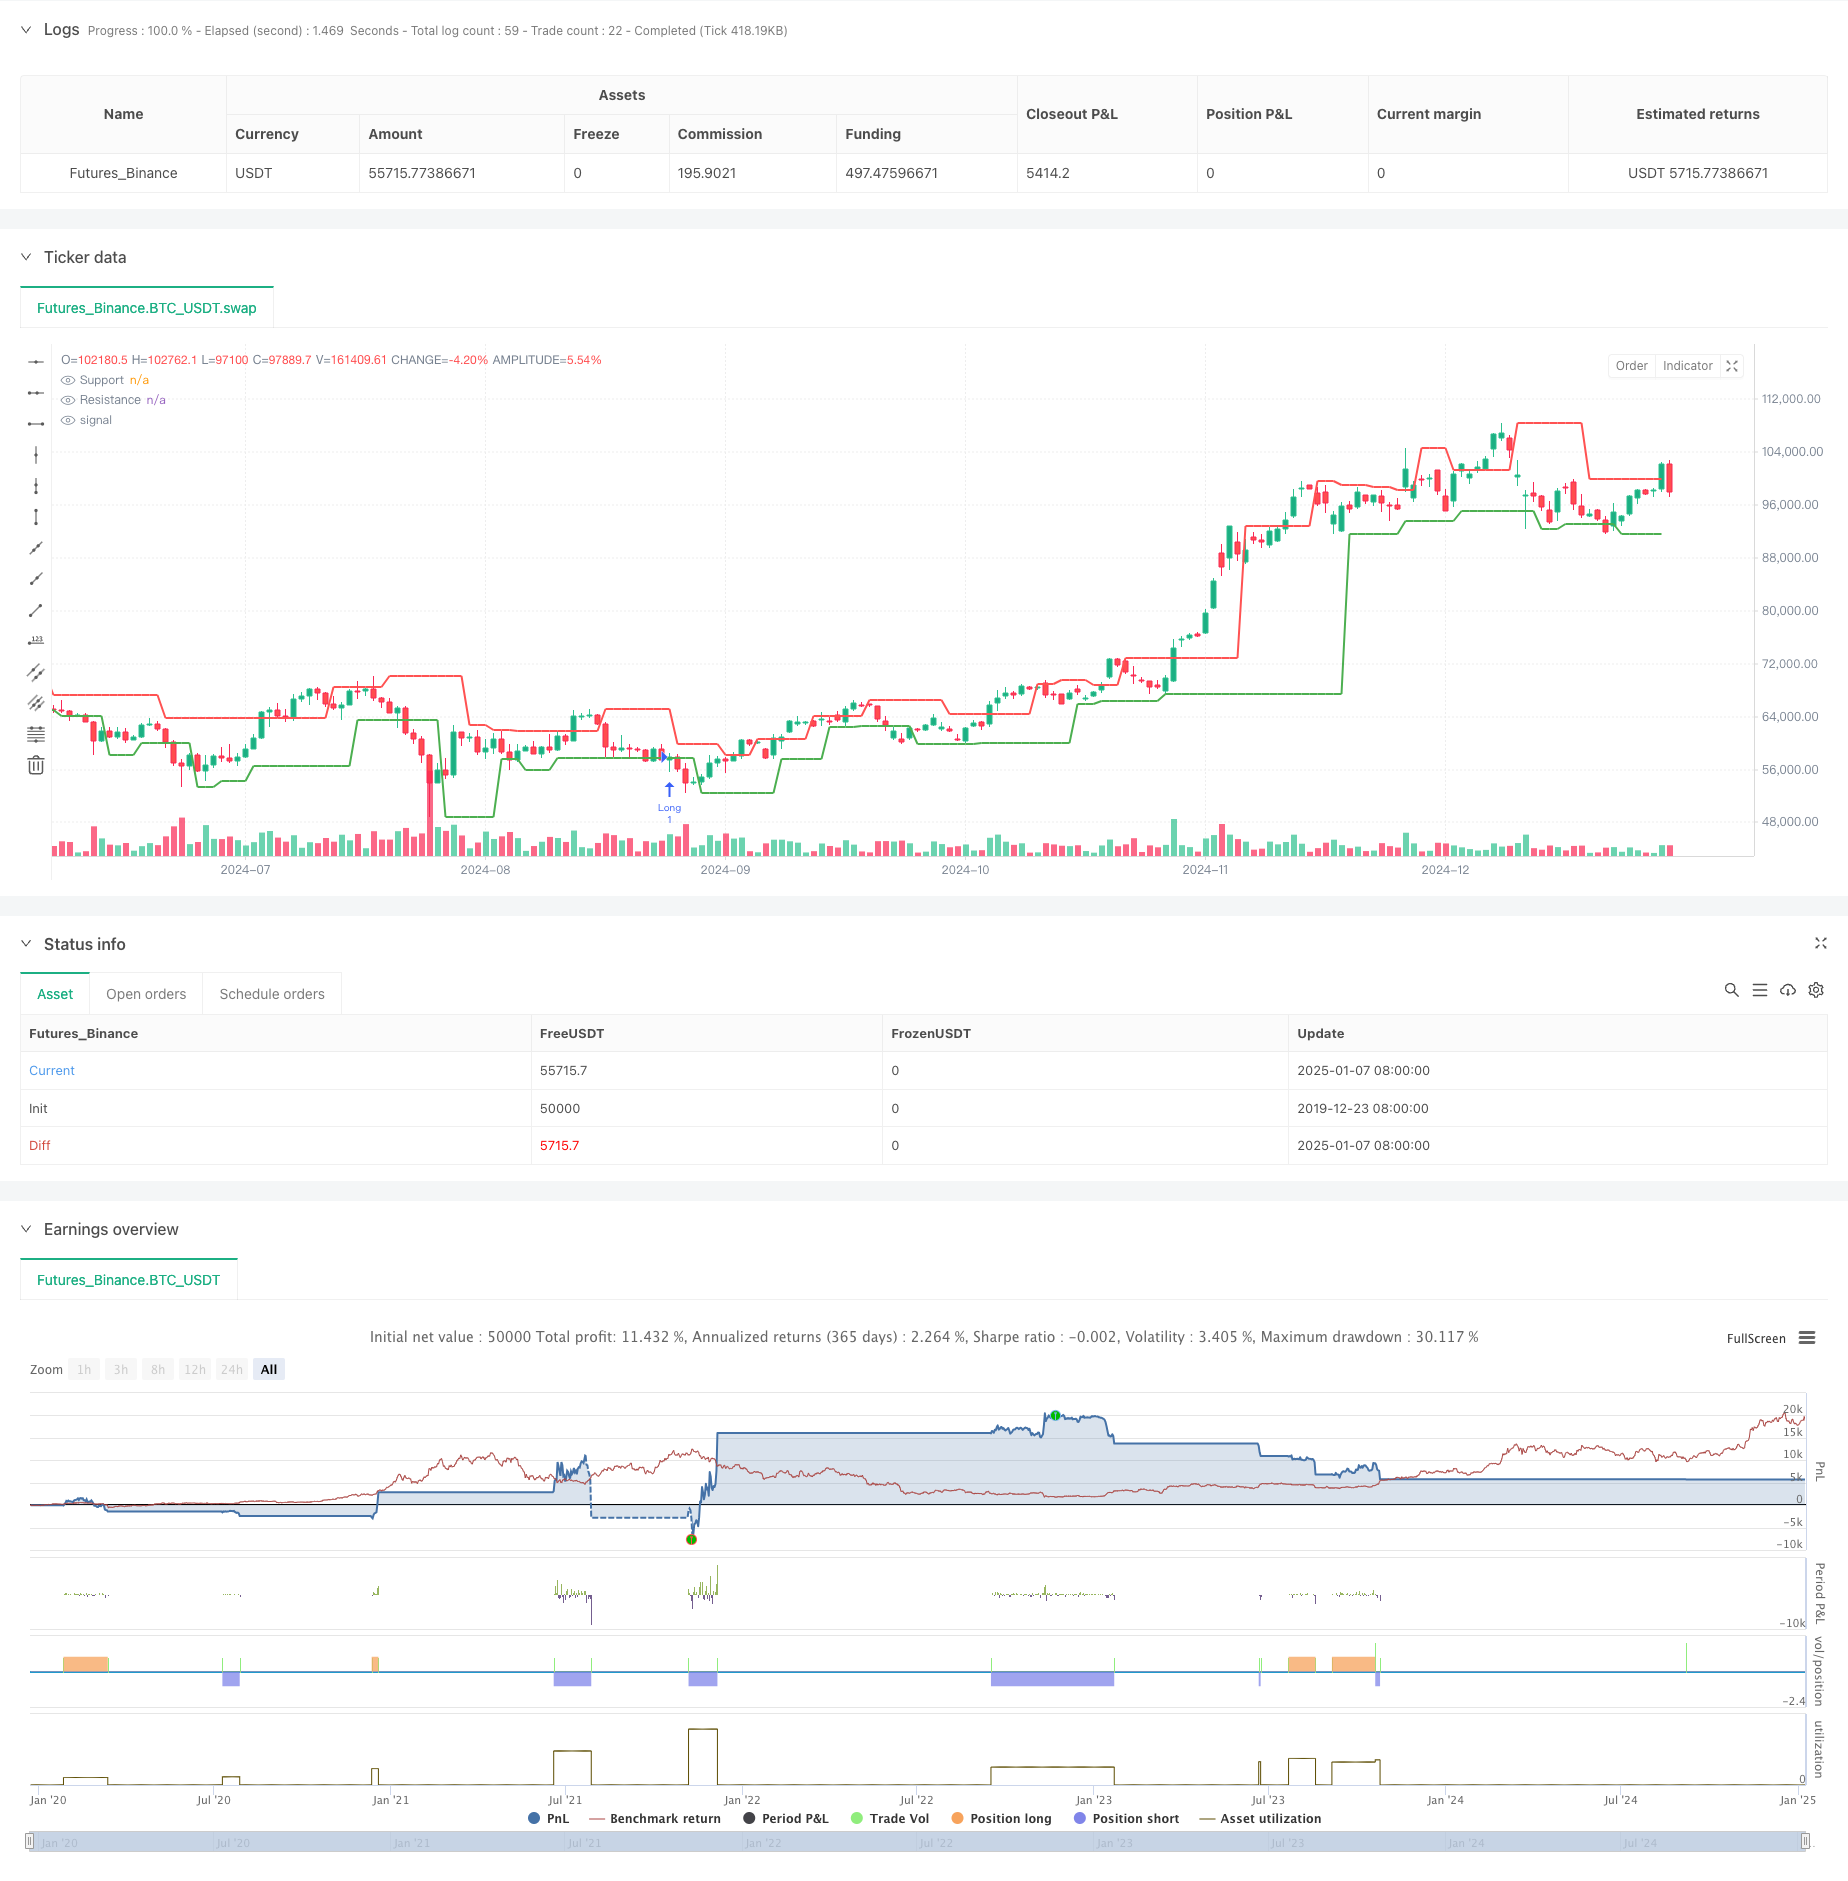
この戦略は,価格ピボットポイントを使用してサポートとレジスタンスレベルを動的に識別する適応型取引システムである. リアルタイムで地元の高値と低値を計算して主要な価格レベルを決定し,それに応じて取引を実行する. 核心の強みは動的性質にあります. 変化する市場状況に基づいて取引パラメータを調整することを可能にして,トレンドとレンジング市場の両方に適しています.
戦略の原則
基本的な論理はいくつかの重要な要素に基づいています. 1. ダイナミックピボット計算: 調整可能なピボット長パラメータ (デフォルト2) を使用して,地元の高値と低値を特定します 2. サポート/レジスタンスゾーン:有効な取引領域を定義するために,ピボットポイントの周りにパーセントベースの範囲 (デフォルト0.4%) を設定します. 3. シグナル生成: 価格がサポートを突破したときのロングシグナル,価格がレジスタンスを突破したときのショートシグナル 4. リスク管理: 動的ストップ・ロスト (10%) とテイク・プロフィート (27%) のレベルを実装し,口座資本に基づいてポジションサイズを設定する.
戦略 の 利点
- 高い適応性: 市場状況に基づいてサポート/レジスタンスレベルを動的に調整し,静的レベルからの遅れを回避する
- 制御されたリスク: 厳格な百分比ベースのストップとダイナミックなポジションサイズによって,取引ごとに合理的なリスクを維持する
- スケーラビリティ: 複数のタイムフレームとパラメータの組み合わせをサポートし,異なる市場環境での最適化
- 透明性: すべての信号と価格レベルがグラフに視覚的に表示される 明確な取引論理
戦略リスク
- 誤ったブレイクリスク: 変化する市場で誤った信号を頻繁に発生させ,サポート/レジスタンスゾーンのパラメータを調整する必要があります.
- スリップ効果: 流動性の低い市場条件では,実際の実行価格がシグナル価格と大幅に異なる可能性があります.
- トレンド依存: トレンド市場では戦略がうまく機能するが,統合段階では過剰な信号を生む可能性がある.
- パラメータ感度: パラメータ設定に大きく依存する性能,最適化のために徹底的なバックテストを必要とする
オプティマイゼーションの方向性
- 変動に基づいてパラメータを自動的に調整するための市場環境認識モジュールを追加する
- 容量及び追加の技術指標を確認信号として含める
- 市場変動に基づく動的調整でポジションサイズアルゴリズムを最適化
- 不利な期間の取引を避けるために時間フィルターを導入する
- 市場変動に基づいて動的調整を伴う適応性のあるストップ・ロスのアルゴリズムを開発する
概要
この戦略は,厳格なリスク管理と組み合わせた主要な価格レベルのダイナミックな識別を通じて,トレンドフォローおよび逆転取引のための信頼できる枠組みを提供します.いくつかのパラメータの敏感性と市場環境依存性を示していますが,継続的な最適化と精製により,異なる市場条件に一貫したパフォーマンスを可能にします.成功した実装には,トレーダーはその原則を深く理解し,特定の市場状況に応じてパラメータを調整する必要があります.
/*backtest
start: 2019-12-23 08:00:00
end: 2025-01-08 08:00:00
period: 1d
basePeriod: 1d
exchanges: [{"eid":"Futures_Binance","currency":"BTC_USDT"}]
*/

// This Pine Script™ code is subject to the terms of the Mozilla Public License 2.0 at https://mozilla.org/MPL/2.0/
// © felipemiransan

//@version=6
strategy("Dynamic Support and Resistance Pivot Strategy ", overlay=true)

// Strategy parameters
pivot_length = input.int(2, title="Pivot Length", tooltip="Pivot size to identify peaks and troughs")
support_resistance_distance = input.float(0.4, title="Support/Resistance Distance %", tooltip="Distance to consider a support or resistance level in %")

// Stop Loss and Take Profit parameters
stop_loss_pct = input.float(10.0, title="Stop Loss %", tooltip="Stop loss percentage", minval=0.1) / 100
take_profit_pct = input.float(26.0, title="Take Profit %", tooltip="Take profit percentage", minval=0.1) / 100

// Functions to identify high and low pivots
pivot_high = ta.pivothigh(high, pivot_length, pivot_length)
pivot_low = ta.pivotlow(low, pivot_length, pivot_length)

// Storing support and resistance levels
var float resistance_level = na
var float support_level = na
var float last_pivot_high = na
var float last_pivot_low = na

// Updating support and resistance based on pivots
if (not na(pivot_high))
    resistance_level := high[pivot_length]
    last_pivot_high := high[pivot_length]

if (not na(pivot_low))
    support_level := low[pivot_length]
    last_pivot_low := low[pivot_length]

// Function to check if the current price is near a support or resistance level
is_near_resistance = (not na(resistance_level)) and (close >= resistance_level * (1 - support_resistance_distance / 100)) and (close <= resistance_level * (1 + support_resistance_distance / 100))
is_near_support = (not na(support_level)) and (close >= support_level * (1 - support_resistance_distance / 100)) and (close <= support_level * (1 + support_resistance_distance / 100))

// Cross conditions variables
long_cross = ta.crossover(close, support_level) and not na(support_level)
short_cross = ta.crossunder(close, resistance_level) and not na(resistance_level)

// Entry conditions
long_condition = is_near_support and long_cross  // Buy when crossing support from below
short_condition = is_near_resistance and short_cross  // Sell when crossing resistance from above

// Order execution
if (long_condition)
    strategy.entry("Long", strategy.long)

if (short_condition)
    strategy.entry("Short", strategy.short)

// Stop Loss and Take Profit
if (strategy.opentrades > 0)
    if (strategy.position_size > 0)  // For long position
        avg_price_long = strategy.position_avg_price
        long_stop_level = avg_price_long * (1 - stop_loss_pct)
        long_take_profit_level = avg_price_long * (1 + take_profit_pct)
        strategy.exit("Exit Long", from_entry="Long", stop=long_stop_level, limit=long_take_profit_level)

    if (strategy.position_size < 0)  // For short position
        avg_price_short = strategy.position_avg_price
        short_stop_level = avg_price_short * (1 + stop_loss_pct)
        short_take_profit_level = avg_price_short * (1 - take_profit_pct)
        strategy.exit("Exit Short", from_entry="Short", stop=short_stop_level, limit=short_take_profit_level)

// Plotting support and resistance levels on the chart
plot(support_level, title="Support", color=color.green, linewidth=2, style=plot.style_line)
plot(resistance_level, title="Resistance", color=color.red, linewidth=2, style=plot.style_line)

// Adding labels to show pivot values
if (long_condition and not na(support_level))
    label.new(bar_index, low[pivot_length], str.tostring(low[pivot_length]), style=label.style_label_up, color=color.green, textcolor=color.white, size=size.small)

if (short_condition and not na(resistance_level))
    label.new(bar_index, high[pivot_length], str.tostring(high[pivot_length]), style=label.style_label_down, color=color.red, textcolor=color.white, size=size.small)
関連性
- ピボットポイント スーパートレンド
- ビラ・ダイナミック・ピボット・スーパートレンド戦略
- ミルマシーン
- 負荷が減る
- 多粒のバゲット
- 動的タイミングと波動性に基づくポジション管理戦略
- ストカスティックオシレーターに基づく波動範囲取引戦略
- アルファトレンド使用
- ダイナミックリスク管理システムによるサポート・レジスタンス戦略
- 多期スーパートレンド・ダイナミック・トレーディング・戦略
もっと
- 高周波の価格・容量傾向は,容量分析適応戦略に従って
- 強化された価格量動向の勢い戦略
- ダイナミックな利益/損失管理システムを持つインテリジェント移動平均のクロスオーバー戦略
- アダプティブ マルチMA モメントム・ブレークスルー・トレーディング・戦略
- アダプティブ・モメント・ミディアン・リバーション・クロスオーバー戦略
- 逆トレード最適化戦略を持つ適応型双方向EMAトレンド取引システム
- ATR ベースのダイナミックストップ・ロスの最適化による二重 EMA プルバック・トレーディングシステム
- 複数の期間の段階交差とEMAのトレンドフォロー戦略
- RSIの振動戦略をフォローする多動平均のクロストレンド
- 多期ボリンジャーバンド 変動リスク制御モデル付きのトレンドブレイク戦略
- 双 EMA-RSI 差異戦略:指数関数移動平均値と相対強度に基づいたトレンドキャプチャシステム
- 多期超トレンド ダイナミックピラミッド型取引戦略
- 長期トレンドSMAクロスオーバー量的な戦略
- 多技術指標 量的な取引戦略をフォローする融合傾向
- 多技術指標 モメントMA トレンド 戦略をフォローする
- スマート R2R ベースのストップ・ロスの管理を備えた三重 EMA クロスオーバー取引システム
- ダイナミック・ボラティリティ・ドリブン・ハイ・フリクション・EMA・クロスオーバー・量子戦略
- リスクマネジメントシステム付きの双重技術指標モメンタム逆転取引戦略
- EMA-スムーズなRSIとATRダイナミックストップ・ロス/テイク・プロフィートに基づいた多時間枠量的な取引戦略
- アダプティブ・フィボナッチ・ボリンジャー・バンド戦略分析