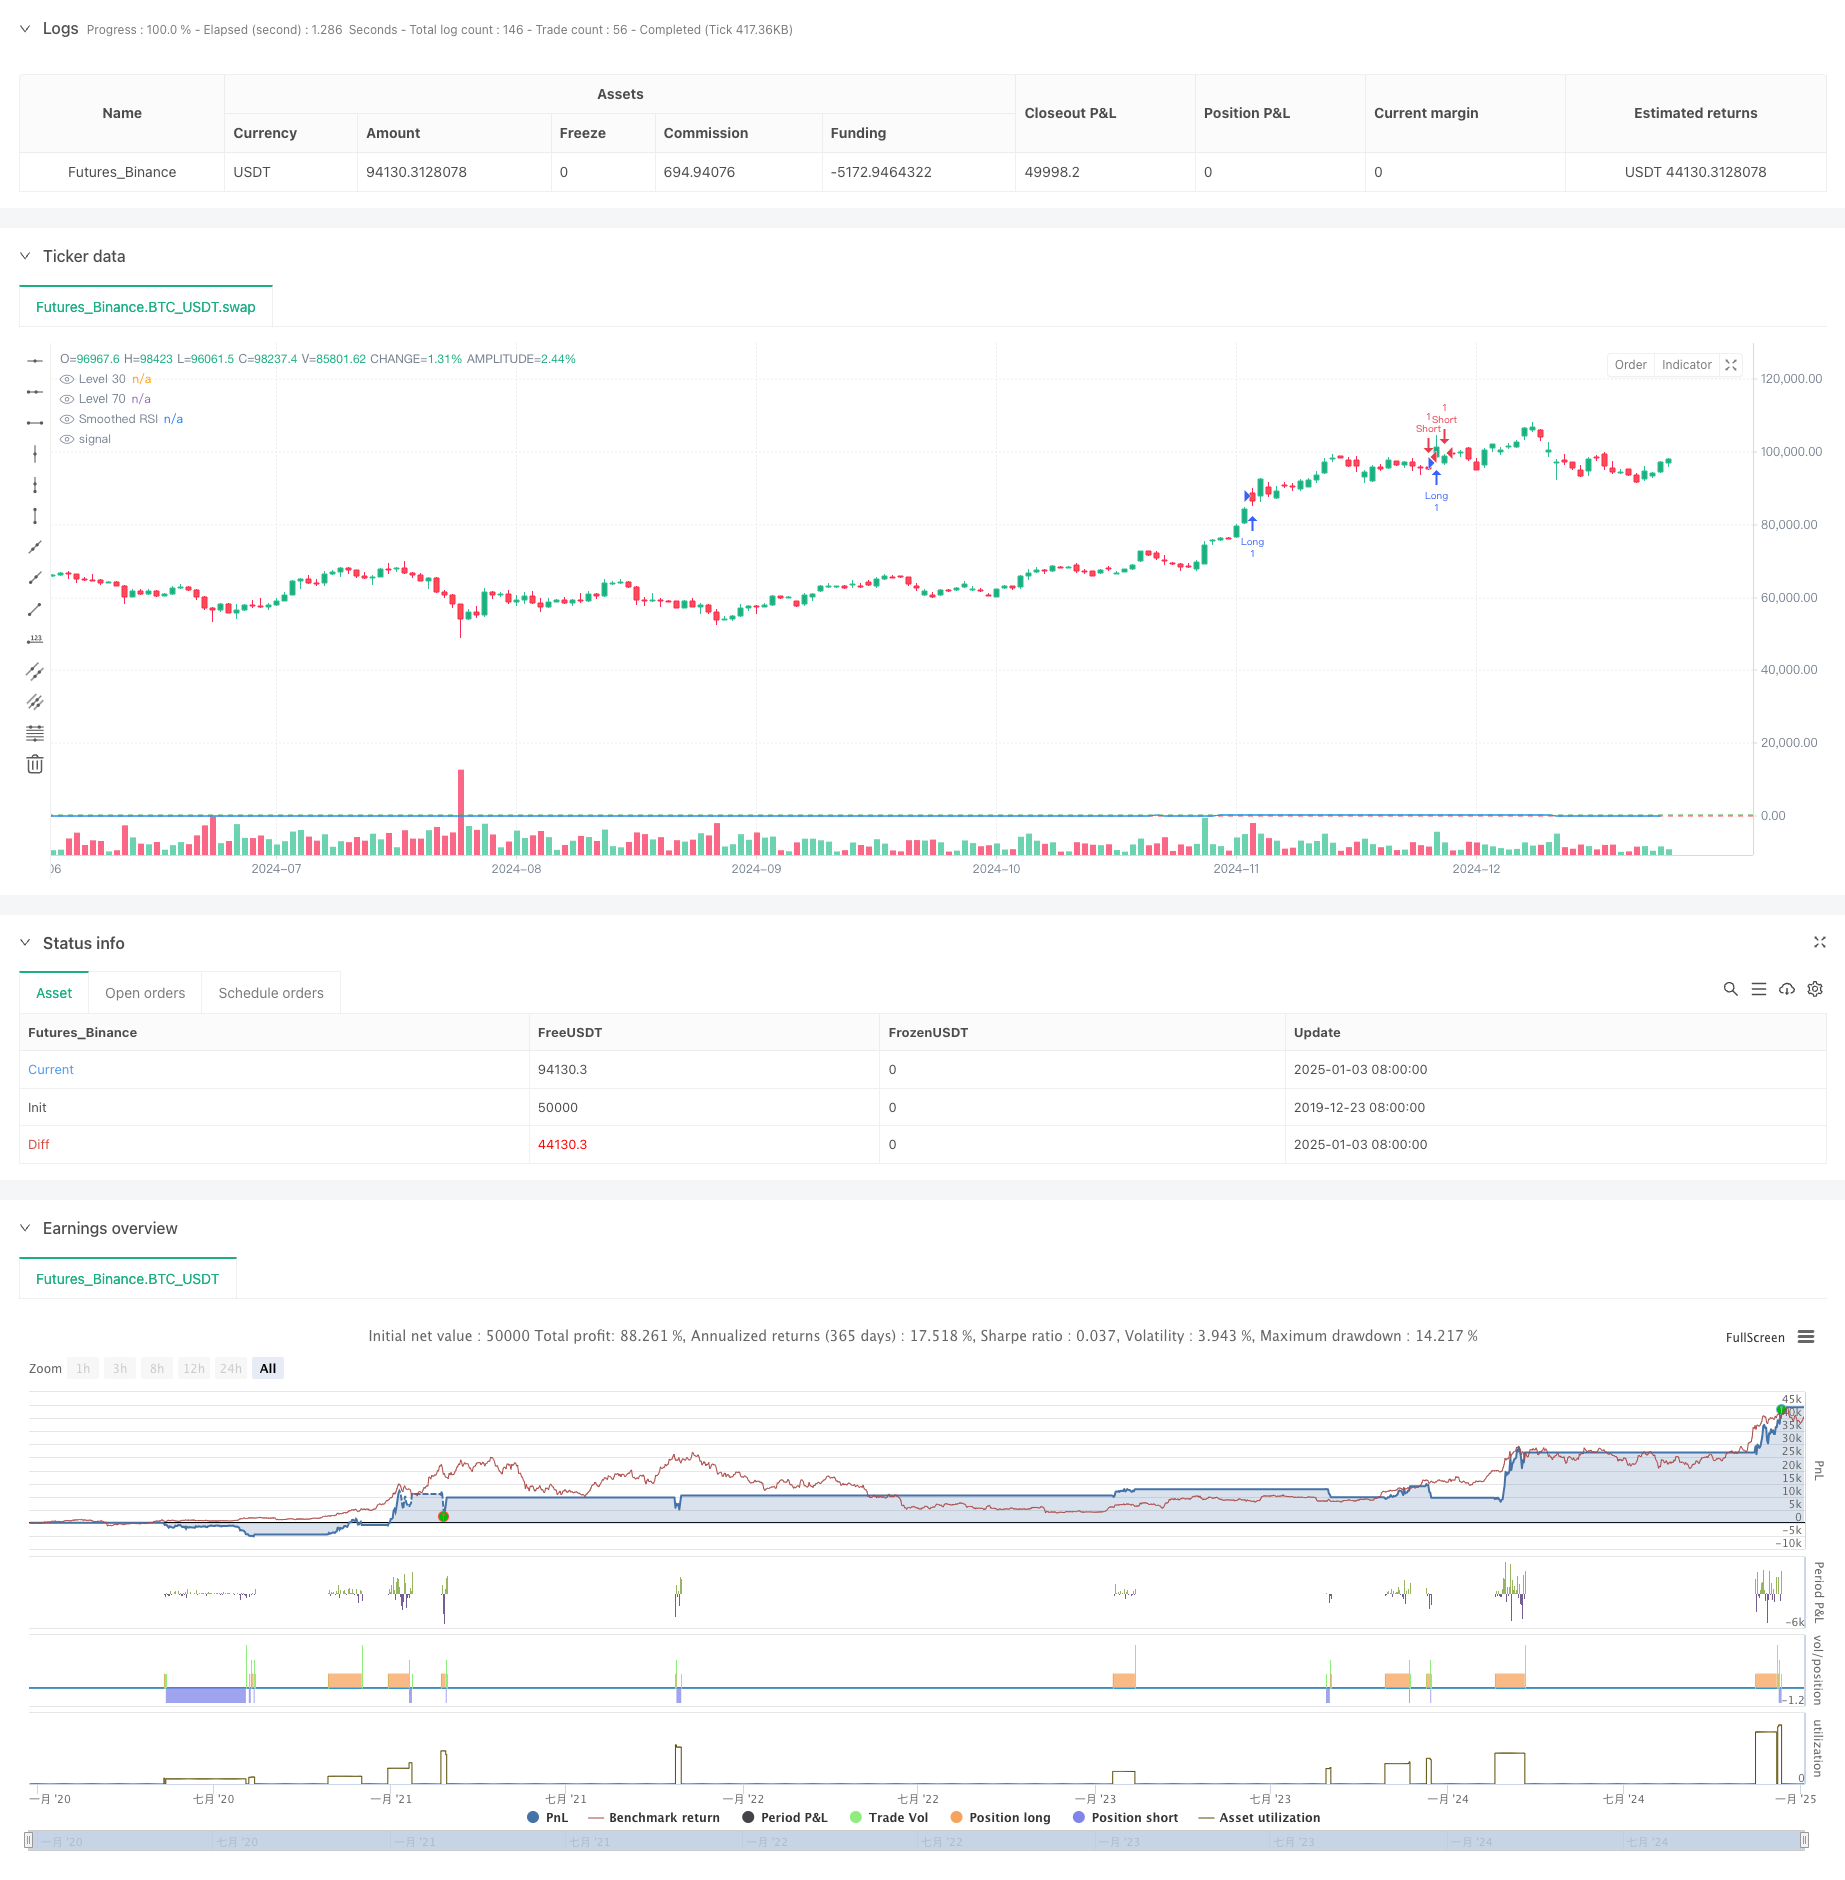
Multi-Timeframe Quantitative Trading Strategy Based on EMA-Smoothed RSI and ATR Dynamic Stop-Loss/Take-Profit
Author: ChaoZhang, Date: 2025-01-06 16:43:14Tags: RSIEMAATR

Overview
This strategy is a comprehensive quantitative trading system based on the Relative Strength Index (RSI), Exponential Moving Average (EMA), and Average True Range (ATR). The strategy smooths RSI using EMA, triggers trades through RSI breakouts at key levels, and utilizes ATR for dynamic stop-loss and take-profit levels to achieve effective risk control. Additionally, the strategy includes trade signal counting and recording functions to assist traders in backtesting and optimization.
Strategy Principle
The core logic includes the following key components:
- Uses 14-period RSI to calculate market overbought/oversold conditions
- Smooths RSI through EMA to reduce false signals
- Generates trading signals when RSI breaks through key levels of 70 and 30
- Uses ATR for dynamic calculation of stop-loss and take-profit levels
- Establishes a trade signal counting table to record price information for each trade
Strategy Advantages
- Strong Signal Smoothing: RSI smoothing through EMA effectively reduces false breakout signals
- Comprehensive Risk Control: Dynamic stop-loss using ATR adapts to market volatility
- Bi-directional Trading: Supports both long and short trading to capture market opportunities
- Parameter Adjustability: Key parameters can be customized for different market characteristics
- Visual Monitoring: Records trading signals in a table for strategy monitoring and backtesting
Strategy Risks
- RSI False Breakout Risk: Even with EMA smoothing, RSI may still generate false breakout signals
- ATR Stop-Loss Inadequacy: Improper ATR multiplier settings may lead to loose or tight stops
- Parameter Optimization Risk: Over-optimization may result in strategy overfitting
- Market Environment Dependency: Performance may vary significantly between trending and ranging markets
Strategy Optimization
- Introduce Multi-timeframe Analysis: Incorporate longer timeframe RSI signals for trade confirmation
- Optimize Stop-Loss Mechanism: Consider dynamic ATR multiplier adjustment based on support/resistance
- Add Market Environment Analysis: Include trend indicators to adjust strategy parameters
- Improve Signal Filtering: Consider adding volume indicators to filter false breakouts
- Implement Position Sizing: Dynamically adjust position size based on signal strength and volatility
Summary
The strategy combines three classic technical indicators - RSI, EMA, and ATR - to build a complete quantitative trading system. It demonstrates strong practicality in signal generation, risk control, and trade execution. Through continuous optimization and improvement, the strategy shows promise for stable performance in live trading. However, users need to consider the impact of market conditions on strategy performance, set parameters appropriately, and maintain proper risk control.
/*backtest
start: 2019-12-23 08:00:00
end: 2025-01-04 08:00:00
period: 1d
basePeriod: 1d
exchanges: [{"eid":"Futures_Binance","currency":"BTC_USDT"}]
*/
//@version=6
strategy("RSI Trading Strategy with EMA and ATR Stop Loss/Take Profit", overlay=true)
length = input.int(14, minval=1, title="RSI Length")
src = input(close, title="Source")
rsi = ta.rsi(src, length)
smoothingLength = input.int(14, minval=1, title="Smoothing Length")
smoothedRsi = ta.ema(rsi, smoothingLength) // استفاده از EMA برای صاف کردن RSI
atrLength = input.int(14, title="ATR Length")
atrMultiplier = input.float(1, title="ATR Multiplier")
atrValue = ta.atr(atrLength) // محاسبه ATR
level1 = 30
level2 = 70
// تنظیمات استراتژی
var table crossingTable = table.new(position.top_right, 2, 5, border_width=1)
var int crossCount = 0
var float crossPrice = na
// شرط ورود به معامله خرید زمانی که RSI از سطح 70 به بالا عبور میکند
if (ta.crossover(smoothedRsi, level2))
strategy.entry("Long", strategy.long)
// تنظیم حد سود و حد ضرر
strategy.exit("Take Profit/Stop Loss", "Long", stop=close - atrMultiplier * atrValue, limit=close + atrMultiplier * atrValue, comment="")
crossCount := crossCount + 1
crossPrice := close
// شرط ورود به معامله فروش زمانی که RSI از سطح 70 به پایین عبور میکند
if (ta.crossunder(smoothedRsi, level2))
strategy.entry("Short", strategy.short)
// تنظیم حد سود و حد ضرر
strategy.exit("Take Profit/Stop Loss", "Short", stop=close + atrMultiplier * atrValue, limit=close - atrMultiplier * atrValue, comment="")
crossCount := crossCount + 1
crossPrice := close
// شرط ورود به معامله خرید زمانی که RSI از سطح 30 به بالا عبور میکند
if (ta.crossover(smoothedRsi, level1))
strategy.entry("Long", strategy.long)
// تنظیم حد سود و حد ضرر
strategy.exit("Take Profit/Stop Loss", "Long", stop=close - atrMultiplier * atrValue, limit=close + atrMultiplier * atrValue, comment="")
crossCount := crossCount + 1
crossPrice := close
// شرط ورود به معامله فروش زمانی که RSI از سطح 30 به پایین عبور میکند
if (ta.crossunder(smoothedRsi, level1))
strategy.entry("Short", strategy.short)
// تنظیم حد سود و حد ضرر
strategy.exit("Take Profit/Stop Loss", "Short", stop=close + atrMultiplier * atrValue, limit=close - atrMultiplier * atrValue, comment="")
crossCount := crossCount + 1
crossPrice := close
if (not na(crossPrice))
table.cell(crossingTable, 0, crossCount % 5, text=str.tostring(crossCount), bgcolor=color.green)
table.cell(crossingTable, 1, crossCount % 5, text=str.tostring(crossPrice), bgcolor=color.green)
// ترسیم خطوط و مقادیر RSI
plot(smoothedRsi, title="Smoothed RSI", color=color.blue)
hline(level1, "Level 30", color=color.red)
hline(level2, "Level 70", color=color.green)
- RSI50_EMA Long Only Strategy
- Gold Trend Channel Reversal Momentum Strategy
- 4-Hour Timeframe Engulfing Pattern Trading Strategy with Dynamic Take Profit and Stop Loss Optimization
- Dynamic Stop-Loss Multi-Period RSI Trend Following Strategy
- ATR-RSI Enhanced Trend Following Trading System
- EMA RSI Crossover Strategy
- Han Yue - Trend Following Trading Strategy Based on Multiple EMAs, ATR and RSI
- Multi-Indicator Intelligent Pyramiding Strategy
- Multi-Timeframe Exponential Moving Average Crossover Strategy with Risk-Reward Optimization
- AlphaTradingBot Trading Strategy
- Multi-Period Supertrend Dynamic Pyramiding Trading Strategy
- Long-term Trend SMA Crossover Quantitative Strategy
- Multi-Technical Indicator Fusion Trend Following Quantitative Trading Strategy
- Multi-Technical Indicator Momentum-MA Trend Following Strategy
- Triple EMA Crossover Trading System with Smart R2R-based Stop Loss Management
- Dynamic Volatility-Driven High-Frequency EMA Crossover Quantitative Strategy
- Dual Technical Indicator Momentum Reversal Trading Strategy with Risk Management System
- Adaptive Fibonacci Bollinger Bands Strategy Analysis
- Multi-Timeframe Candlestick Pattern Trading Strategy
- Multi-Timeframe Supertrend Dynamic Trend Trading Algorithm
- Advanced MACD Crossover Trading Strategy with Adaptive Risk Management
- Quantitative Trend Capture Strategy Based on Candlestick Wick Length Analysis
- Statistical Dual Standard Deviation VWAP Breakout Trading Strategy
- Long Grid Strategy Based on Drawdown and Target Profit
- Dynamic Moving Average Crossover Trend Following Strategy with ATR Risk Management System
- Multi-Indicator Optimized KDJ Trend Crossover Strategy Based on Dynamic Stochastic Pattern Trading System
- Multi-Timeframe Heikin-Ashi Moving Average Trend Following Trading System