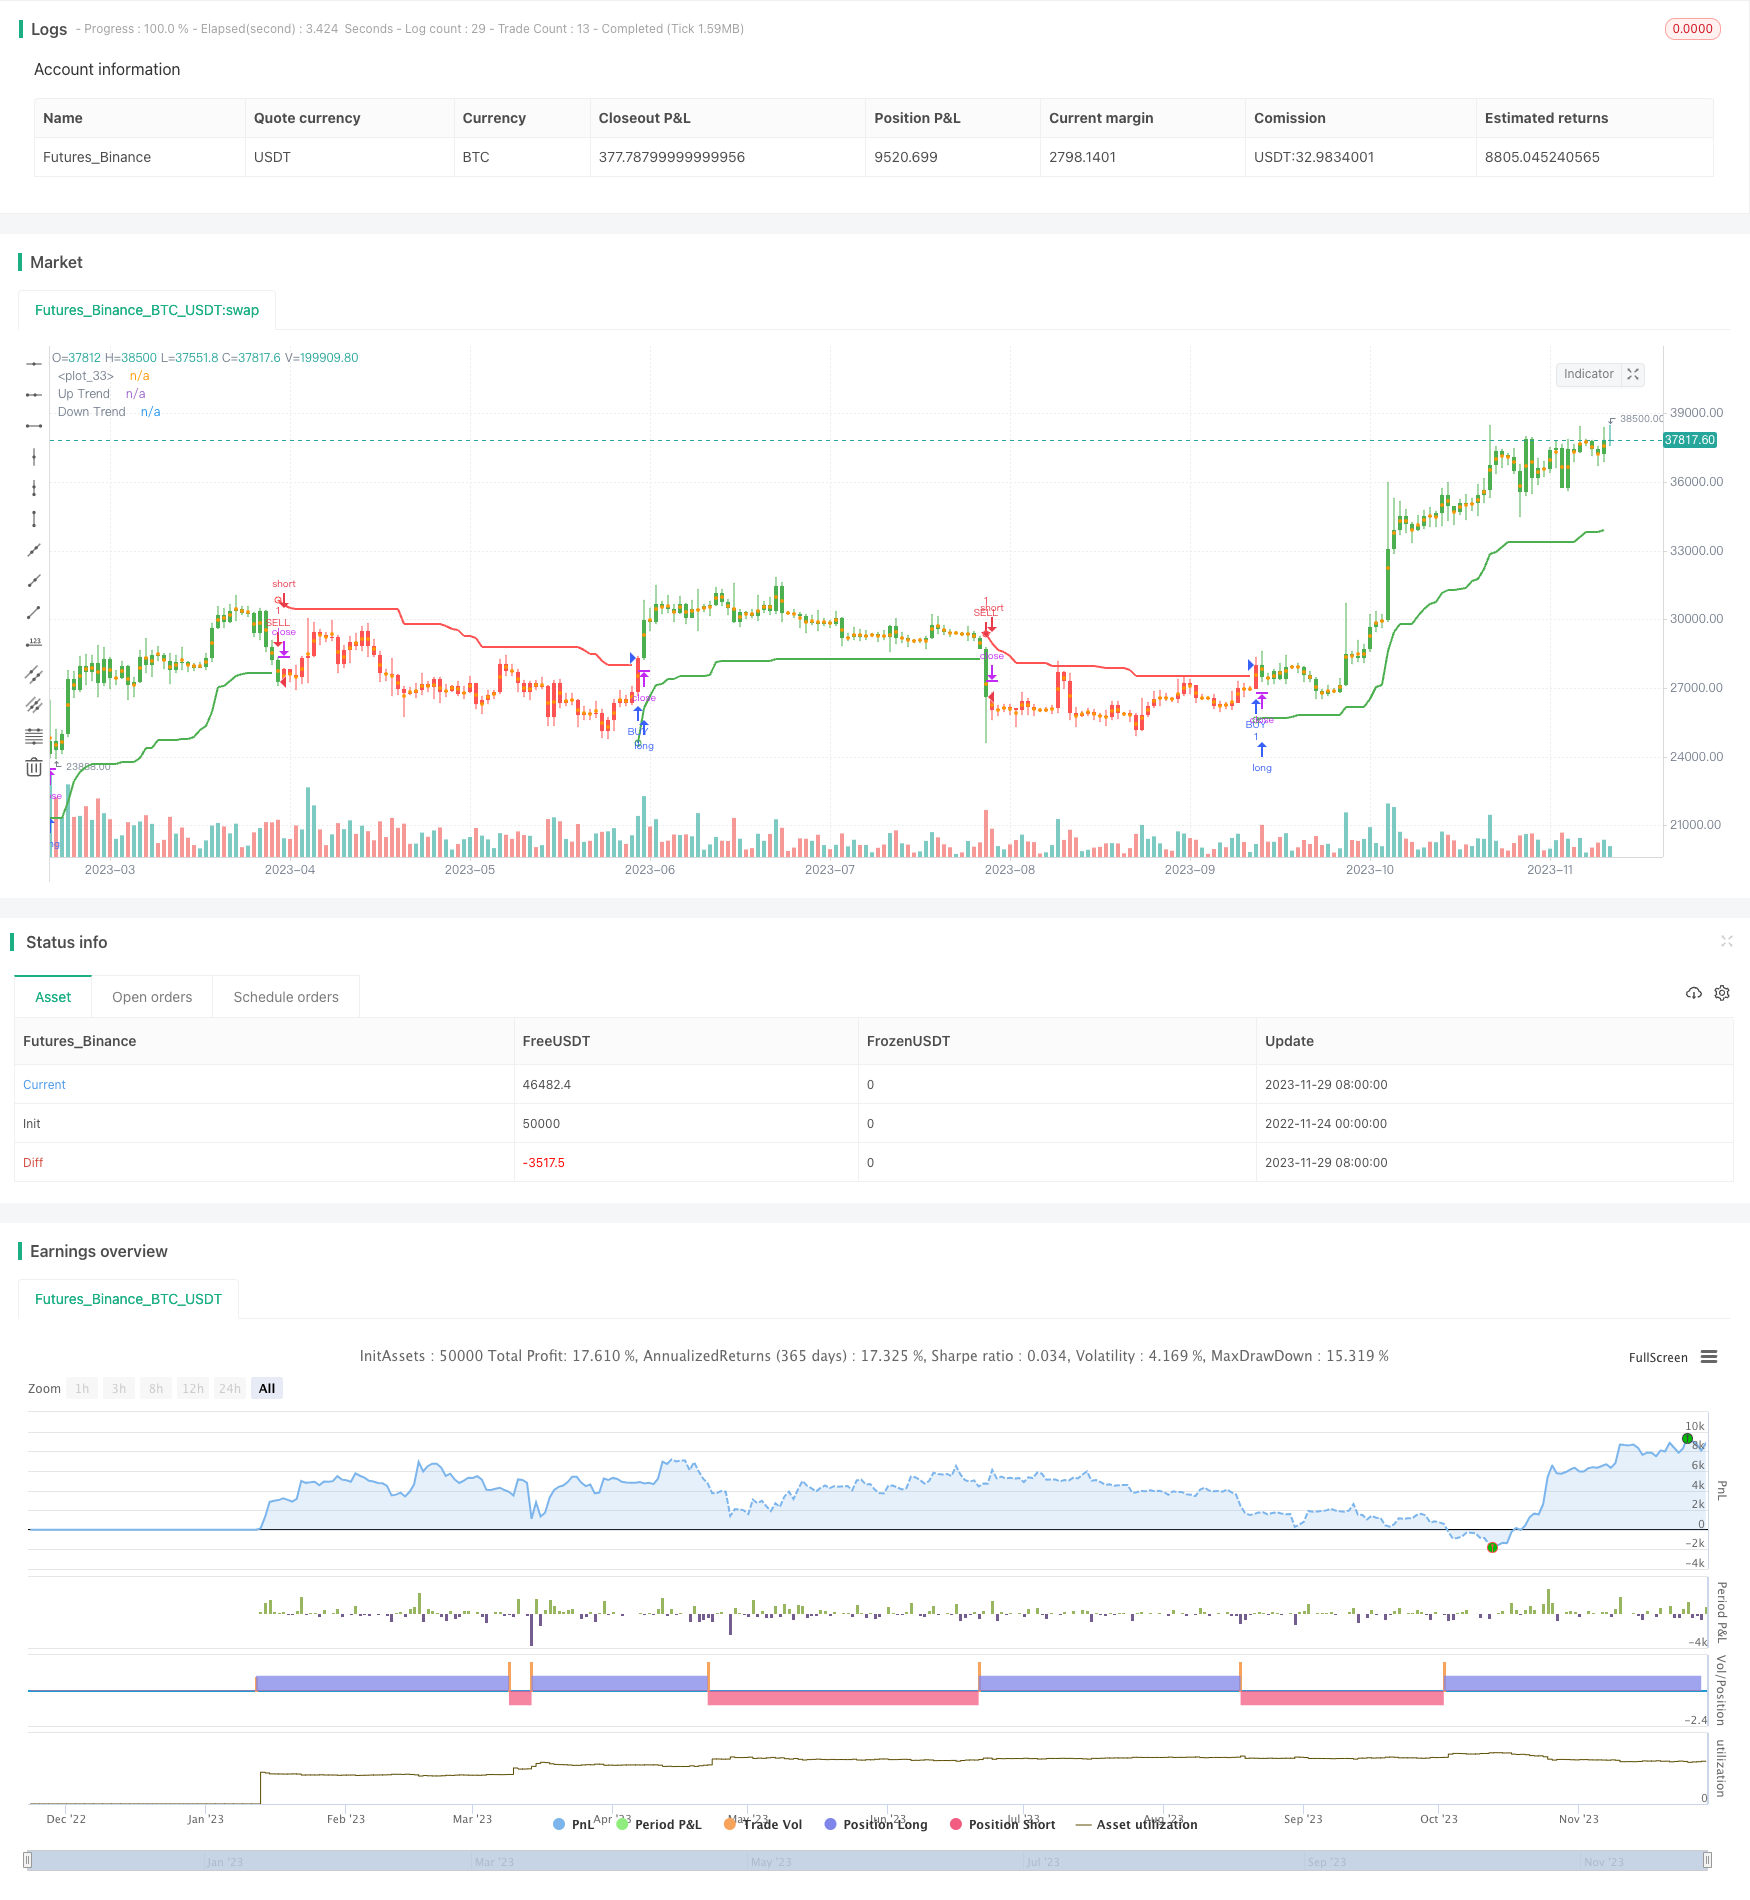
슈퍼트렌드 볼링거 밴드 전략
저자:차오장, 날짜: 2023-12-01 16:29:56태그:

전반적인 설명
슈퍼트렌드 볼링거 밴드 전략 (Supertrend Bollinger Bands strategy) 은 ATR (Average True Range) 를 기반으로 하는 일반적인 트레일링 스톱 지표 전략이다. 이 전략은 슈퍼트렌드 지표를 사용하여 차트에서 상승 및 하락 트렌드 채널을 그리며 볼링거 밴드와 결합하여 거래 신호를 생성합니다.
전략 논리
전략은 두 가지 주요 매개 변수를 사용합니다. 기간과 곱셈자, 기본 값이 각각 10 및 3입니다.
상단 줄: 닫기 - (배수 x ATR) 하위 라인: Close + (Multiplier x ATR)
종료 가격이 이전 상위 라인보다 높을 때, 그것은 상승 신호로 간주됩니다. 종료 가격이 이전 하위 라인 아래로 넘어갈 때, 그것은 하향 신호로 간주됩니다.
이 전략은 또한 볼링거 밴드 지표를 기본 라인으로 사용하고 상단 및 하단 밴드는 그로부터 두 표준 오차 떨어진 곳에 위치한다. 가격은 아래에서 중단위 위에 넘어가면 구매 신호가 생성된다. 가격은 위에서 중단위 아래로 넘어가면 판매 신호가 생성된다.
장점
- ATR을 사용하여 변동성을 동적으로 계산하여 시장 트렌드 변화를 빠르게 파악합니다.
- 볼링거 밴드를 결합하면 거래 신호가 더 신뢰할 수 있습니다.
- 사용자 정의 가능한 매개 변수는 다른 시장 환경에 적합합니다
위험성
- 마이너스 시장에서 잘못된 신호에 취약하다.
- 부적절한 매개 변수 설정으로 인해 과잉 거래가 발생할 수 있습니다.
- 트렌드 반전 포인트를 특정 지연으로 결정할 수 없습니다.
최적화 방향
- 필터를 사용하여 노이즈 트레이드를 줄이기 위해 ATR 기간 매개 변수를 최적화하십시오.
- 다른 지표를 포함하여 수익 재조명 가능성을 줄이기 위해 지원/저항을 결정합니다.
- 거래당 손실을 제한하기 위해 포지션 사이즈 규칙을 추가합니다.
요약
슈퍼트렌드 볼링거 밴드 전략은 여러 가지 기술 지표의 강점을 통합하고 동적 인 트레일링 스톱 메커니즘을 활용하여 시장 트렌드를 효과적으로 추적합니다.이 매우 사용자 정의 가능한 전략은 다른 시장에 잘 적응하여 권장되는 브레이크아웃 추격 전략입니다. 그러나 윙사와 과잉 거래와 같은 위험은 더 복잡한 시장 환경에 맞게 추가 최적화로 해결해야합니다.
/*backtest
start: 2022-11-24 00:00:00
end: 2023-11-30 00:00:00
period: 1d
basePeriod: 1h
exchanges: [{"eid":"Futures_Binance","currency":"BTC_USDT"}]
*/

// This source code is subject to the terms of the Mozilla Public License 2.0 at https://mozilla.org/MPL/2.0/
// © KivancOzbilgic


//@version=4
strategy("SuperTrend STRATEGY", overlay=true)
Periods = input(title="ATR Period", type=input.integer, defval=10)
src = input(hl2, title="Source")
Multiplier = input(title="ATR Multiplier", type=input.float, step=0.1, defval=3.0)
changeATR= input(title="Change ATR Calculation Method ?", type=input.bool, defval=true)
showsignals = input(title="Show Buy/Sell Signals ?", type=input.bool, defval=false)
highlighting = input(title="Highlighter On/Off ?", type=input.bool, defval=true)
barcoloring = input(title="Bar Coloring On/Off ?", type=input.bool, defval=true)
atr2 = sma(tr, Periods)
atr= changeATR ? atr(Periods) : atr2
up=src-(Multiplier*atr)
up1 = nz(up[1],up)
up := close[1] > up1 ? max(up,up1) : up
dn=src+(Multiplier*atr)
dn1 = nz(dn[1], dn)
dn := close[1] < dn1 ? min(dn, dn1) : dn
trend = 1
trend := nz(trend[1], trend)
trend := trend == -1 and close > dn1 ? 1 : trend == 1 and close < up1 ? -1 : trend
upPlot = plot(trend == 1 ? up : na, title="Up Trend", style=plot.style_linebr, linewidth=2, color=color.green)
buySignal = trend == 1 and trend[1] == -1
plotshape(buySignal ? up : na, title="UpTrend Begins", location=location.absolute, style=shape.circle, size=size.tiny, color=color.green, transp=0)
plotshape(buySignal and showsignals ? up : na, title="Buy", text="Buy", location=location.absolute, style=shape.labelup, size=size.tiny, color=color.green, textcolor=color.white, transp=0)
dnPlot = plot(trend == 1 ? na : dn, title="Down Trend", style=plot.style_linebr, linewidth=2, color=color.red)
sellSignal = trend == -1 and trend[1] == 1
plotshape(sellSignal ? dn : na, title="DownTrend Begins", location=location.absolute, style=shape.circle, size=size.tiny, color=color.red, transp=0)
plotshape(sellSignal and showsignals ? dn : na, title="Sell", text="Sell", location=location.absolute, style=shape.labeldown, size=size.tiny, color=color.red, textcolor=color.white, transp=0)
mPlot = plot(ohlc4, title="", style=plot.style_circles, linewidth=0)
longFillColor = highlighting ? (trend == 1 ? color.green : color.white) : color.white
shortFillColor = highlighting ? (trend == -1 ? color.red : color.white) : color.white
fill(mPlot, upPlot, title="UpTrend Highligter", color=longFillColor)
fill(mPlot, dnPlot, title="DownTrend Highligter", color=shortFillColor)
FromMonth = input(defval = 9, title = "From Month", minval = 1, maxval = 12)
FromDay   = input(defval = 1, title = "From Day", minval = 1, maxval = 31)
FromYear  = input(defval = 2018, title = "From Year", minval = 999)
ToMonth   = input(defval = 1, title = "To Month", minval = 1, maxval = 12)
ToDay     = input(defval = 1, title = "To Day", minval = 1, maxval = 31)
ToYear    = input(defval = 9999, title = "To Year", minval = 999)
start     = timestamp(FromYear, FromMonth, FromDay, 00, 00)
finish    = timestamp(ToYear, ToMonth, ToDay, 23, 59)
window()  => time >= start and time <= finish ? true : false
longCondition = buySignal
if (longCondition)
    strategy.entry("BUY", strategy.long)
shortCondition = sellSignal
if (shortCondition)
    strategy.entry("SELL", strategy.short)
buy1= barssince(buySignal)
sell1 = barssince(sellSignal)
color1 = buy1[1] < sell1[1] ? color.green : buy1[1] > sell1[1] ? color.red : na
barcolor(barcoloring ? color1 : na)
더 많은
- 빠르고 느린 EMA 골든 크로스 돌파구 전략
- RSI와 이동 평균 조합 MT5 마틴게일 스칼핑 전략
- 변동성 중지 추적 전략
- 다중 지표로 오스실레이션 포지셔닝 돌파구 전략
- RSI 평균 회전 수량 거래 전략
- 이중 이동 평균 크로스오버 역전 전략
- 이동평균선 역차선 전략
- Hull MA 채널 및 선형 회귀 스윙 거래 전략
- 트리플 슈퍼트렌드 양적 거래 전략
- ATR 및 MA 조합을 기반으로 하는 슈퍼트렌드 거래 전략
- 이중 역전 추적 전략
- 신성한 잔 전략
- 이윤의 다수 비율의 탈퇴 전략
- 가격량 변화에 기초한 가격량 트렌드 전략 변경
- 이중 이동 평균 크로스오버 전략
- 듀얼 인디케이터 콤보 미친 내일 스칼핑 전략
- 동적 그리드 거래 전략
- 이중 이동 평균 거래 전략
- 초기 수익 취득 이동 평균 개막 벨 출구 전략
- 월간 패러볼릭 브레이크업 전략