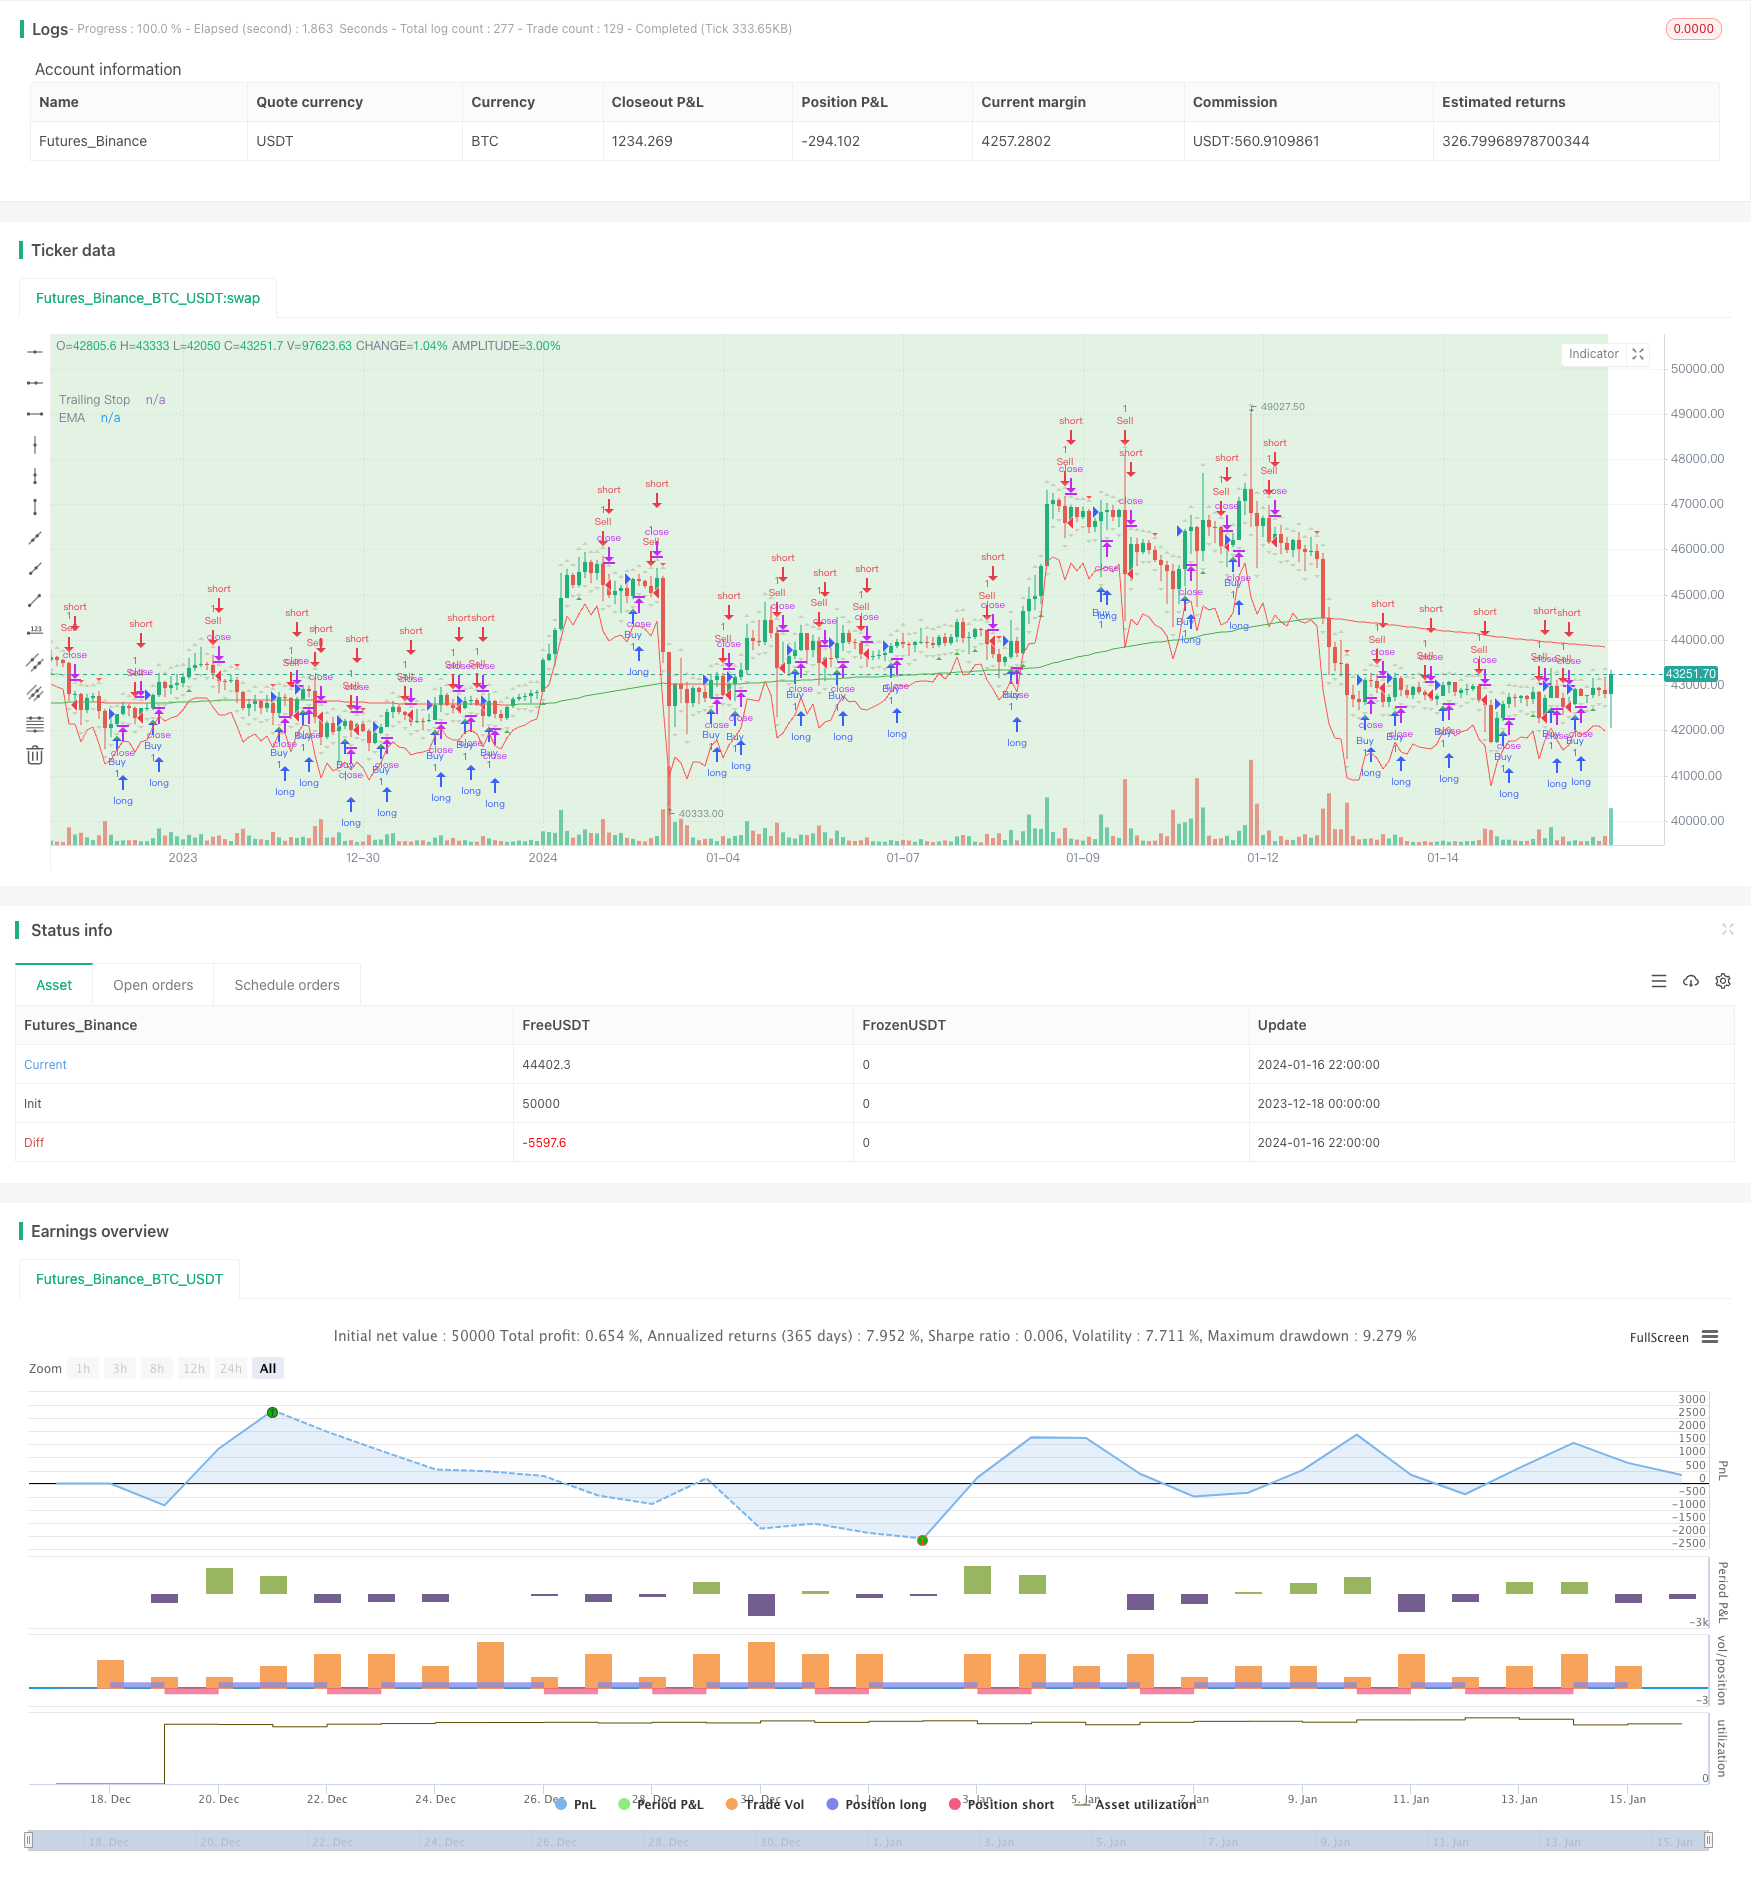
EMA와 트레일링 스톱을 가진 수요와 공급 구역에 기반한 거래 전략
저자:차오장, 날짜: 2024-01-18 16:41:16태그:

전반적인 설명
이 전략은 공급 및 수요 구역, 기하급수적인 이동 평균 (EMA), 평균 진정한 범위 (ATR) 를 트레이일링 스톱으로 활용합니다. 사용자는 EMA 설정과 신호 가시성을 조정할 수 있습니다. 이 전략은 더 높은 (HH), 더 낮은 (LL), 더 낮은 (LH), 더 낮은 (HL) 구역을 표시합니다. 신호는 세 번째 촛불 후에 표시되며 백테스팅에 적합합니다.
전략 논리
지표 계산
기하급수적인 이동 평균 (EMA):
- EMA는 일정 기간 동안의 종료 가격 (예정값: 200) 에서 계산됩니다.
- 공식: EMA = (Price_t x α) + (EMA_t-1 x (1 - α)), 여기서 α = 2/(길이 + 1)
평균 실제 범위 (ATR):
- ATR은 실제 가격 범위에서 시장 변동성을 측정합니다.
- 실제 범위는 다음 중 가장 크다.
- 전류가 높고 전류가 낮습니다.
- 현재 최고값 빼기 이전 폐쇄값의 절대값
- 현재 최저값 빼기 이전 폐쇄값의 절대값
- ATR은 일반적으로 14개의 시기를 사용합니다.
유동성 기반 트래일링 스톱의 트렌드 EMA와 ATR를 결정하는 데 사용됩니다.
공급 및 수요 구역 식별
그것은
-
높은 높은 (HH): 현재 최고치 > 이전 최고치, 상승 동력.
-
하위 하위 (LL): 현재 최저치 < 이전 최저치, 하향 모멘텀
-
높은 낮은 (HL): 현재 최저치 > 이전 최저치, 상승 계속.
-
낮은 고 (LH): 현재 최고치 < 이전 최고치, 계속 하락.
트렌드와 함께 반전 또는 계속되는 것을 식별하는 데 사용됩니다.
출입 및 출입
입력 신호: 세 번째 촛불이 닫히면 이전 최고/하위보다 높고/하위보다 낮게 구매/판매합니다.
출구: ATR에 기반한 후속 스톱 손실.
장점
- 트렌드, 역전, 변동성을 결합하여 강력한 신호를 제공합니다.
- 수요/공급 구역은 주요 S/R를 식별합니다.
- 동적 ATR 정지 변동성 조절
- 커스터마이징 가능한 매개 변수
- 간단한 입장 규칙
위험 과 개선
- 잘못된 신호: EMA 길이를 최적화합니다.
- 높은 ATR 곱셈률은 트렌드를 쫓는 위험입니다.
- 항목에 추가 필터를 고려하세요.
- 트렌드 중심의 접근을 테스트합니다.
결론
적당한 백테스트를 위한 여러 기술을 결합합니다. 실제 세계는 복잡하고 최적화가 핵심입니다. 기본 전략은 확장과 조합을 허용합니다.
/*backtest
start: 2023-12-18 00:00:00
end: 2024-01-17 00:00:00
period: 2h
basePeriod: 15m
exchanges: [{"eid":"Futures_Binance","currency":"BTC_USDT"}]
*/

//@version=5
strategy("Supply and Demand Zones with EMA and Trailing Stop", shorttitle="SD Zones", overlay=true)

showBuySignals = input(true, title="Show Buy Signals", group="Signals")
showSellSignals = input(true, title="Show Sell Signals", group="Signals")
showHLZone = input(true, title="Show HL Zone", group="Zones")
showLHZone = input(true, title="Show LH Zone", group="Zones")
showHHZone = input(true, title="Show HH Zone", group="Zones")
showLLZone = input(true, title="Show LL Zone", group="Zones")

emaLength = input(200, title="EMA Length", group="EMA Settings")
atrLength = input(14, title="ATR Length", group="Trailing Stop")
atrMultiplier = input(2, title="ATR Multiplier", group="Trailing Stop")

// Function to identify supply and demand zones
getZones(src, len, mult) =>
    base = request.security(syminfo.tickerid, "D", close)
    upper = request.security(syminfo.tickerid, "D", high)
    lower = request.security(syminfo.tickerid, "D", low)
    multiplier = request.security(syminfo.tickerid, "D", mult)
    zonetype = base + multiplier * len
    zone = src >= zonetype
    [zone, upper, lower]

// Identify supply and demand zones
[supplyZone, _, _] = getZones(close, high[1] - low[1], 1)
[demandZone, _, _] = getZones(close, high[1] - low[1], -1)

// Plot supply and demand zones
bgcolor(supplyZone ? color.new(color.red, 80) : na)
bgcolor(demandZone ? color.new(color.green, 80) : na)

// EMA with Linear Weighted method
ema = ta.ema(close, emaLength)

// Color code EMA based on its relation to candles
emaColor = close > ema ? color.new(color.green, 0) : close < ema ? color.new(color.red, 0) : color.new(color.yellow, 0)

// Plot EMA
plot(ema, color=emaColor, title="EMA")

// Entry Signal Conditions after the third candle
longCondition = ta.crossover(close, high[1]) and bar_index >= 2
shortCondition = ta.crossunder(close, low[1]) and bar_index >= 2

// Trailing Stop using ATR
atrValue = ta.atr(atrLength)
trailStop = close - atrMultiplier * atrValue

// Strategy Entry and Exit
if (longCondition)
    strategy.entry("Buy", strategy.long)
    strategy.exit("TrailStop", from_entry="Buy", loss=trailStop)

if (shortCondition)
    strategy.entry("Sell", strategy.short)
    strategy.exit("TrailStop", from_entry="Sell", loss=trailStop)

// Plot Entry Signals
plotshape(series=showBuySignals ? longCondition : na, title="Buy Signal", color=color.new(color.green, 0), style=shape.triangleup, location=location.belowbar)
plotshape(series=showSellSignals ? shortCondition : na, title="Sell Signal", color=color.new(color.red, 0), style=shape.triangledown, location=location.abovebar)

// Plot Trailing Stop
plot(trailStop, color=color.new(color.red, 0), title="Trailing Stop")

// Plot HH, LL, LH, and HL zones
plotshape(series=showHHZone and ta.highest(high, 2)[1] and ta.highest(high, 2)[2] ? 1 : na, title="HH Zone", color=color.new(color.blue, 80), style=shape.triangleup, location=location.abovebar)
plotshape(series=showLLZone and ta.lowest(low, 2)[1] and ta.lowest(low, 2)[2] ? 1 : na, title="LL Zone", color=color.new(color.blue, 80), style=shape.triangledown, location=location.belowbar)
plotshape(series=showLHZone and ta.highest(high, 2)[1] and ta.lowest(low, 2)[2] ? 1 : na, title="LH Zone", color=color.new(color.orange, 80), style=shape.triangleup, location=location.abovebar)
plotshape(series=showHLZone and ta.lowest(low, 2)[1] and ta.highest(high, 2)[2] ? 1 : na, title="HL Zone", color=color.new(color.orange, 80), style=shape.triangledown, location=location.belowbar)
더 많은
- 이치모쿠 클라우드 차트에 기초한 트렌드 전략 최적화
- 트렌드 역전과 10 오시레이터 두 가지 전략이 결합된 크로스 트렌드 역전
- 양적 거래에 이동 평균 전략과 함께 피보나치 평균 촛불
- 간단한 트레일링 스톱 & 구매 전략
- 가우스 오류 함수에 기초한 양적 거래 전략의 분석
- RSI 반전 전략
- RSI-VWAP 단기 양성 전략
- 중재에 기반한 적응형 암호화폐 그리드 거래 전략
- 이중 이동 평균 크로스오버 전략
- 이중 이동 평균 거래 전략
- 볼링거 밴드 (Bollinger Bands) 에 기반한 트렌드 다음 전략
- 확장된 가격량 트렌드 전략
- 오스실레이션 추적 단기 전략
- 공격적 인 바닥 스니핑 양적 전략
- T3 지표에 기초한 거래 전략을 따르는 경향
- 스토카스틱 인덱스에 기초한 단기 거래 전략
- 런던 SMA 크로스 ETH 리버설 거래 전략
- SMA 및 ATR 기반 트렌드 추적 전략
- Hilo 액티베이터 구매 판매 신호 전략
- 기하급수적으로 평평한 스토카스틱 오시레이터 전략