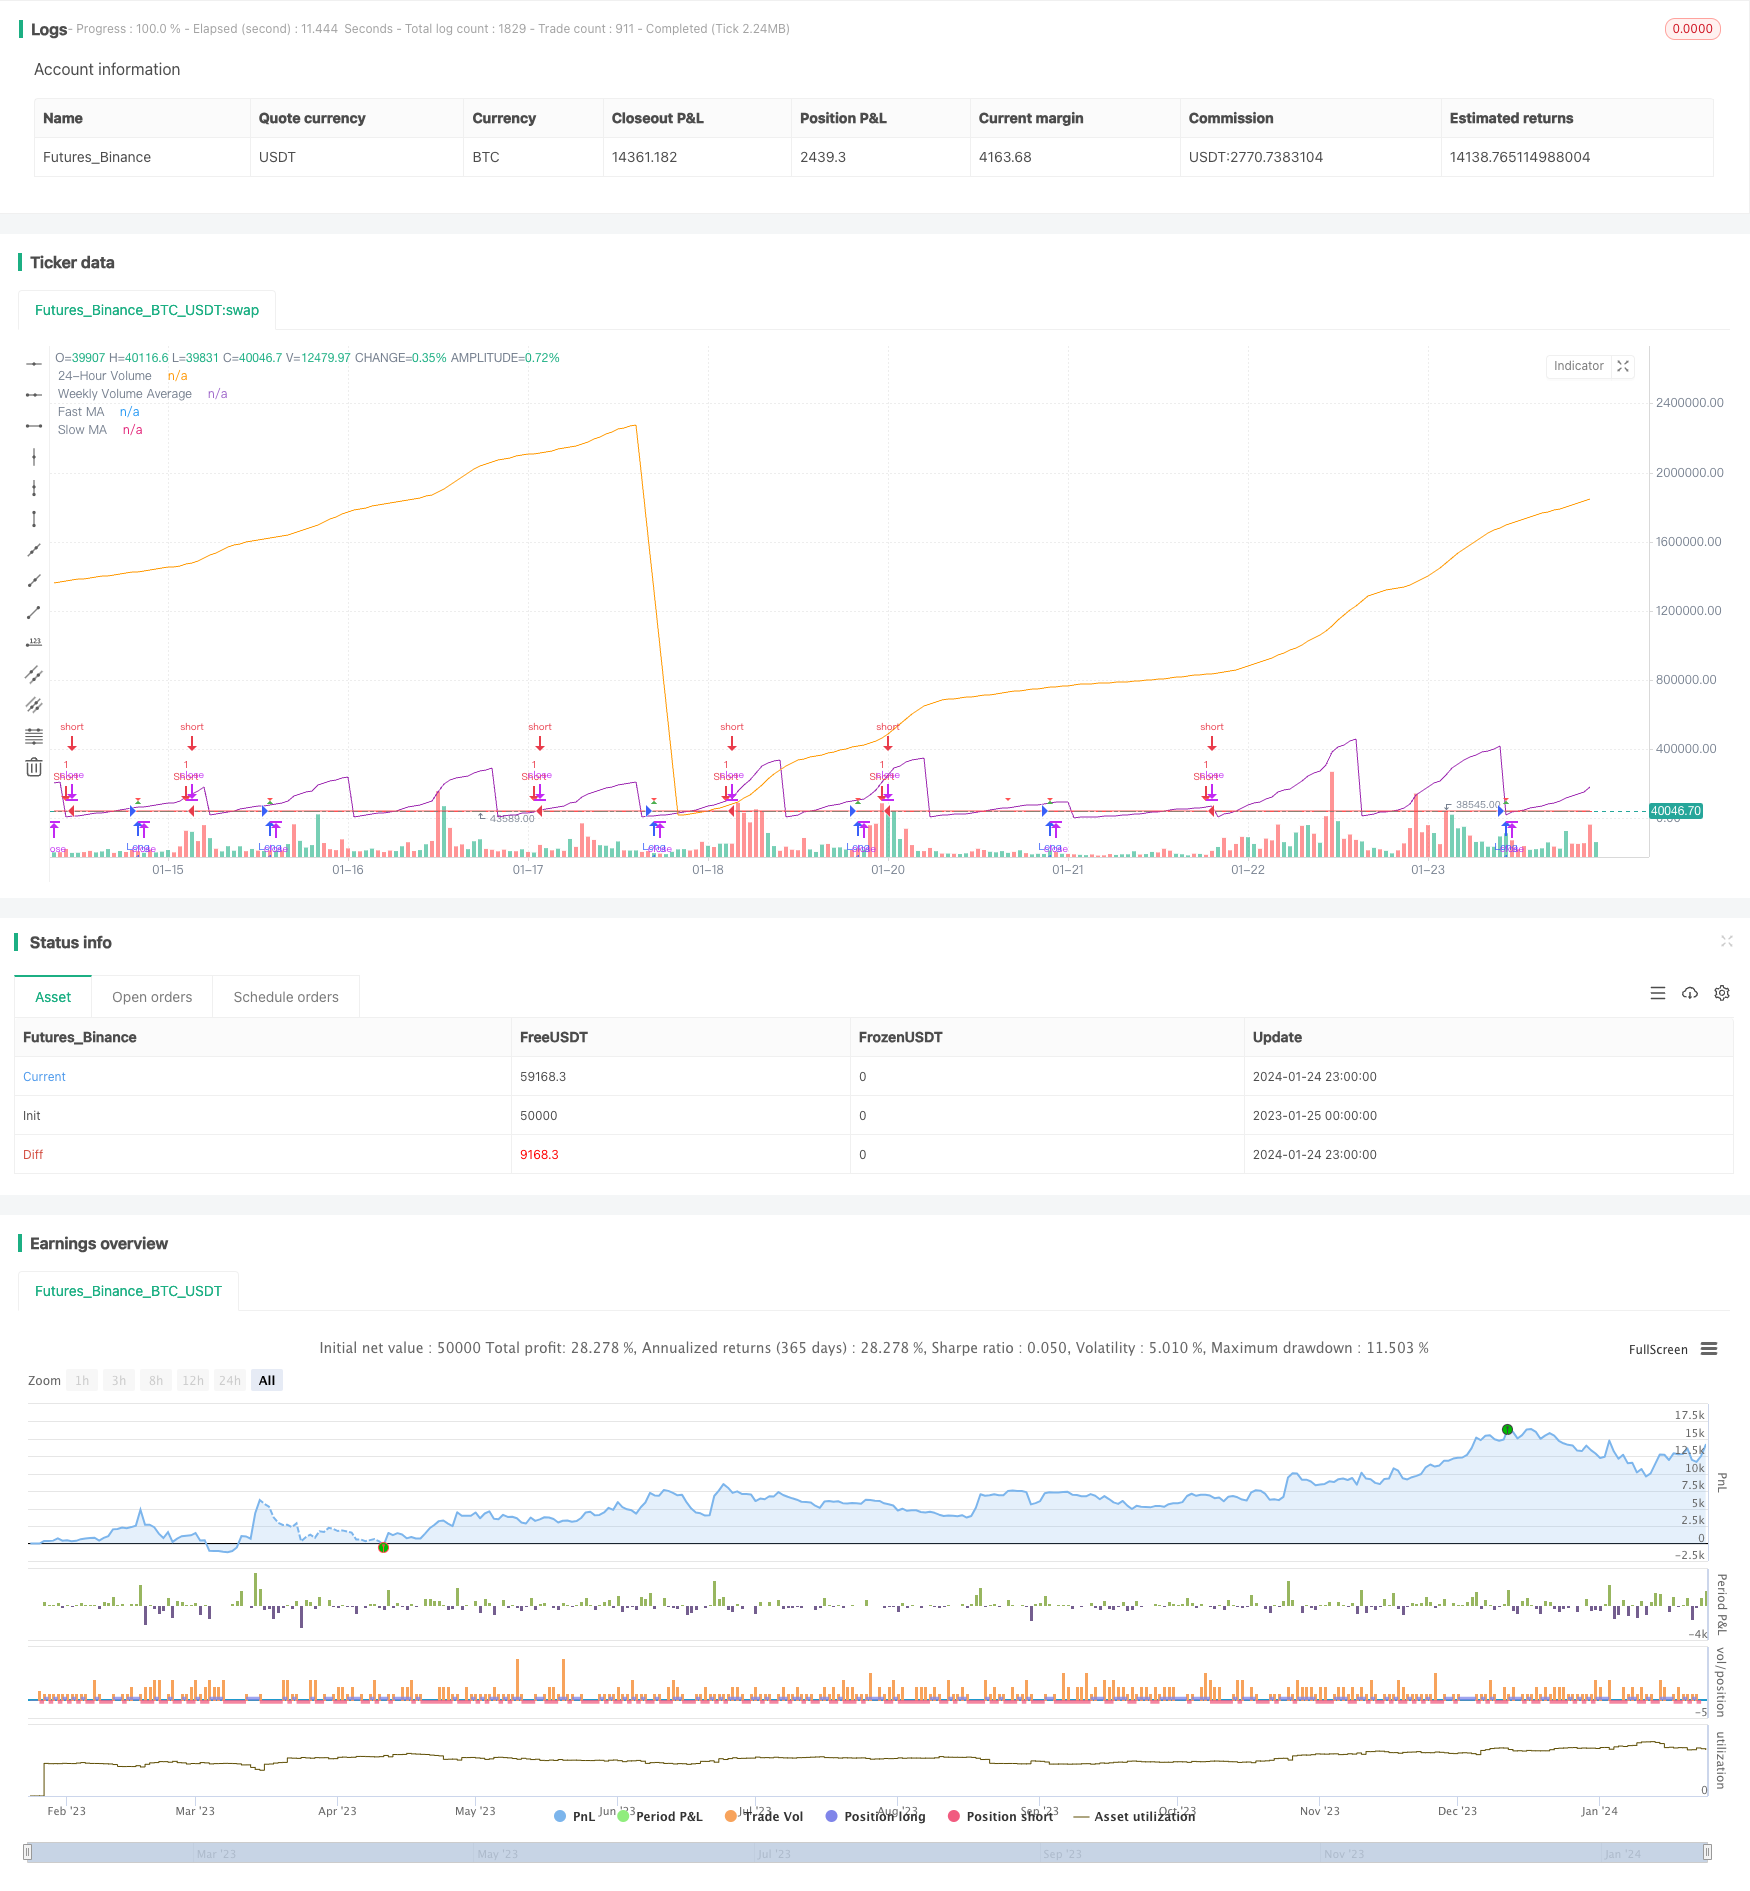
모멘텀 이동 평균 크로스오버 양자 전략
저자:차오장, 날짜: 2024-01-26태그:

전반적인 설명
이 전략은 이동 평균 및 거래량 지표를 결합하여 긴 및 짧은 입출장 규칙을 설계하여 완전한 양적 거래 전략을 형성합니다.
전략 원칙
주요 지표
- 이동 평균: 빠른 MA (파란 선) 및 느린 MA (붉은 선)
- 부피: 24시간 부피 ( 보라색) 및 7일 평균 부피 (오렌지색)
전략 조건
장기 출입 조건:
- 빠른 MA는 느린 MA를 넘습니다.
- 24시간 매출액 7일 평균 매출액의 50% 이하
짧은 출입 조건:
빠른 MA는 느린 MA보다 낮습니다.
출입 및 출입
긴 입력:긴 조건이 충족되면 길게 가십시오.
짧은 소개:짧은 조건이 충족될 때 단축
이윤을 취하고 손실을 중지합니다.롱 포지션의 수익 및 스톱 로스 레벨이 표시됩니다.
이점 분석
- 가격과 부피를 결합하면 잘못된 파장을 피합니다.
- 명확한 입국 및 출입 규칙
- 리스크를 통제하기 위해 수익을 취하고 손실을 중지하십시오.
위험 분석
- 이동 평균 전략으로 자주 거래
- 부적절한 볼륨 데이터 품질
- 매개 변수 조정에서 과잉 최적화
개선 사항:
- 거래 빈도를 줄이기 위해 MA 매개 변수를 조정
- 더 많은 데이터 소스로 신호를 확인
- 과도한 최적화를 방지하기 위해 엄격한 백테스팅
최적화 방향
- 필터 신호에 다른 표시기를 추가합니다.
- 동적 취득 및 스톱 손실
- 안정성 향상을 위한 다중 시간 프레임 분석
요약
이 전략은 MA와 볼륨 지표를 통합하여 명확한 출입 조건, 수익 / 중지 손실, 작동하기 쉬운 완전한 양 전략을 설계합니다. 빈번한 거래 문제를 예방하고 볼륨 데이터 품질 및 과잉 최적화를 모니터링해야합니다. 다음 단계는 다변수 최적화, 동적 TP / SL 및 여러 시간 프레임 분석입니다.
/*backtest
start: 2023-01-25 00:00:00
end: 2024-01-25 00:00:00
period: 1h
basePeriod: 15m
exchanges: [{"eid":"Futures_Binance","currency":"BTC_USDT"}]
*/

//@version=5
strategy("MA and Volume Strategy", overlay=true)

// Input parameters
fastLength = input(9, title="Fast MA Length")
slowLength = input(21, title="Slow MA Length")
volumePercentageThreshold = input(50, title="Volume Percentage Threshold")

// Calculate moving averages
fastMA = ta.sma(close, fastLength)
slowMA = ta.sma(close, slowLength)

// Calculate 24-hour volume and weekly volume average
dailyVolume = request.security(syminfo.tickerid, "D", volume)
weeklyVolumeAvg = ta.sma(request.security(syminfo.tickerid, "W", volume), 7)

// Strategy conditions
longCondition = ta.crossover(fastMA, slowMA) and dailyVolume < (weeklyVolumeAvg * volumePercentageThreshold / 100)
shortCondition = ta.crossunder(fastMA, slowMA)

// Set take profit and stop loss levels
takeProfitLong = close * 1.50
stopLossLong = close * 0.90

// Strategy orders
strategy.entry("Long", strategy.long, when=longCondition)
strategy.entry("Short", strategy.short, when=shortCondition)

// Plot moving averages
plot(fastMA, color=color.blue, title="Fast MA")
plot(slowMA, color=color.red, title="Slow MA")

// Plot 24-hour volume and weekly volume average
plot(dailyVolume, color=color.purple, title="24-Hour Volume", transp=0)
plot(weeklyVolumeAvg, color=color.orange, title="Weekly Volume Average")

// Plot entry signals
plotshape(series=longCondition, title="Buy Signal", color=color.green, style=shape.triangleup, size=size.small)
plotshape(series=shortCondition, title="Sell Signal", color=color.red, style=shape.triangledown, size=size.small)

// Plot take profit and stop loss levels only when a valid trade is active
plotshape(series=longCondition, title="Take Profit Long", color=color.green, style=shape.triangleup, size=size.small)
plotshape(series=longCondition, title="Stop Loss Long", color=color.red, style=shape.triangledown, size=size.small)
더 많은
- 2년 새로운 고 리트레이션 이동 평균 전략
- 이중 이동 평균 거래 전략
- 동적 위치 재균형 트렌드 추적 시스템
- 매일 오픈 역전 전략
- 골든 크로스 SMA 거래 전략
- 골든 크로스 이동 평균 전략
- MACD 암호화 거래 전략
- 선형 회귀 및 이중 이동 평균 단기 전략
- 세 번 겹치는 스토카스틱 모멘텀 전략
- 동력 트렌드 전략
- 이중 이동 평균 역전 및 ATR 트레일링 스톱의 조합 전략
- 리버웨이드 마틴게일 선물 거래 전략
- 모멘텀 풀백 전략
- 이중 촛불 예측 폐쇄 전략
- CMO와 WMA를 기반으로 한 이중 이동 평균 거래 전략
- 스토카스틱 슈퍼트렌드 추적 스톱 로스 거래 전략
- 전략에 따른 이중 역전 오시일레이팅 밴드 트렌드
- DMI와 RSI를 기반으로 한 트렌드 다음 전략
- 양적 지원 및 저항 오스실레이션 전략
- 3개의 EMA, DMI 및 MACD를 가진 트렌드를 따르는 전략