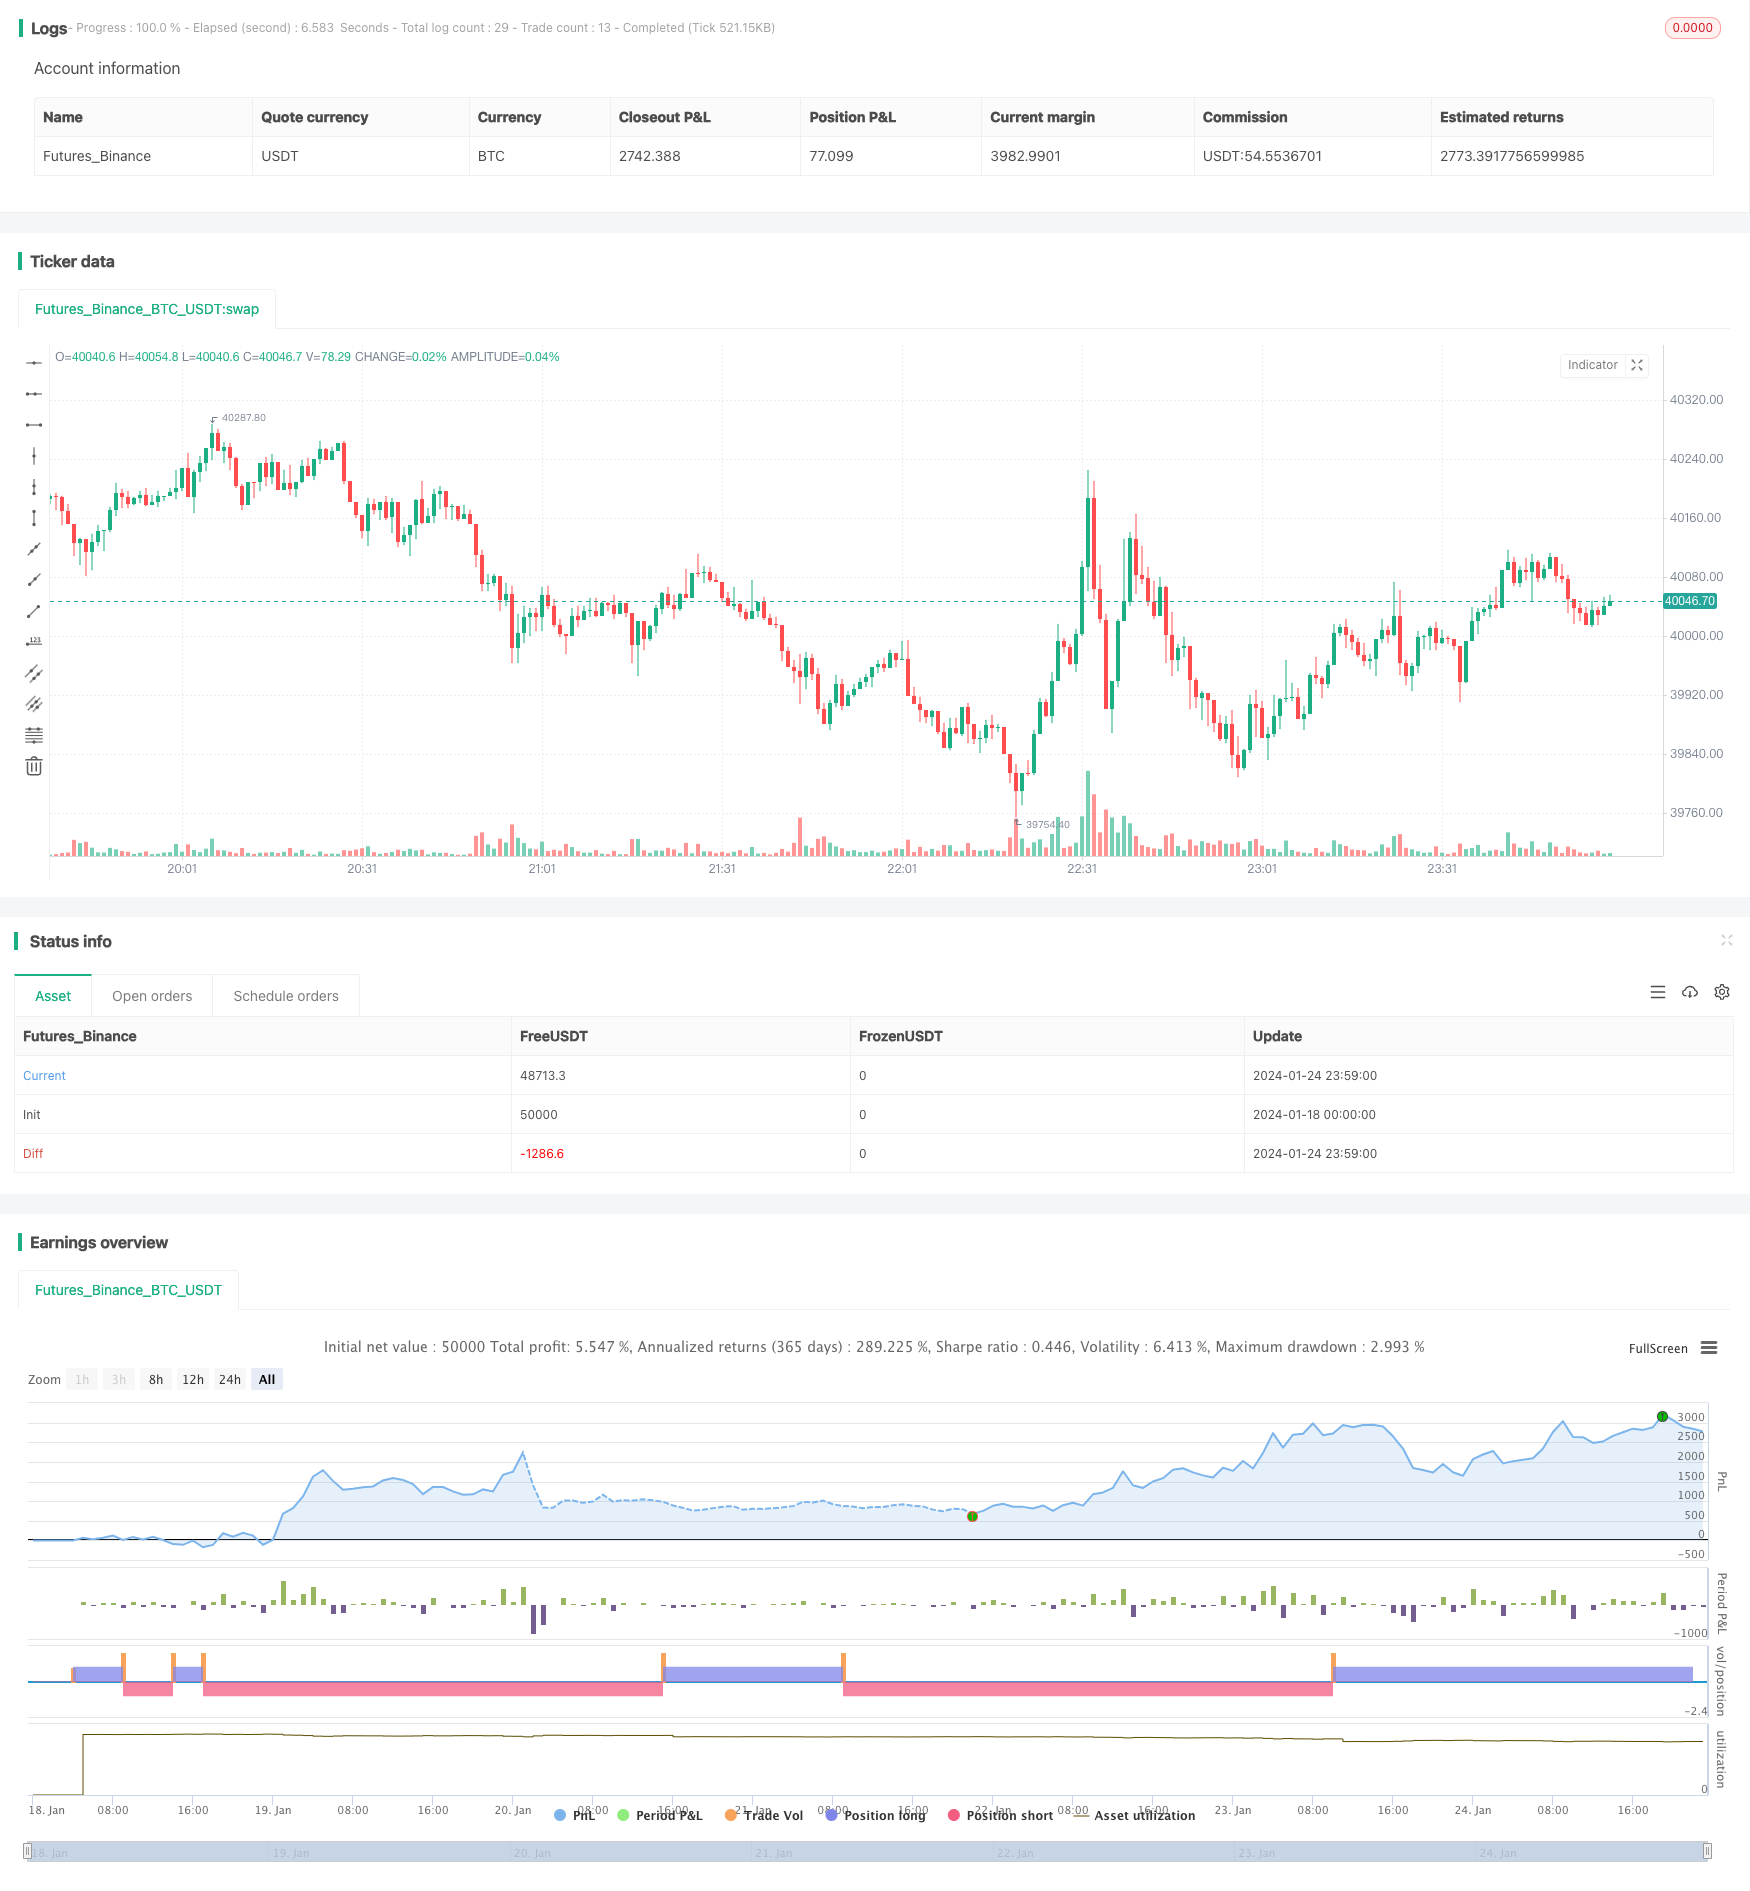
개요
이 전략은 평평한 이동 평균과 스토카스틱 지표의 조합을 기반으로하며, 트렌드에서 더 많은 기회를 잡는 것을 목표로 한다. 이 전략은 주로 두 개의 다른 주기에서 지표 이동 평균을 사용하여 전략 신호를 형성하며, 스토카스틱 지표의 K선과 D선의 교차로와 함께 입점 시기를 선택하여 트렌드에서 더 높은 수익률을 기대한다.
전략 원칙
이 전략은 12주기 및 26주기 두 개의 평평한 이동 평균을 사용한다. 빠른 선이 아래에서 느린 선을 통과할 때, 더 많이 한다. 빠른 선이 위에서 아래에서 느린 선을 통과할 때, 공백을 한다. 가짜 신호를 필터링하기 위해, 빠른 선과 느린 선의 동향을 요구하며, 빠른 선은 느린 선 위에만 더 많이 할 수 있고, 빠른 선은 느린 선 아래에만 공백을 한다.
스토카스틱 지표의 K선과 D선이 교차하는 것은 입시 시점으로 선택한다. K선이 D선과 교차할 때, 오버 바이 라인 아래 방향에서 더 많이 하고, K선이 오버 세일 라인 아래 방향에서 D선과 교차할 때, 공백을 한다.
평평한 이동 평균은 트렌드 방향을 결정하고, 스토카스틱 지표는 노이즈를 필터링하고, 진입 시기를 선택한다. 이 둘의 조합은 트렌드에서 더 많은 수익 기회를 얻을 수 있다.
전략적 이점
- 평평한 이동 평균 전략은 트렌드를 쉽게 추적할 수 있도록 그 자체로 진행되는 것이 특징입니다.
- 스토카스틱 지표 필터링 Noise를 사용하여 수익률을 높인다.
- 빠른 선과 느린 선의 조합, 빠른 선이 느린 선 근처로 회귀하면 더 나은 도박 기회를 얻을 수 있습니다.
- 스토카스틱 지표의 K선과 D선 교차 조합을 사용하여 더 나은 입점 지점을 선택할 수 있습니다.
따라서 이 전략은 순차적으로 선택적으로 기회를 잡을 수 있으며, 더 높은 수익률을 얻을 수 있습니다.
위험 분석
- 단기간에 퇴장 위험이 크다. 빠른 선이 느린 선으로 회전할 때, 신호가 거부되거나 막힐 수 있다.
- 시장이 급격하게 변할 때 빠르게 적응할 수 없고, 큰 손실을 초래할 수 있기 때문입니다.
이러한 위험을 줄이기 위해, 우리는 스톱로드를 설정하거나, 더 느슨한 이동 평균 파라미터 조합을 사용할 수 있습니다.
최적화 방향
이 전략은 다음의 몇 가지 측면에서 더 개선될 수 있습니다.
- 다른 이동 평균 변수의 조합을 테스트하여 더 나은 변수를 찾습니다.
- 다른 Stochastic 변수의 조합을 테스트합니다.
- 더 많은 손실을 막는 전략
- 변동율에 기반한 동적 상쇄 손실을 증가시킵니다.
- 다양한 품종의 다른 주기 변수의 조합을 최적화 테스트
- 기계 학습 알고리즘 최적화 파라미터를 테스트합니다.
다양한 변수 조합을 테스트하여 더 강력한 변수를 찾을 수 있습니다. 동시에 손실을 막는 전략을 세우는 것은 위험을 효과적으로 줄이고 전략의 안정성을 향상시킬 수 있습니다.
요약하다
이 전략은 평평한 이동 평균과 스토카스틱 지표의 장점을 통합하여 트렌드를 순차적으로 추적하고 더 좋은 시점을 선택합니다. 그것은 작동하기 쉽고, 위험은 제어할 수 있으며, 실용적인 가치가 있습니다. 지속적인 테스트와 최적화를 통해 성능을 더욱 향상시킬 수 있습니다.
/*backtest
start: 2024-01-18 00:00:00
end: 2024-01-25 00:00:00
period: 1m
basePeriod: 1m
exchanges: [{"eid":"Futures_Binance","currency":"BTC_USDT"}]
*/

//@version=4
// author SoftKill

strategy(title="Price EMA with stock", shorttitle="EMA STOCH", overlay=true)
src = input(title="Source", type=input.source, defval=close)

src_0 = src[0]
src_1 = src[1]
src_2 = src[2]
src_3 = src[3]
src_4 = src[4]

len50 = input(50, minval=1, title="Length")
src50 = input(close, title="Source")
out50 = ema(src50, len50)
len100 = input(100)
src100 = input(close, title="Source")
out100 = ema(src100, len100)

len1 = input(1, minval=1, title="Length")
src1 = input(close, title="Source")
out1 = sma(src1, len1)

length = input(5, minval=1)
OverBought = input(80)
OverSold = input(20)
smoothK = 3
smoothD = 3

k = sma(stoch(close, high, low, length), smoothK)
d = sma(k, smoothD)
cu = crossover(k,OverSold)
co = crossunder(k,OverBought)

sma_down = crossunder(out1, out50)
sma_up = crossover(out1,out50)

//if (not na(k) and not na(d))
  //  if (co and k < OverSold)
    //    strategy.entry("StochLE", strategy.long, comment="StochLE")
    //if (cu and k > OverBought)
     //   strategy.entry("StochSE", strategy.short, comment="StochSE")

crossCandle_4 = crossover(src[4],out50)
crossCandleUnder_4= cross(src[4],out50)
crossCandle_3 = crossover(src[3],out50)
crossCandleUnder_3= crossunder(src[3],out50)
crossCandle_2 = crossover(src[2],out50)
crossCandleUnder_2= crossunder(src[2],out50)
crossCandle_1 = crossover(src[1],out50)
crossCandleUnder_1= crossunder(src[1],out50)
crossCandle_0 = crossover(src[0],out50)
crossCandleUnder_0= crossunder(src[0],out50)

conditionOver = (crossCandle_4 or crossCandle_3 or crossCandle_2 or crossCandle_1 or crossCandle_0)
conditionUnder =(crossCandleUnder_4 or crossCandleUnder_3 or crossCandleUnder_2 or crossCandleUnder_1 or crossCandleUnder_0)

touch4 = (cross(low[4],out50) or cross(high[4],out50))
touch3 = (cross(low[3],out50) or cross(high[3],out50))
touch2 = (cross(low[2],out50) or cross(high[2],out50))
touch1 = (cross(low[1],out50) or cross(high[1],out50))

touch = touch1 or touch2 or touch3 or touch4

//and sma_up
//and sma_down

// Getting inputs
fast_length = input(title="Fast Length", type=input.integer, defval=12)
slow_length = input(title="Slow Length", type=input.integer, defval=26)
src_macd = input(title="Source", type=input.source, defval=close)
signal_length = input(title="Signal Smoothing", type=input.integer, minval = 1, maxval = 50, defval = 9)
sma_source = input(title="Simple MA(Oscillator)", type=input.bool, defval=false)
sma_signal = input(title="Simple MA(Signal Line)", type=input.bool, defval=false)

// Plot colors
col_grow_above = #26A69A
col_grow_below = #FFCDD2
col_fall_above = #B2DFDB
col_fall_below = #EF5350
col_macd = #0094ff
col_signal = #ff6a00

// Calculating
fast_ma = sma_source ? sma(src_macd, fast_length) : ema(src_macd, fast_length)
slow_ma = sma_source ? sma(src_macd, slow_length) : ema(src_macd, slow_length)
macd = fast_ma - slow_ma
signal = sma_signal ? sma(macd, signal_length) : ema(macd, signal_length)
hist = macd - signal

//plot(hist, title="Histogram", style=plot.style_columns, color=(hist>=0 ? (hist[1] < hist ? col_grow_above : col_fall_above) : (hist[1] < hist ? col_grow_below : col_fall_below) ), transp=0 )
//plot(macd, title="MACD", color=col_macd, transp=0)
//plot(signal, title="Signal", color=col_signal, transp=0)


// plot((conditionOver or conditionUnder or touch)  and src[0] >= out50 and close >= out50 and  (cu) and out50 > out100 and hist>=0 , title="Buy", style=plot.style_columns, color=color.lime)
// plot((conditionOver or conditionUnder or touch)  and src[0] <= out50 and close <= out50 and  (co) and out50< out100 and hist<=0 , title="sell", style=plot.style_columns, color=color.red)


long_cond = ((conditionOver or conditionUnder or touch)  and src[0] >= out50 and close > out50 and  (cu) and out50 > out100 and hist>=0)
short_cond = ((conditionOver or conditionUnder or touch)  and src[0] <= out50 and close < out50 and  (co) and out50< out100 and hist<=0)

tp=input(0.1)
sl=input(0.1)

strategy.entry("long",strategy.long, when=long_cond)
strategy.entry("short",strategy.short, when=short_cond)

strategy.exit("X_long", "long", profit=close * tp / syminfo.mintick,  loss=close * sl / syminfo.mintick, when=touch  )
strategy.exit("x_short", "short",profit=close * tp / syminfo.mintick,loss=close * sl / syminfo.mintick,when = touch )

// //tp = input(0.0003, title="tp")
// tp = 0.0003
// //sl = input(1.0 , title="sl")
// sl = 1.0
// strategy.exit("closelong", "long" , profit = close * tp / syminfo.mintick, loss = close * sl / syminfo.mintick, alert_message = "closelong")
// strategy.exit("closeshort", "short" , profit = close * tp / syminfo.mintick, loss = close * sl / syminfo.mintick, alert_message = "closeshort")