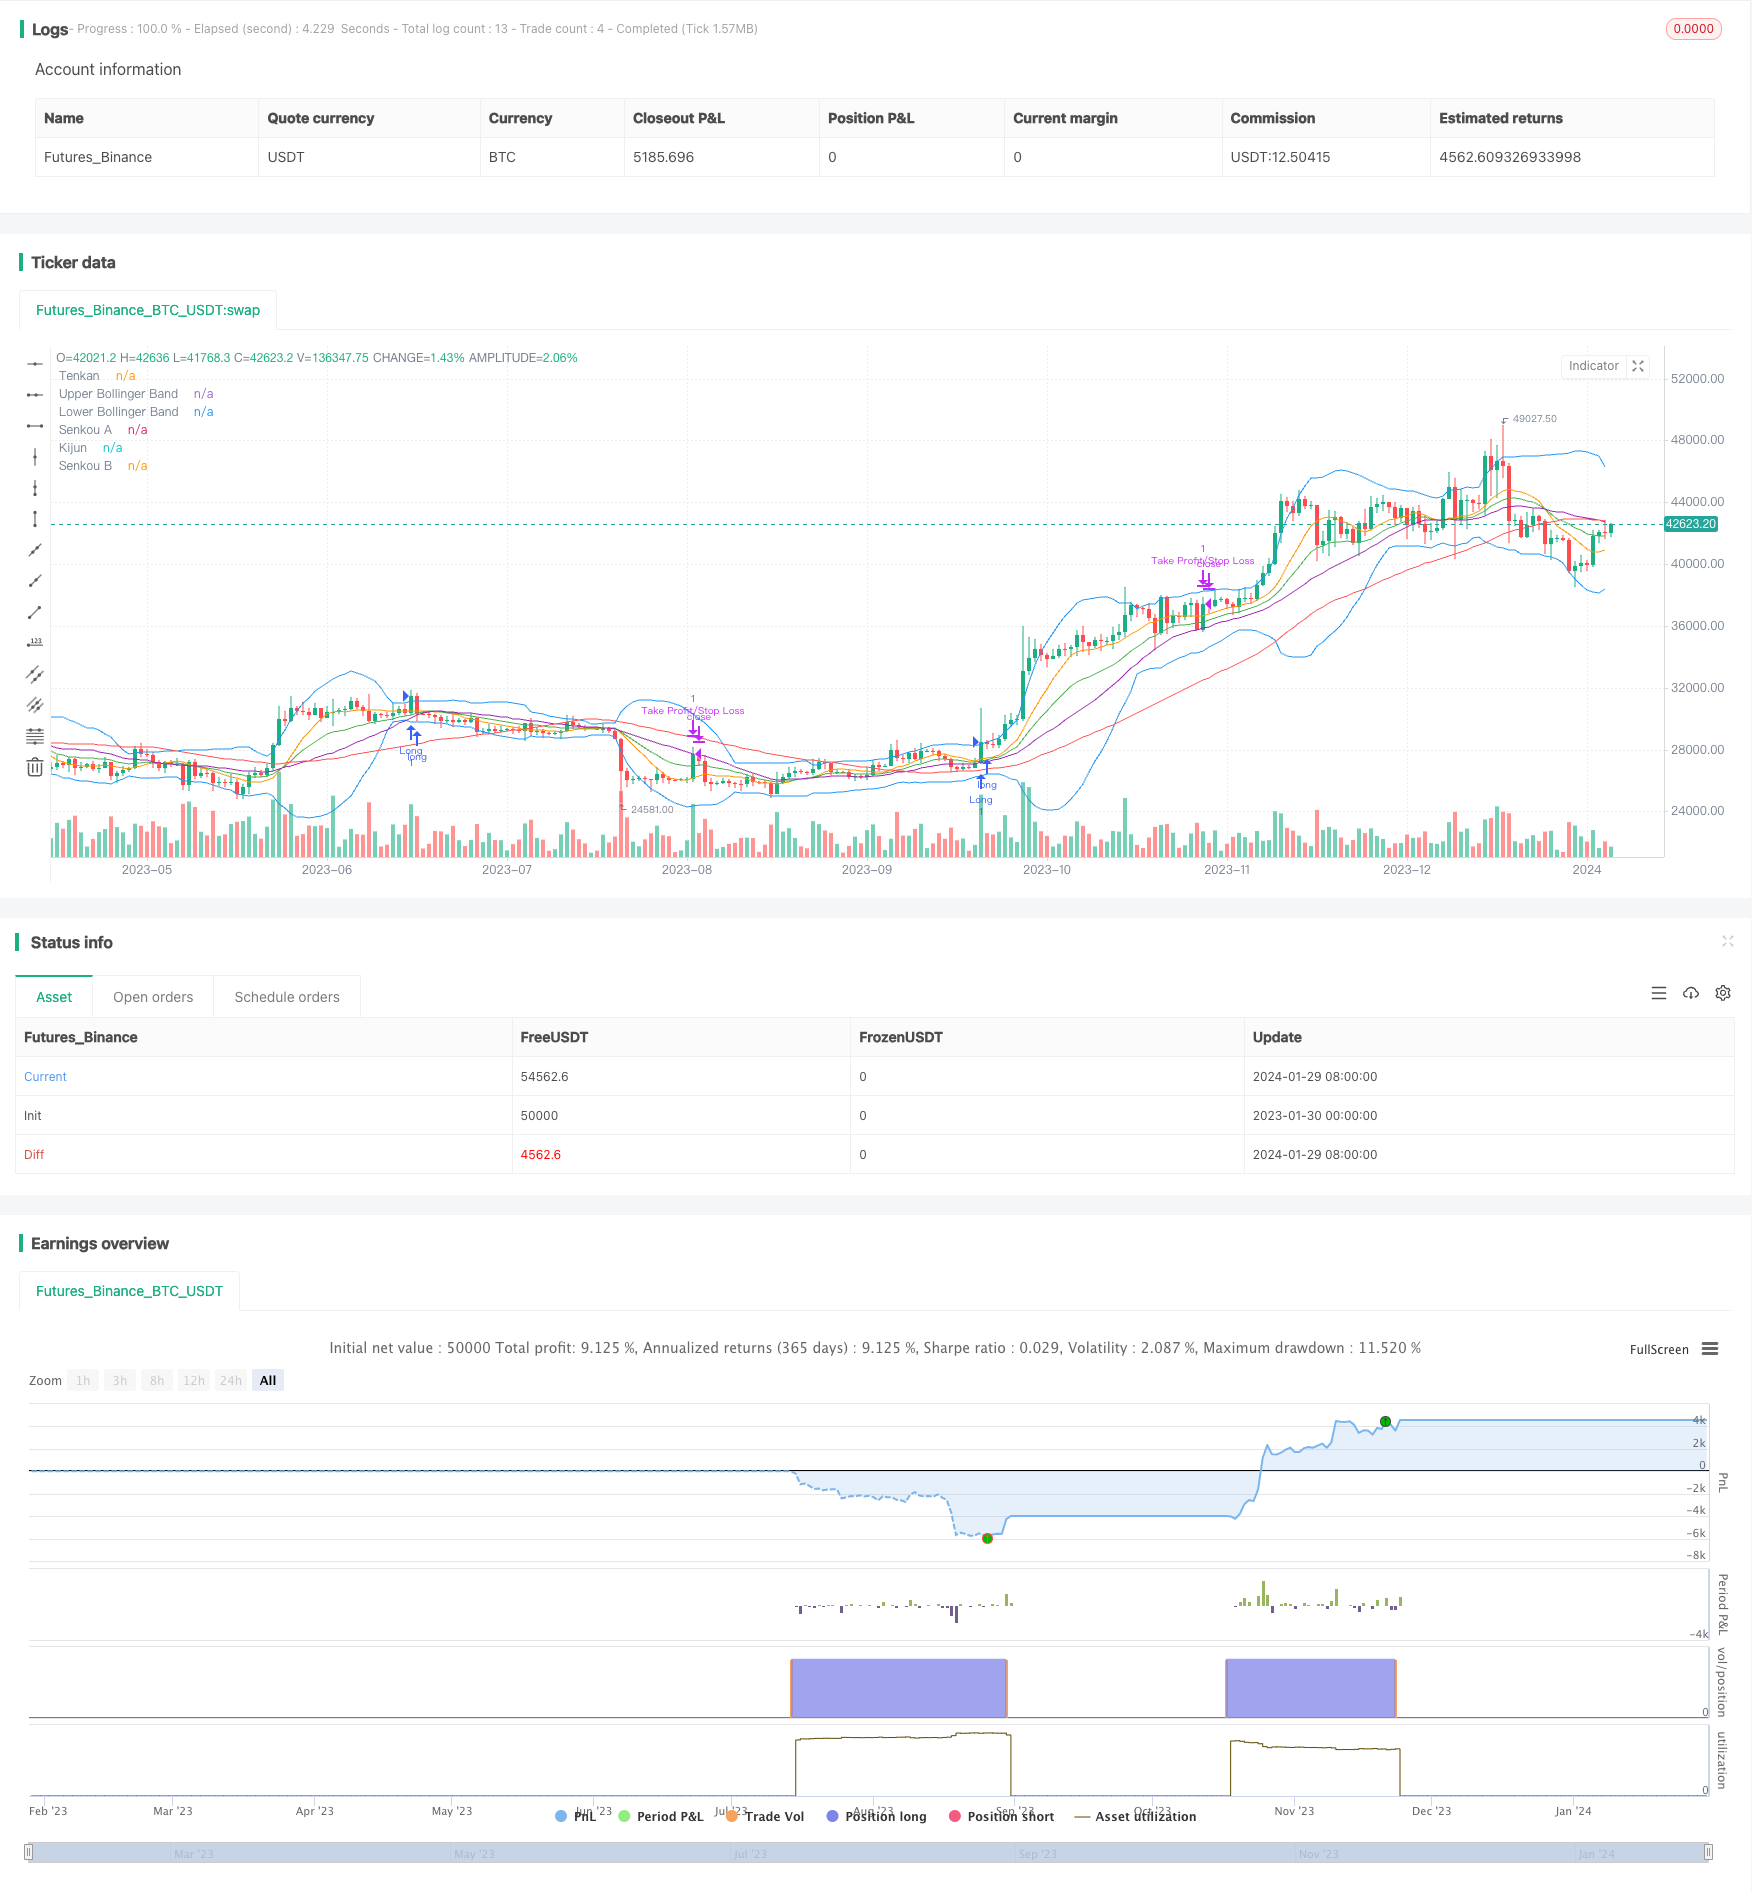
개요
이치모쿠 엔트리 (Ichimoku Entries) 는 이치모쿠 클라우드 그래프 지표를 사용하여 트렌드 방향을 식별하고, 브린 밴드, RSI 지표와 결합하여 거래 신호를 보내는 양적 전략이다. 이 전략은 주로 10 회전선과 기본선의 금포크 사다리 (金叉死叉) 를 기반으로 현재 다단 시장 또는 공백 시장에 있는지 판단하여 장점과 단점 입점의 진입 신호를 생성한다.
전략 원칙
이 전략은 주로 이치모쿠 구름 그래프의 두 가지 중요한 선인 십 회전선과 기저선을 이용한다. 십 회전은 최근 9일간의 최고 가격과 최저 가격의 평균값을 나타내고, 단기 경향을 나타낸다. 기저선은 최근 26일간의 최고 가격과 최저 가격의 평균값을 나타내고, 중기 장기 경향을 나타낸다. 단기선 십 회전선 위를 가로질러 중기선 장기선 기저선을 가로질러 입출을 나타낸다. 십 회전선 아래를 가로질러 입출을 나타낸다.
이치모쿠 클라우드 그래프 이외에도, 전략은 부린 반지 및 RSI 지표를 탐지하여 거래 신호를 발산합니다. 부린 반지를 상회하거나 상회할 때만 상쇄 가격이 불규칙하다는 것을 나타냅니다. 또한 RSI 지표와 결합하여 과매 과매 지역이 있는지 여부를 판단하여 일부 가짜 돌파구를 필터링하여 진입 신호를 생성합니다.
탈퇴 논리적으로, 전략은 브린 띠의 돌파가 성공했는지, 거래 분위기 지표 TPO의 0 축 통과가 발생했는지 여부를 판단하여 수익 또는 손실을 막는 탈퇴를 결정한다.
우위 분석
이 전략의 가장 큰 장점은 트렌드 판단과 비정상적인 변동을 동시에 사용하여 거래 방향을 결정한다는 것입니다. 이치모쿠 구름 그래프는 트렌드를 명확하게 판단하고, 브린 밴드는 비정상적인 변동을 포착합니다. RSI 지표는 가짜 브레이크를 효과적으로 필터링합니다. 여러 지표의 조합을 사용하면 거래 신호가 더 신뢰할 수 있습니다.
위험 분석
트렌드 및 비정상적인 변동을 식별하는 장점이 있음에도 불구하고,이 전략에는 약간의 위험이 있습니다. 트렌드를 추적하기 때문에 거래가 진행되므로, 충격적인 상황에서 더 많은 가짜 신호가 발생할 수 있습니다. 또한, 매개 변수 설정이 적절하지 않으면 전략의 성능에도 영향을 미칩니다.
최적화 방향
이 전략은 다음과 같은 부분에서 최적화될 수 있습니다.
- 다른 변수 조합을 테스트합니다. 예를 들어, 브린 주사위, RSI 주사위 등이죠.
- 기계 학습 알고리즘을 추가하고, 역사 데이터 훈련 모델에 따라 동적 출력 파라미터를 추가합니다.
- 정보의 흐름과 함께 시장의 정서를 판단하여 중요한 순간에 잘못된 결정을 피하십시오.
- 가격의 움직임에 따라 손실을 줄이고 수익을 유지하는 방법
요약하다
이치모쿠 엔트리 (Ichimoku Entries) 전략은 다중 지표 융합의 트렌드 추적 전략이다. 트렌드 방향과 가격의 비정상성을 동시에 판단하여 비교적 안정적으로 시장의 리듬을 파악한다. 개선의 여지가 있지만, 전체적으로 안정적이고 위험 제어 가능한 양적 거래 전략이다. 매개 변수 최적화 및 기계 학습의 도입은 전략의 효과를 더욱 탁월하게 만들 수 있다.
/*backtest
start: 2023-01-30 00:00:00
end: 2024-01-30 00:00:00
period: 1d
basePeriod: 1h
exchanges: [{"eid":"Futures_Binance","currency":"BTC_USDT"}]
*/

//@version=5
strategy("ichi strategy", overlay=true)

// Input parameters
rsiLength = input(14, title="RSI Length")
bbLength = input(20, title="Bollinger Bands Length")
bbMultiplier = input(2, title="Bollinger Bands Multiplier")
stopLossPct = input(1, title="Stop Loss Percentage")
takeProfitPct = input(2, title="Take Profit Percentage")

// Calculate Ichimoku Cloud components
tenkan = ta.sma(high + low, 9) / 2
kijun = ta.sma(high + low, 26) / 2
senkouA = (tenkan + kijun) / 2
senkouB = ta.sma(high + low, 52) / 2

// Bollinger Bands
basis = ta.sma(close, bbLength)
upperBB = basis + bbMultiplier * ta.stdev(close, bbLength)
lowerBB = basis - bbMultiplier * ta.stdev(close, bbLength)

// RSI
rsiValue = ta.rsi(close, rsiLength)

// Trade Proximity Oscillator
length = input(14, title="Channels Length")
multiplier = input(2, title="Channels Multiplier")
atr_length = input(14, title="ATR Length")
threshold_percentage = input(1.5, title="Threshold Percentage (%)")

ma = ta.sma(close, length)
std_dev = ta.stdev(close, length)
upper_band = ma + multiplier * std_dev
lower_band = ma - multiplier * std_dev
distance_upper = close - upper_band
distance_lower = lower_band - close
atr_value = ta.atr(atr_length)
threshold = atr_value * threshold_percentage
oscillator = distance_upper - distance_lower

// Strategy logic
longCondition = close > upperBB and tenkan > kijun and ta.crossover(close, basis) and rsiValue < 70
shortCondition = close < lowerBB and tenkan < kijun and ta.crossunder(close, basis) and rsiValue > 30

strategy.entry("Long", strategy.long, when = longCondition)
strategy.entry("Short", strategy.short, when = shortCondition)

// Exit logic
longExitCondition = close < upperBB and ta.crossover(oscillator, 0)
shortExitCondition = close > lowerBB and ta.crossunder(oscillator, 0)

strategy.exit("Take Profit/Stop Loss", from_entry="Long", loss=close - close * stopLossPct / 100, profit=close + close * takeProfitPct / 100, when = longExitCondition)
strategy.exit("Take Profit/Stop Loss", from_entry="Short", loss=close + close * stopLossPct / 100, profit=close - close * takeProfitPct / 100, when = shortExitCondition)

// Plotting
plot(senkouA, color=color.green, title="Senkou A")
plot(senkouB, color=color.red, title="Senkou B")
plot(upperBB, color=color.blue, title="Upper Bollinger Band")
plot(lowerBB, color=color.blue, title="Lower Bollinger Band")

// Additional Plots
plot(tenkan, color=color.orange, title="Tenkan")
plot(kijun, color=color.purple, title="Kijun")