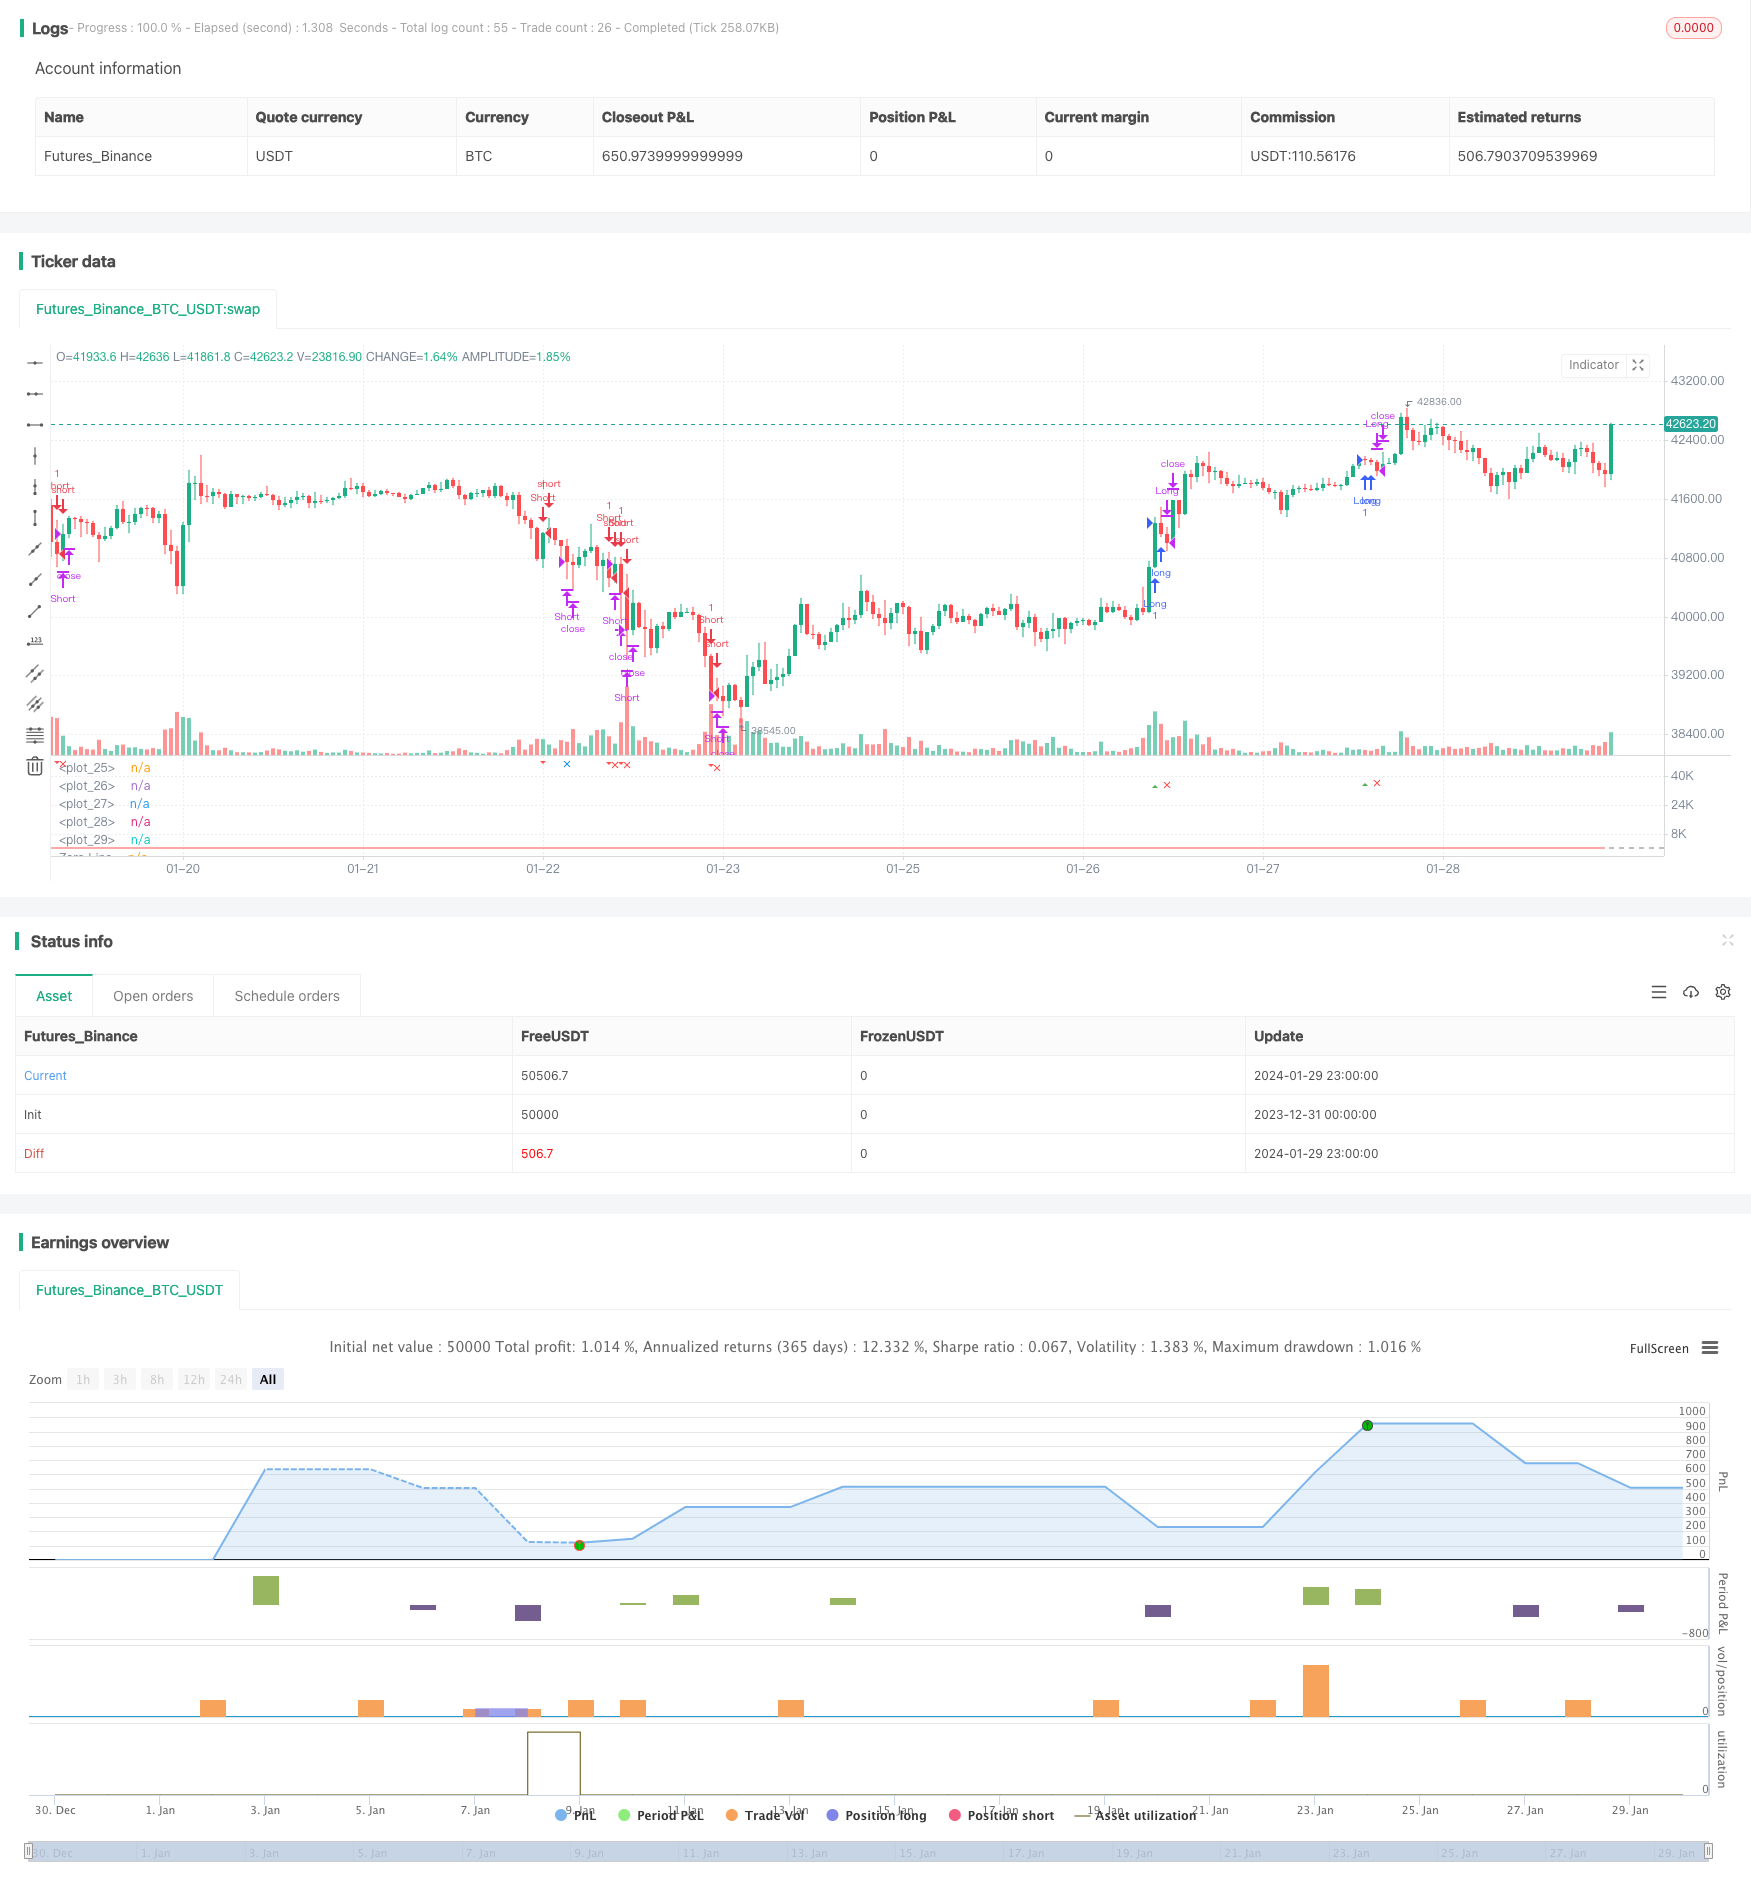
웨이브 추적 전략을 개선
저자:차오장, 날짜: 2024-01-31 15:35:41태그:

개요: 파동 지표를 적용하여 경향을 식별하는 추적 전략이다. 이는 평균 가격의 지수 이동 평균과 절대 가격 부진의 이동 평균을 계산하여 파동 라인을 얻는다. 전략은 파동 라인이 과잉 구매 과잉 판매 영역과 교차하는 것을 모니터링하여 거래 신호를 생성한다. 동시에 일평선 필터링과 거래량 필터를 결합하여 잘못된 신호를 방지한다.
전략적 원칙:
평균 가격 ap= (최고 가격 + 최저 가격 + 종료 가격) / 3를 계산합니다.
n1 주기의 ap의 EMA를 계산하면
ap와 esa의 절대적 열차값의 n1주기 EMA를 계산하면, d가 됩니다.
계산 파도선:ci=(ap-esa)/(0.015*d)
n2주기ci의 EMA를 계산하면, 최종 파도선 tci, 즉 wt1을 얻습니다.
4주기 SMA를 계산하면 wt2가 됩니다.
과잉 구매 구역과 과잉 판매 구역의 수평선을 그리는 obLevel1/2 및 osLevel1/2
wt1이 obLevel2선을 통과할 때 구매 신호를 생성; wt1이 osLevel2선을 통과할 때 판매 신호를 생성
오차 신호를 피하기 위해 평선emaFilter와 거래량VolumeFilter를 필터 조건으로 추가합니다.
진입 후 손익분기율을 설정하고 지분을 종료합니다.
장점 분석:
파동선은 더 나은 복합 공간 변환을 처리하여 트렌드를 효과적으로 포착합니다.
평선과 거래량 듀얼 필터링을 결합하여 높은 신뢰성
단일 지표의 제한을 피하기 위해 여러 개의 매개 변수 계산을 사용합니다.
손해배상 차단을 설정하여 수익의 일부를 차단하고 위험을 효과적으로 제어합니다.
위험과 결함:
매개 변수 선택은 경우에 따라서는 성능이 저하되거나 과도하게 적합할 수 있습니다.
최적의 변수 선택에 대한 명확한 지침이 없습니다.
더 넓은 시장 조건이 신호에 포함되지 않았습니다.
제한된 범위 또는 변동적인 시장에서 사용되면 화살표 효과의 위험이 있습니다.
수익/손실 이외의 탈퇴 규칙이 없습니다.
최적화 방향:
최적의 값을 찾기 위해 다양한 시간 프레임과 자산에서 파라미터 세트를 테스트합니다.
변동성 지표와 결합하여 낮은 변동성 시기에 신호를 피합니다.
신호 정확성을 높이기 위해 RSI와 같은 보조 지표를 추가합니다.
특정 자산에 대한 최적의 매개 변수를 찾기 위해 기계 학습 모델을 구축합니다.
추적 스톱 손실 또는 갑작스러운 변동성 확장 이벤트에 기반한 탈퇴를 추가하여 강화된 탈퇴
요약:
이것은 파동선과 보조 지표의 디자인을 결합한 전략이다. 파동선의 트렌드 전환을 효과적으로 인식하는 특징을 활용하고, 중간선과 거래량 필터링을 통해 잘못된 신호를 피하기 위해, 중장선 트렌드의 대부분을 확보할 수 있다. 또한, 위험 통제를 위해 스톱 스톱 손실을 사용한다. 또한 최적화 공간은 크다. 파라미터 조합을 조정하고, 더 많은 지표를 결합하고, 기계 학습 등의 방법을 통해 지속적으로 개선함으로써 전략이 더 많은 품종과 시간 사이클에 더 잘 수행될 수 있다.
/*backtest
start: 2023-12-31 00:00:00
end: 2024-01-30 00:00:00
period: 1h
basePeriod: 15m
exchanges: [{"eid":"Futures_Binance","currency":"BTC_USDT"}]
*/

//@version=5
strategy("Bush Strategy test", shorttitle="Nique Audi", overlay=false)

// Paramètres
n1 = input(10, title="Channel Length")
n2 = input(21, title="Average Length")
obLevel1 = input(60, title="Over Bought Level 1")
obLevel2 = input(53, title="Over Bought Level 2")
osLevel1 = input(-65, title="Over Sold Level 1")
osLevel2 = input(-60, title="Over Sold Level 2")
takeProfitPercentage = input(1, title="Take Profit (%)")
stopLossPercentage = input(0.50, title="Stop Loss (%)")

// Calculs
ap = hlc3
esa = ta.ema(ap, n1)
d = ta.ema(math.abs(ap - esa), n1)
ci = (ap - esa) / (0.015 * d)
tci = ta.ema(ci, n2)

wt1 = tci
wt2 = ta.sma(wt1, 4)

// Tracé des lignes
plot(0, color=color.gray)
plot(obLevel1, color=color.red)
plot(osLevel1, color=color.green)
plot(obLevel2, color=color.red, style=plot.style_line)
plot(osLevel2, color=color.green, style=plot.style_line)

plot(wt1, color=color.green)
plot(wt2, color=color.red, style=plot.style_line)

// Tracé de la différence entre wt1 et wt2 en bleu
hline(0, "Zero Line", color=color.gray)

// Conditions d'entrée long et court
longCondition = ta.crossover(wt1, obLevel2)
shortCondition = ta.crossunder(wt1, osLevel2)

// Tracé des signaux d'achat et de vente
plotshape(series=longCondition, style=shape.triangleup, location=location.belowbar, color=color.green, size=size.small, title="Buy Signal")
plotshape(series=shortCondition, style=shape.triangledown, location=location.abovebar, color=color.red, size=size.small, title="Sell Signal")

// Conditions d'entrée et de sortie
strategy.entry("Long", strategy.long, when=longCondition)
strategy.entry("Short", strategy.short, when=shortCondition)

// Niveaux de prise de profit pour les positions longues et courtes
longTakeProfitLevel = strategy.position_avg_price * (1 + takeProfitPercentage / 100)
shortTakeProfitLevel = strategy.position_avg_price * (1 - takeProfitPercentage / 100)

// Vérification si les niveaux de prise de profit sont atteints
longTakeProfitReached = strategy.position_size > 0 and high >= longTakeProfitLevel
shortTakeProfitReached = strategy.position_size < 0 and low <= shortTakeProfitLevel

// Tracé des formes de prise de profit
plotshape(series=longTakeProfitReached, style=shape.xcross, location=location.belowbar, color=color.blue, size=size.small, title="Take Profit Long")
plotshape(series=shortTakeProfitReached, style=shape.xcross, location=location.abovebar, color=color.blue, size=size.small, title="Take Profit Short")

// Niveaux de stop loss pour les positions longues et courtes
longStopLossLevel = strategy.position_avg_price * (1 - stopLossPercentage / 100)
shortStopLossLevel = strategy.position_avg_price * (1 + stopLossPercentage / 100)

// Vérification si les niveaux de stop loss sont atteints
longStopLossReached = strategy.position_size > 0 and low <= longStopLossLevel
shortStopLossReached = strategy.position_size < 0 and high >= shortStopLossLevel

// Tracé des formes de stop loss
plotshape(series=longStopLossReached, style=shape.xcross, location=location.belowbar, color=color.red, size=size.small, title="Stop Loss Long")
plotshape(series=shortStopLossReached, style=shape.xcross, location=location.abovebar, color=color.red, size=size.small, title="Stop Loss Short")

// Fermeture des positions en cas de prise de profit ou de stop loss
strategy.close("Long", when=longTakeProfitReached or longStopLossReached)
strategy.close("Short", when=shortTakeProfitReached or shortStopLossReached)
- 캄프턴 15분
전략 돌파 - 이중 ATR 후속 손실 전략
- 추적 전략을 돌파합니다.
- 극단적인 노로 추세는 일직선 전략입니다.
- 회귀 유동량 거래 전략
- 도니
트렌드 추적 전략 - 슈퍼트렌드 RSI와 EMA의 교차 전략
- 양방위 3점 이동 동선 양산 거래 전략
- RSI와 MACD를 기반으로 하는 거래 전략
- CCI와 EMA를 기반으로 한 단선 충격 전략
- 이치모쿠 엔트리 전략
- 동선 교차에 기반한 트렌드를 따라 전략
- RSI 트렌드 추적 중지 손실 전략
- 브린 띠를 깨는 통합 전략
- 동적 꼬리 손실 전략
- 다중 시간 프레임 금 회전 추적 전략
- 양적 W 모양의 기량화
- 슈퍼 트렌드 기둥이 융합 전략으로 전환
- 전날의 종료 가격과 ATR 지표에 기반한 트렌드 추적 전략
- 양평선 파괴와 압력 절단 사이의 교차 전략