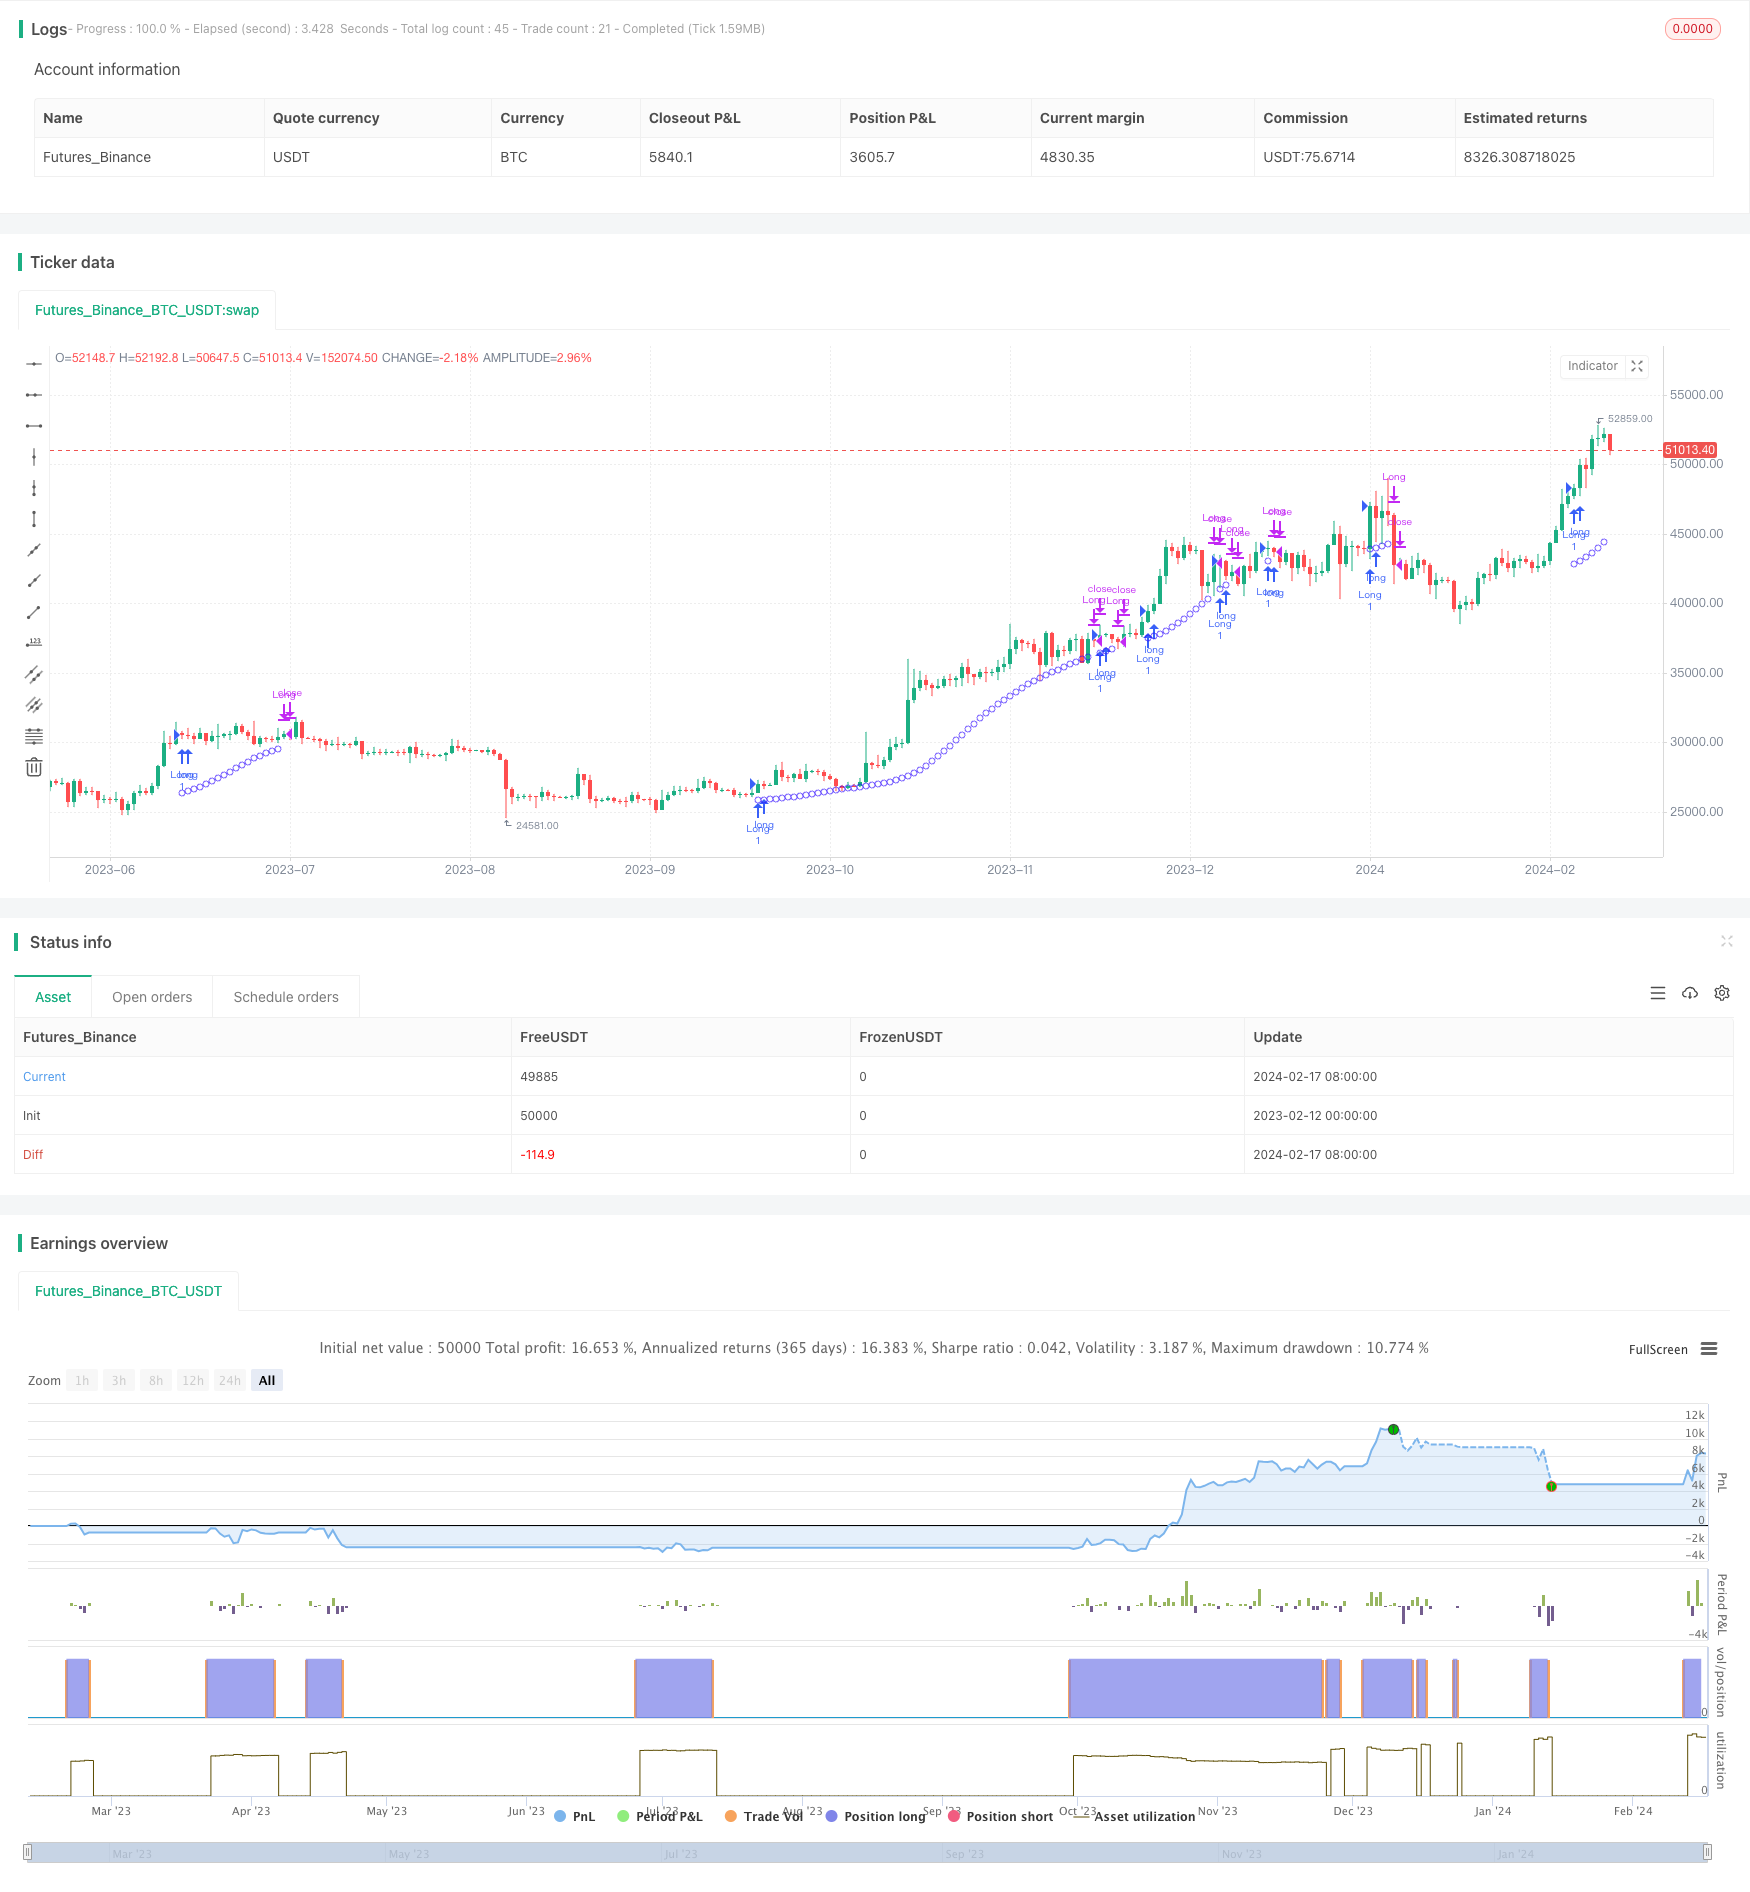
개요
메이저 트렌드 인디케이터 롱 (영어: Major Trend Indicator Long, 약칭: MTIL) 은 암호화폐인 비트코인, 이더리움, 그리고 애플과 같은 전통적인 주식 등 다양한 금융상품에 사용되는 거래 전략이다. 이는 잠재적인 멀티 헤드 트렌드를 식별하여 장시간 입장을 구축하기 위해 고안되었다.
전략 원칙
MTIL 전략은 최적화된 파라미터를 사용하여 특정 회전 주기의 최고 가격과 최저 가격을 계산한다. 그리고는 선형 회귀 방법을 적용하여 가격 데이터를 부드럽게 처리하고 잠재적인 황소 시장 추세를 식별하여 여러 신호를 발산한다.
구체적으로, 이 전략은 먼저 특정 주기 내의 최고 가격과 최저 가격을 계산한다. 그리고는 다른 파라미터의 선형 회귀를 사용하여 최고 가격과 최저 가격에 대해 평평하게 한다. 이것은 상승과 하락을 초래한다. 평평한 후의 최고 가격 라인이 상승을 돌파하고 최저 가격 라인이 하락을 돌파하며, 상쇄 가격의 단기 선형 회귀가 장기 선형 회귀보다 높을 때, 다중 신호가 발생한다.
우위 분석
MTIL 전략은 다음과 같은 장점이 있습니다.
- 이중 평준화 기술을 사용하여 트렌드를 식별하고, 정확도가 높습니다.
- 재검토 시작 시간은 조정할 수 있으며, 전략의 역사적 성능을 테스트할 수 있습니다.
- 사용자 정의 가능한 매개 변수, 자신의 거래 취향에 맞게 조정
- 무선 전략과 결합하여 다중 시간축 분석을 수행할 수 있습니다.
위험 분석
MTIL 전략에는 다음과 같은 위험도 있습니다.
- 트렌드 거래는 위험하고 손실이 커질 가능성이 있다.
- 잘못 설정된 매개 변수는 놓친 기회 또는 잘못된 신호를 유발할 수 있습니다.
- 거래비용을 적절히 고려하여 너무 자주 거래하지 마십시오.
변수를 조정하고, 스톱로스를 설정하고, 거래비용을 제어하는 등의 방법으로 위험을 피할 수 있다.
최적화 방향
MTIL 전략은 다음과 같은 측면에서 최적화될 수 있습니다.
- 다양한 주기 변수의 조합을 테스트하여 최적의 변수를 찾습니다.
- 수량 확인 메커니즘을 추가하여 잘못된 신호를 방지합니다.
- 다른 지표들과 함께 판단력, 시간적 움직임과 함께 신호를 추가로 확인합니다.
- 단편적 손실과 종합적 이익을 통제하기 위한 중단 및 중단 전략을 수립하십시오.
요약하다
MTIL은 선형 회귀 기술을 활용하여 큰 트렌드를 식별하는 다중 전략이다. 그것은 변수를 조정하여 다른 시장 환경에 적용할 수 있다. 공중 전략과 함께 사용하면 더 포괄적인 분석을 제공할 수 있다. 최적화 된 조정 후 정확도와 수익성이 향상 될 수 있다.
/*backtest
start: 2023-02-12 00:00:00
end: 2024-02-18 00:00:00
period: 1d
basePeriod: 1h
exchanges: [{"eid":"Futures_Binance","currency":"BTC_USDT"}]
*/

// This source code is subject to the terms of the Mozilla Public License 2.0 at https://mozilla.org/MPL/2.0/
// © jensenvilhelm


//@version=5
strategy("Major Trend Indicator Long", shorttitle='MTIL', overlay = true)

startDate = timestamp("2001 06 18")
// Sets the start date for the strategy.

// Optimized parameters
length_high = 5
length_low = 5
linReg_st = 3
linReg_st1 = 23
linReg_lt = 75
// Defines key parameters for the strategy.

X_i = ta.highest(high, length_high)
Y_i = ta.lowest(low, length_low)
// Calculates the highest and lowest price values within the defined lookback periods.

x_y = ta.linreg(X_i + high, linReg_st1, 1)
y_x = ta.linreg(Y_i + low, linReg_lt, 1)
// Applies linear regression to smoothed high and low prices.

upper = ta.linreg(x_y, linReg_st1, 6)
lower = ta.linreg(y_x, linReg_st1, 6)
// Determines upper and lower bounds using linear regression.

upperInside = upper < y_x and upper > x_y
lowerInside = lower > y_x and lower < x_y
y_pos = (upper + lower) / 4

X_i1 = ta.highest(high, length_high)
Y_i1 = ta.lowest(low, length_low)

bull = x_y > upper and y_x > lower and ta.linreg(close, linReg_st, 1) > ta.linreg(close, linReg_lt, 5)
// Defines a bullish condition based on linear regression values and price bounds.

plotshape(series=(bull) ? y_pos : na, style=shape.circle, location=location.absolute, color=color.rgb(41, 3, 255, 40), size=size.tiny)

if (time >= startDate)
    if (bull)
        strategy.entry("Long", strategy.long)
    if not (bull)
        strategy.close("Long")
// Controls the strategy's execution based on the bullish condition and the start date.