평균 라인 돌파 전략
저자:차오장, 날짜: 2024-02-23 14:46:37태그:

전반적인 설명
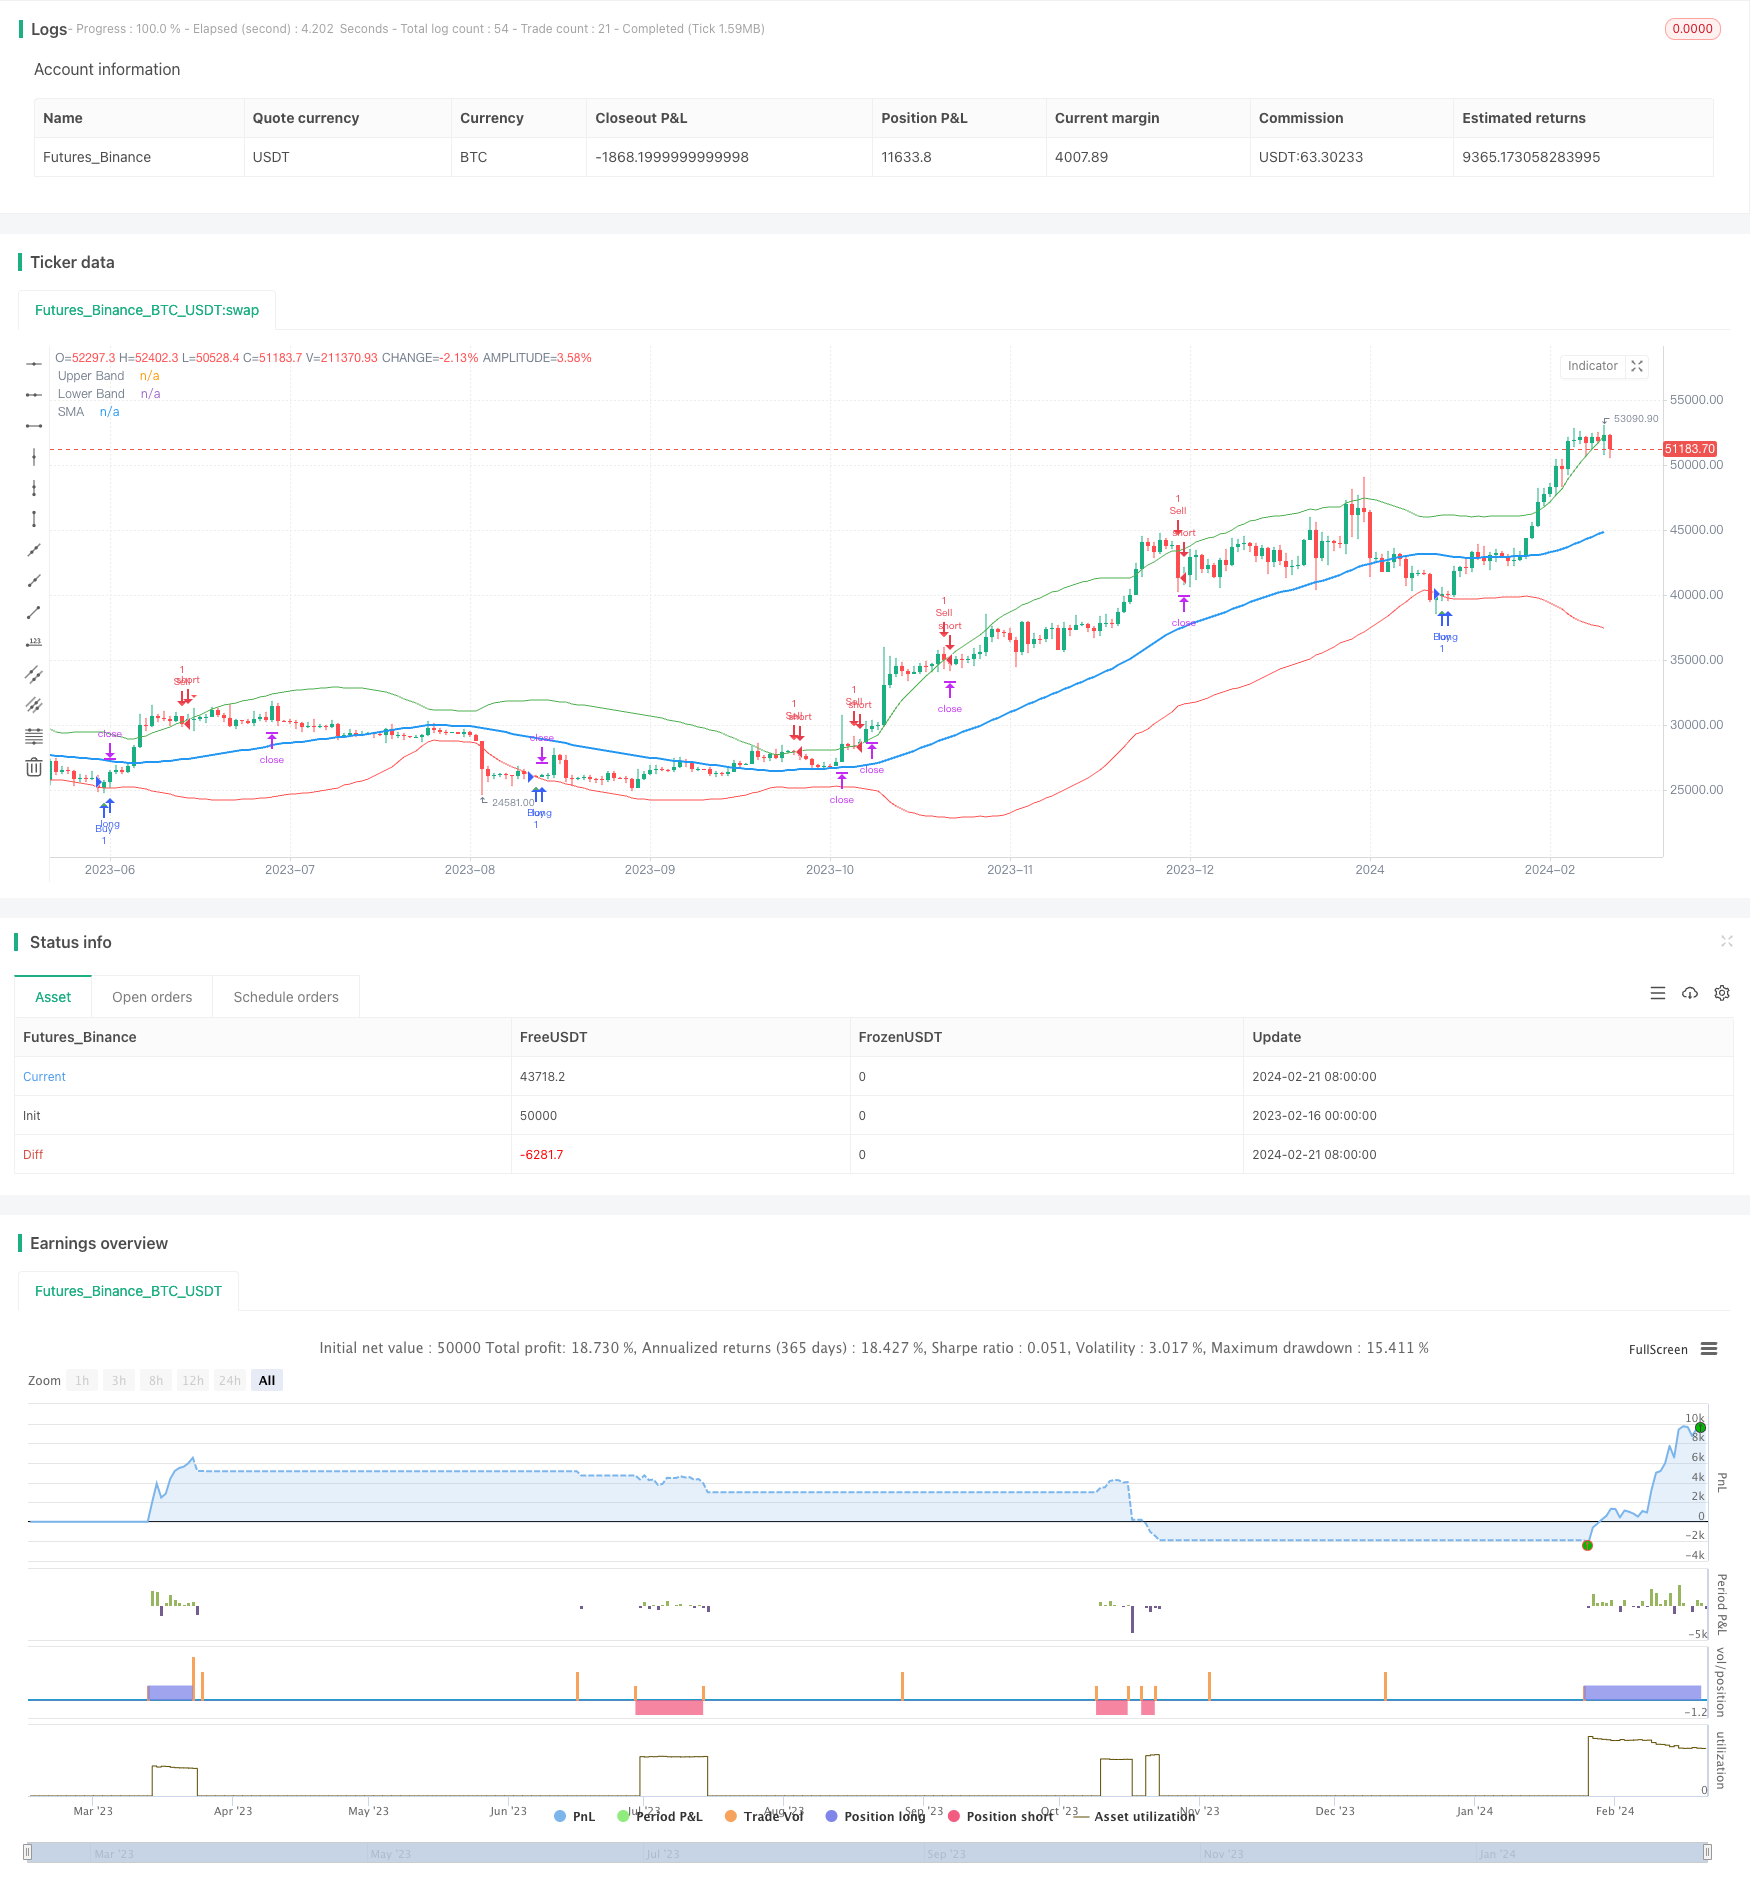
평균 라인 돌파 전략은 트렌드를 추적하는 전형적인 양적 거래 전략이다. 이 전략은 이동 평균과 표준 편차 대역을 사용하여 시장 트렌드를 판단하고 가격이 표준 편차 대역을 돌파 할 때 거래 신호를 생성합니다.
전략 원칙
이 전략은 먼저 N일 (50일 기본) 간단한 이동 평균 SMA를 계산하고, 그 다음이 주기의 SMA를 기반으로 가격의 표준편차 StdDev을 계산합니다. SMA를 중심축으로하고 상부 및 하부 레일을 StdDev의 2배로 사용하면
시장에 진입 한 후 전략은 스톱 로스를 설정하고 이윤을 취합니다. 구체적으로, 긴 후에 스톱 로스 라인은 진입 시점의 폐쇄 가격입니다 (100 - 스톱 로스 비율); 짧은 후에, 이윤을 취하는 라인은 진입 시점의 폐쇄 가격입니다 (100 + 이윤을 취하는 비율).
이점 분석
이 전략은 다음과 같은 장점을 가지고 있습니다.
-
강력한 트렌드 추적 기능 표준 오차 채널을 사용하여 시장 변동을 동적으로 추적 할 수 있습니다.
-
강력한 드라운다운 제어 능력. 이동 스톱 손실을 사용하여 단일 손실을 효과적으로 제어 할 수 있습니다.
-
간단한 구현. 매개 변수 최적화를 많이 절약하고 구현하기가 매우 쉽습니다.
위험 분석
이 전략은 또한 몇 가지 위험을 안고 있습니다.
-
트렌드 역전 위험. 트렌드 추적 전략은 손실이 발생하고 뒤이어 역전 가능성이 있습니다.
-
매개 변수 감수성 위험: 이동 평균 기간 및 표준편차 곱셈과 같은 매개 변수 선택은 전략 성과에 더 큰 영향을 줄 것입니다.
-
스톱 손실은 추가 손실을 일으킬 수 없을 정도로 공격적입니다. 잘못된 스톱 손실 포인트 설정은 추가 손실을 일으킬 수 있습니다.
이에 따른 위험에 대한 해결책은 다음과 같습니다.
-
불변성 지표를 결합하여 거짓 파장을 피합니다.
-
최적의 매개 변수를 찾기 위해 매개 변수를 최적화합니다.
-
과도한 공격성을 방지하기 위해 스톱 손실 메커니즘을 조정합니다.
최적화 방향
전략의 더 많은 최적화를 위한 여지가 있습니다.
-
너무 민감한 곡선을 피하기 위해 확인을 위해 여러 시간 프레임 이동 평균을 사용하십시오.
-
추세와 분리를 판단하기 위해 MACD와 같은 다른 지표를 포함합니다.
-
매개 변수를 동적으로 최적화하는 기계 학습 알고리즘을 도입합니다.
요약
전체적으로, 이동 평균 회귀 돌파구 전략은 매우 실용적인 양적 거래 전략입니다. 트렌드를 추적하고 마이너 다운을 제어하는 장점, 간단한 구현, 양적 거래의 요구를 충족합니다. 동시에 매개 변수 선택 및 스톱 로스 설정과 같은 문제에도주의를 기울여야합니다. 멀티 타임 축 분석 및 매개 변수 최적화로 더 나은 전략 성능을 얻을 수 있습니다.
/*backtest
start: 2023-02-16 00:00:00
end: 2024-02-22 00:00:00
period: 1d
basePeriod: 1h
exchanges: [{"eid":"Futures_Binance","currency":"BTC_USDT"}]
*/

//@version=5
strategy("Standard Deviation Bands with Buy/Sell Signals", overlay=true)

// Input for the number of standard deviations
deviationMultiplier = input.float(2.0, title="Standard Deviation Multiplier")

// Input for the length of the moving average
maLength = input.int(50, title="Moving Average Length")

// Input for the stop loss percentage
stopLossPercentage = input.float(12, title="Stop Loss Percentage")

// Calculate the moving average
sma = ta.sma(close, maLength)

// Calculate the standard deviation of the price
priceDeviation = ta.stdev(close, maLength)

// Calculate the upper and lower bands
upperBand = sma + (priceDeviation * deviationMultiplier)
lowerBand = sma - (priceDeviation * deviationMultiplier)

// Plot the bands
plot(upperBand, color=color.green, title="Upper Band")
plot(lowerBand, color=color.red, title="Lower Band")

// Plot the moving average
plot(sma, color=color.blue, title="SMA", linewidth=2)

// Buy Signal
buyCondition = ta.crossover(close, lowerBand)
sellCondition = ta.crossunder(close, upperBand)

// Calculate stop loss level
stopLossLevelBuy = close * (1 - stopLossPercentage / 100)
stopLossLevelSell = close * (1 + stopLossPercentage / 100)

// Create Buy and Sell Alerts
alertcondition(buyCondition, title="Buy Signal", message="Buy Signal - Price Crossed Below Lower Band")
alertcondition(sellCondition, title="Sell Signal", message="Sell Signal - Price Crossed Above Upper Band")

// Plot Buy and Sell Arrows on the chart
plotshape(buyCondition, style=shape.triangleup, location=location.belowbar, color=color.green, title="Buy Signal Arrow")
plotshape(sellCondition, style=shape.triangledown, location=location.abovebar, color=color.red, title="Sell Signal Arrow")

// Exit Long and Short Positions
var float stopLossBuy = na
var float stopLossSell = na

if ta.crossover(close, sma)
    stopLossBuy := stopLossLevelBuy
if ta.crossunder(close, sma)
    stopLossSell := stopLossLevelSell

strategy.entry("Buy", strategy.long, when = buyCondition)
strategy.exit("Stop Loss/Take Profit Buy", from_entry = "Buy", stop = stopLossBuy)
strategy.entry("Sell", strategy.short, when = sellCondition)
strategy.exit("Stop Loss/Take Profit Sell", from_entry = "Sell", stop = stopLossSell)
- 200 일 이동 평균과 함께 엘리엇 웨브 전략
- 슈퍼트렌드 및 CCI 스칼핑 전략
- 슈퍼트렌드 및 CCI 스칼핑 전략
- 3가지 중복된 슈퍼트렌드 전략
- 이동평균 크로스오버에 기초한 전략을 따르는 경향
- 거리가 있는 거래 전략
- 월 플래그 MACD 모멘텀 스톡RSI 거래 전략
- 가격 액션에 기반한 기관 거래자 전략
- 레인보우 오시레이터 거래 전략
- 이동평균 조합에 기초한 전략을 따르는 경향
- 다항식 후속 정지 전략
- SPY RSI 스토카스틱 크로스오버 트렌드 역전 전략
- ATR 및 EMA 기반 트렌드 다음 전략에 대한 모든
- 볼링거 밴드 및 MACD를 기반으로 한 양적 거래 전략
- 동력 탈출 전략
- 마루보즈 촛불 범위 균형 전략
- 4차례 교차 전략
- 반전 볼린거 대역 RSI MACD 양성 전략
- RSI 이동 평균 이중 교차 오스실레이션 전략
- 크로싱 이동 평균 RR 전략