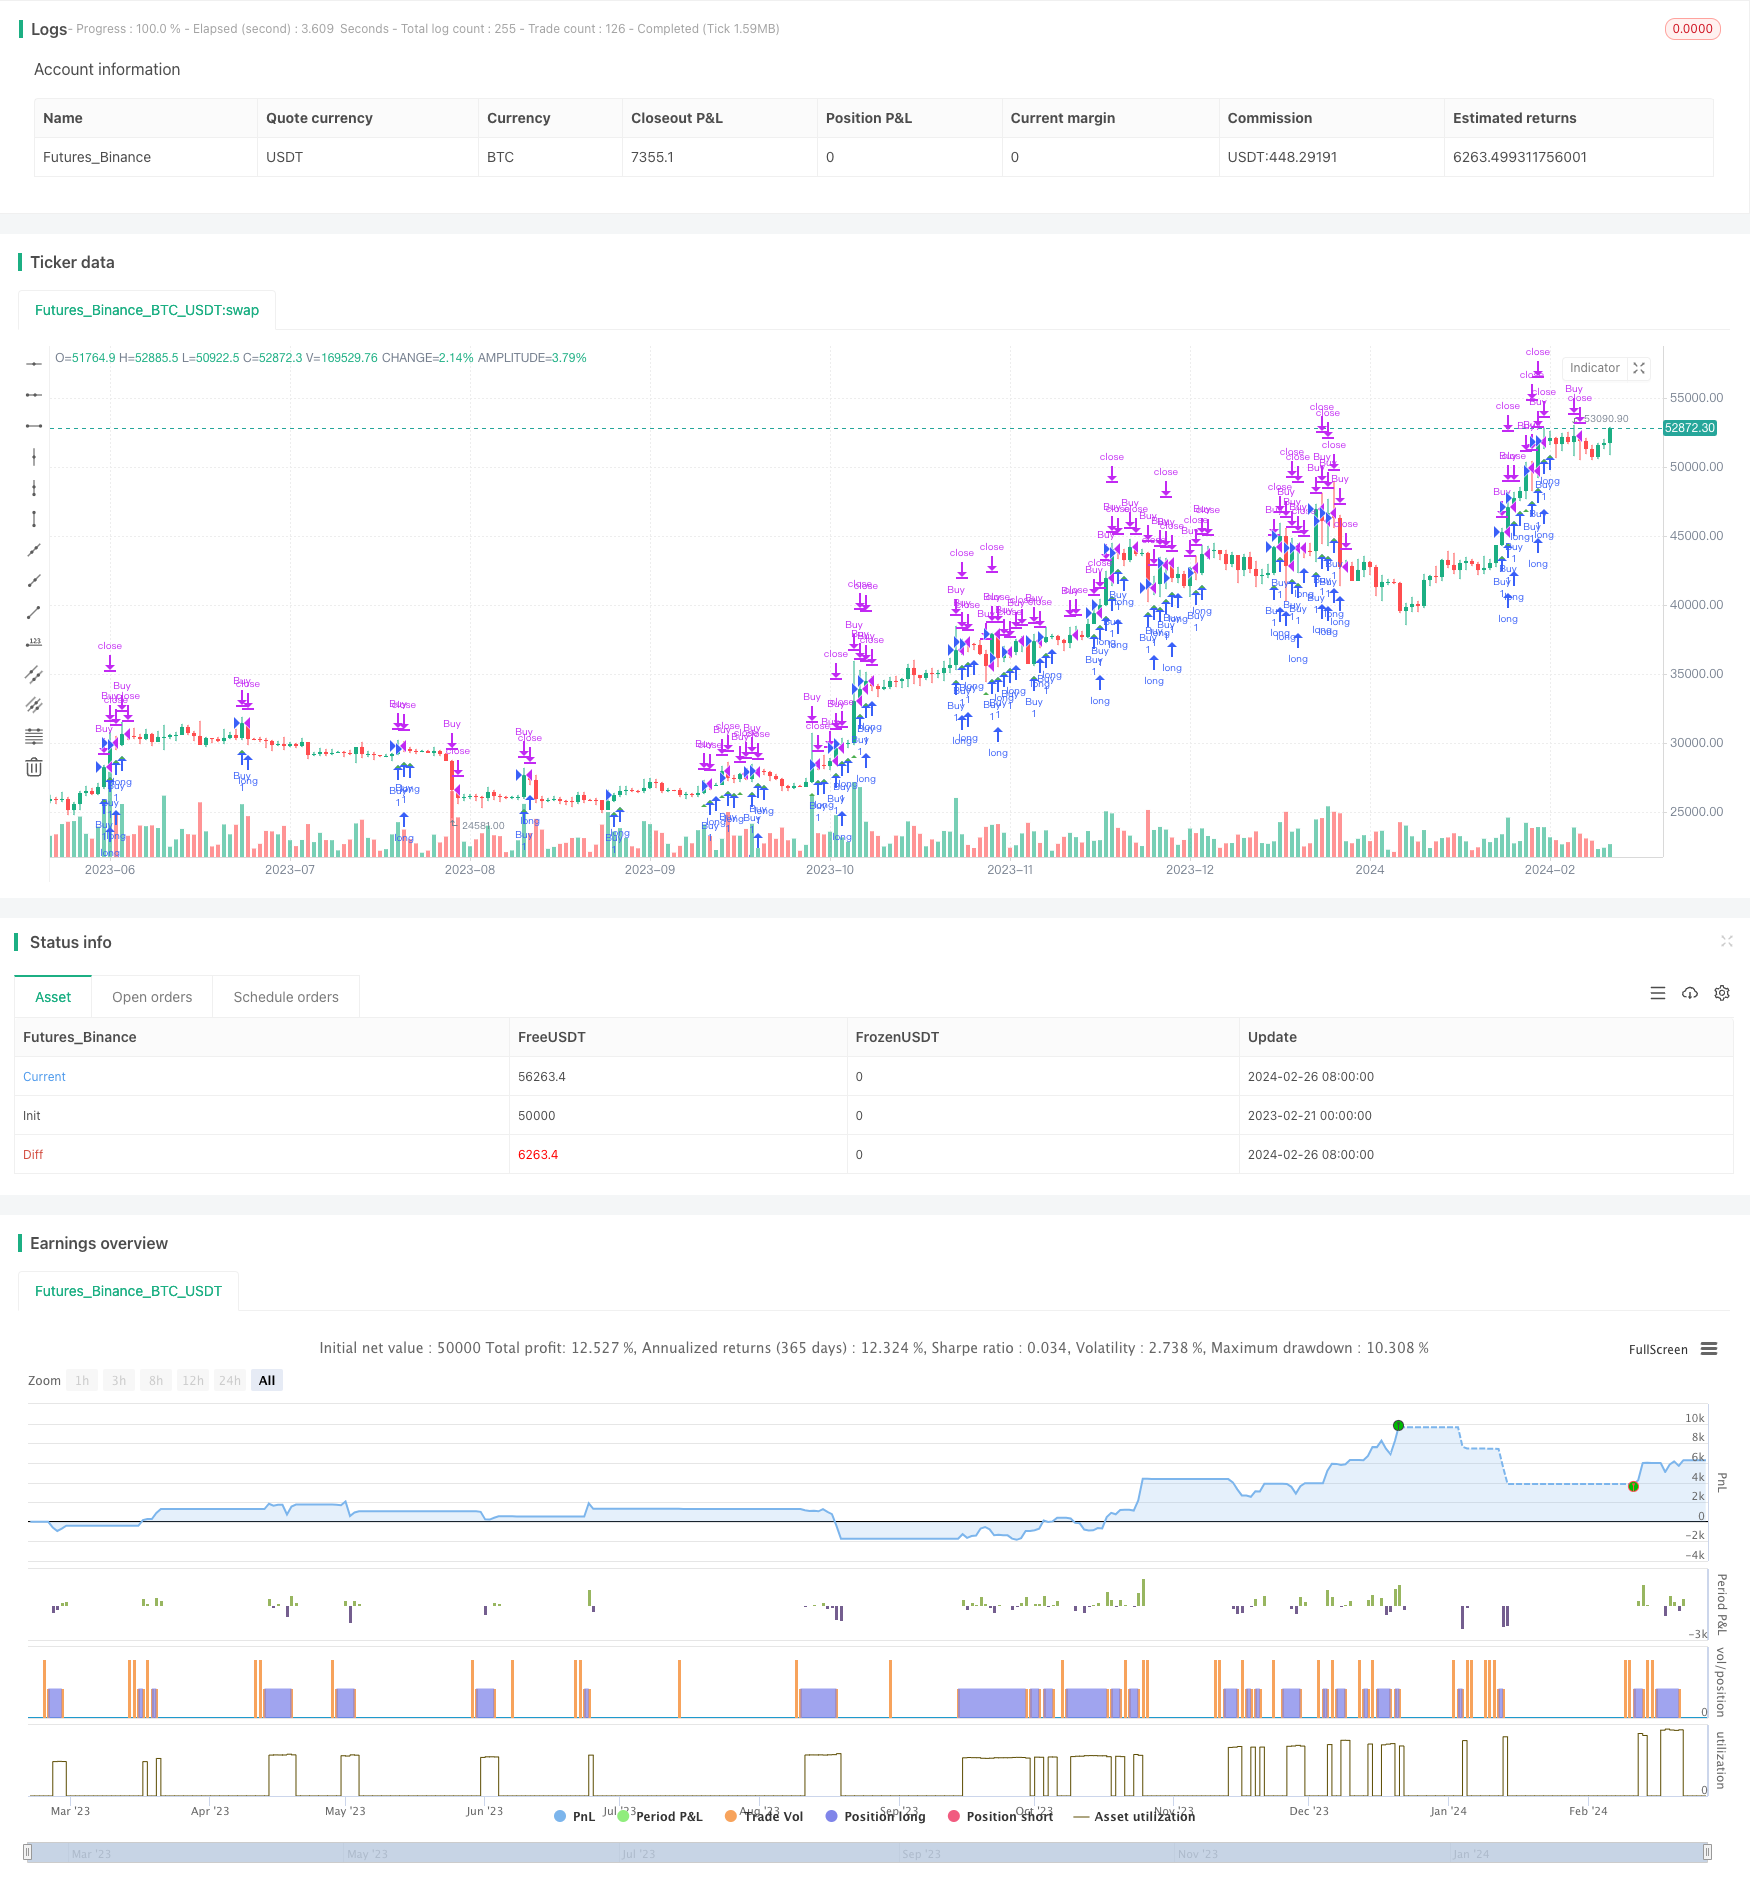
격차 해소 전략
저자:차오장, 날짜: 2024-02-28 17:12:52태그:

이 전략은 시장 트렌드 방향을 판단하여 이동 평균과 가격 차이를 계산하여 쇼크 중 빈번한 오픈을 피하여 긴 입장을 결정합니다.
전략 개요
- 전체 시장 동향을 결정하기 위해 20기 간편 이동 평균을 사용
- 최근 가격 변동에 대해 판단하기 위해 3주기 높은 가격과 낮은 가격의 차이를 사용
- 가격이 MA보다 높고 차이는 20주기 평균보다 크면 장거리
- 진입 가격의 98% 이하로 떨어지면 출입
전략 원칙
이 전략은 MA와 가격 변동을 결합하여 트렌드 중에 상승 기회를 포착합니다.
가격이 MA를 넘으면 상승 추세를 나타냅니다. 최근 3 기간 HL 차이가 20 기간 평균보다 크다면 증가하는 변동과 진입의 큰 상승 가능성을 나타냅니다.
오픈 후, 고정된 비율의 스톱 로스 가격을 설정합니다. 가격이 아래로 떨어지면 하락 위험을 제어합니다.
장점
- 추세와 변동성을 판단하여 충격 중에 자주 개척하는 것을 피하십시오.
- 가격차를 이용한 더 강한 파업 신호
- 스톱 로스는 위험을 조절하는 데 도움이 됩니다.
위험성
- 부적절한 매개 변수 조정으로 인해 거래가 빠집니다.
- 너무 넓은 스톱 손실은 큰 손실을 가져옵니다.
- 탈출은 거짓일 수 있어 더 많은 요인이 필요해
위험 해결 방법:
- 가장 좋은 조합을 위해 매개 변수를 최적화
- 시장 변동에 따라 여러 정지 또는 적응 정지 사용
- 신호 신뢰성을 확인하기 위해 볼륨과 같은 지표를 추가
개선 방향
- 더 나은 진입을 위해 BB와 같은 변동성 지표를 추가하십시오.
- 입력 신호를 확인하기 위해 볼륨을 분석
- 나쁜 거래를 피하기 위해 주식 지수를 사용하여 전체 시장을 판단
- 더 많은 수익을 확보하기 위해 이동/추적 중지 사용
결론
이 전략 은 단순 하지만 유익 한 지표 로 트렌딩 시장 에 진입 하기 전 에 충격 과 변동성 을 효과적으로 필터링 하여 불필요한 거래 를 피한다. 또한, 위험 은 손실 을 제한 하기 위해 잘 통제 된다. 추가적 인 최적화 는 더 나은 결과 로 이어질 수 있다.
/*backtest
start: 2023-02-21 00:00:00
end: 2024-02-27 00:00:00
period: 1d
basePeriod: 1h
exchanges: [{"eid":"Futures_Binance","currency":"BTC_USDT"}]
*/

//@version=5
strategy("Estrategia de Diferencia HL y MA para Criptomonedas", shorttitle="HL MA Crypto Strategy-Ortiz", overlay=true)

// Definir longitud de MA y HL
ma_length = input(20, title="Longitud MA")
hl_length = input(3, title="Longitud HL")
exit_below_price = input(0.98, title="Salir por debajo de precio")

// Calcular MA
ma = ta.sma(close, ma_length)

// Calcular HL
hh = ta.highest(high, hl_length)
ll = ta.lowest(low, hl_length)
hl = hh - ll

// Condiciones de tendencia alcista
bullish_trend = close > ma

// Condiciones de entrada y salida
long_condition = close > ma and close > ma[1] and hl > ta.sma(hl, ma_length)
short_condition = false // No operar en tendencia bajista
exit_condition = low < close * exit_below_price

// Entrada y salida de la estrategia
if (long_condition)
    strategy.entry("Buy", strategy.long)
if (short_condition)
    strategy.entry("Sell", strategy.short)
if (exit_condition)
    strategy.close("Buy")

// Plot de señales en el gráfico
plotshape(long_condition, style=shape.triangleup, location=location.belowbar, color=color.green, size=size.small, title="Buy Signal")
plotshape(short_condition, style=shape.triangledown, location=location.abovebar, color=color.red, size=size.small, title="Sell Signal")
더 많은
- Bitlinc MARSI 거래 전략
- 볼링거 대역 추적 전략
- 슈퍼트렌드 브레이크업 전략
- 이중 EMA 전략 분석
- 돌파구 콜백 거래 전략
- 이동 평균 크로스오버 트렌드 전략
- 가격 채널 로봇 화이트 박스 전략
- 간단한 이동 평균 트렌드 가격 수치 전략
- 시간 기반 ATR Stop Loss 구매 전략
- 이분법 모멘텀 브레이크업 역전 전략
- 피보나치 리트레이싱 타겟과 함께 ATR 트레일링 스톱 전략
- 볼링거 밴드 브레이크 트렌드 거래 전략
- 이동 평균 회전 전략에 기초한
- 골든 크로스오버를 기반으로 한 단기적 돌파구 전략
- 압축된 지표에 기초한 다시간 프레임 트렌드 거래 전략
- 모멘텀 라인 크로스오버 EMA 9 주식 MACD 전략
- 양적 오스실레이션 지표 조합 전략
- 이치모쿠 클라우드 트렌드 전략
- 일내 두 개의 이동 평균 거래 전략
- 마야 의 보물 사냥 가이드