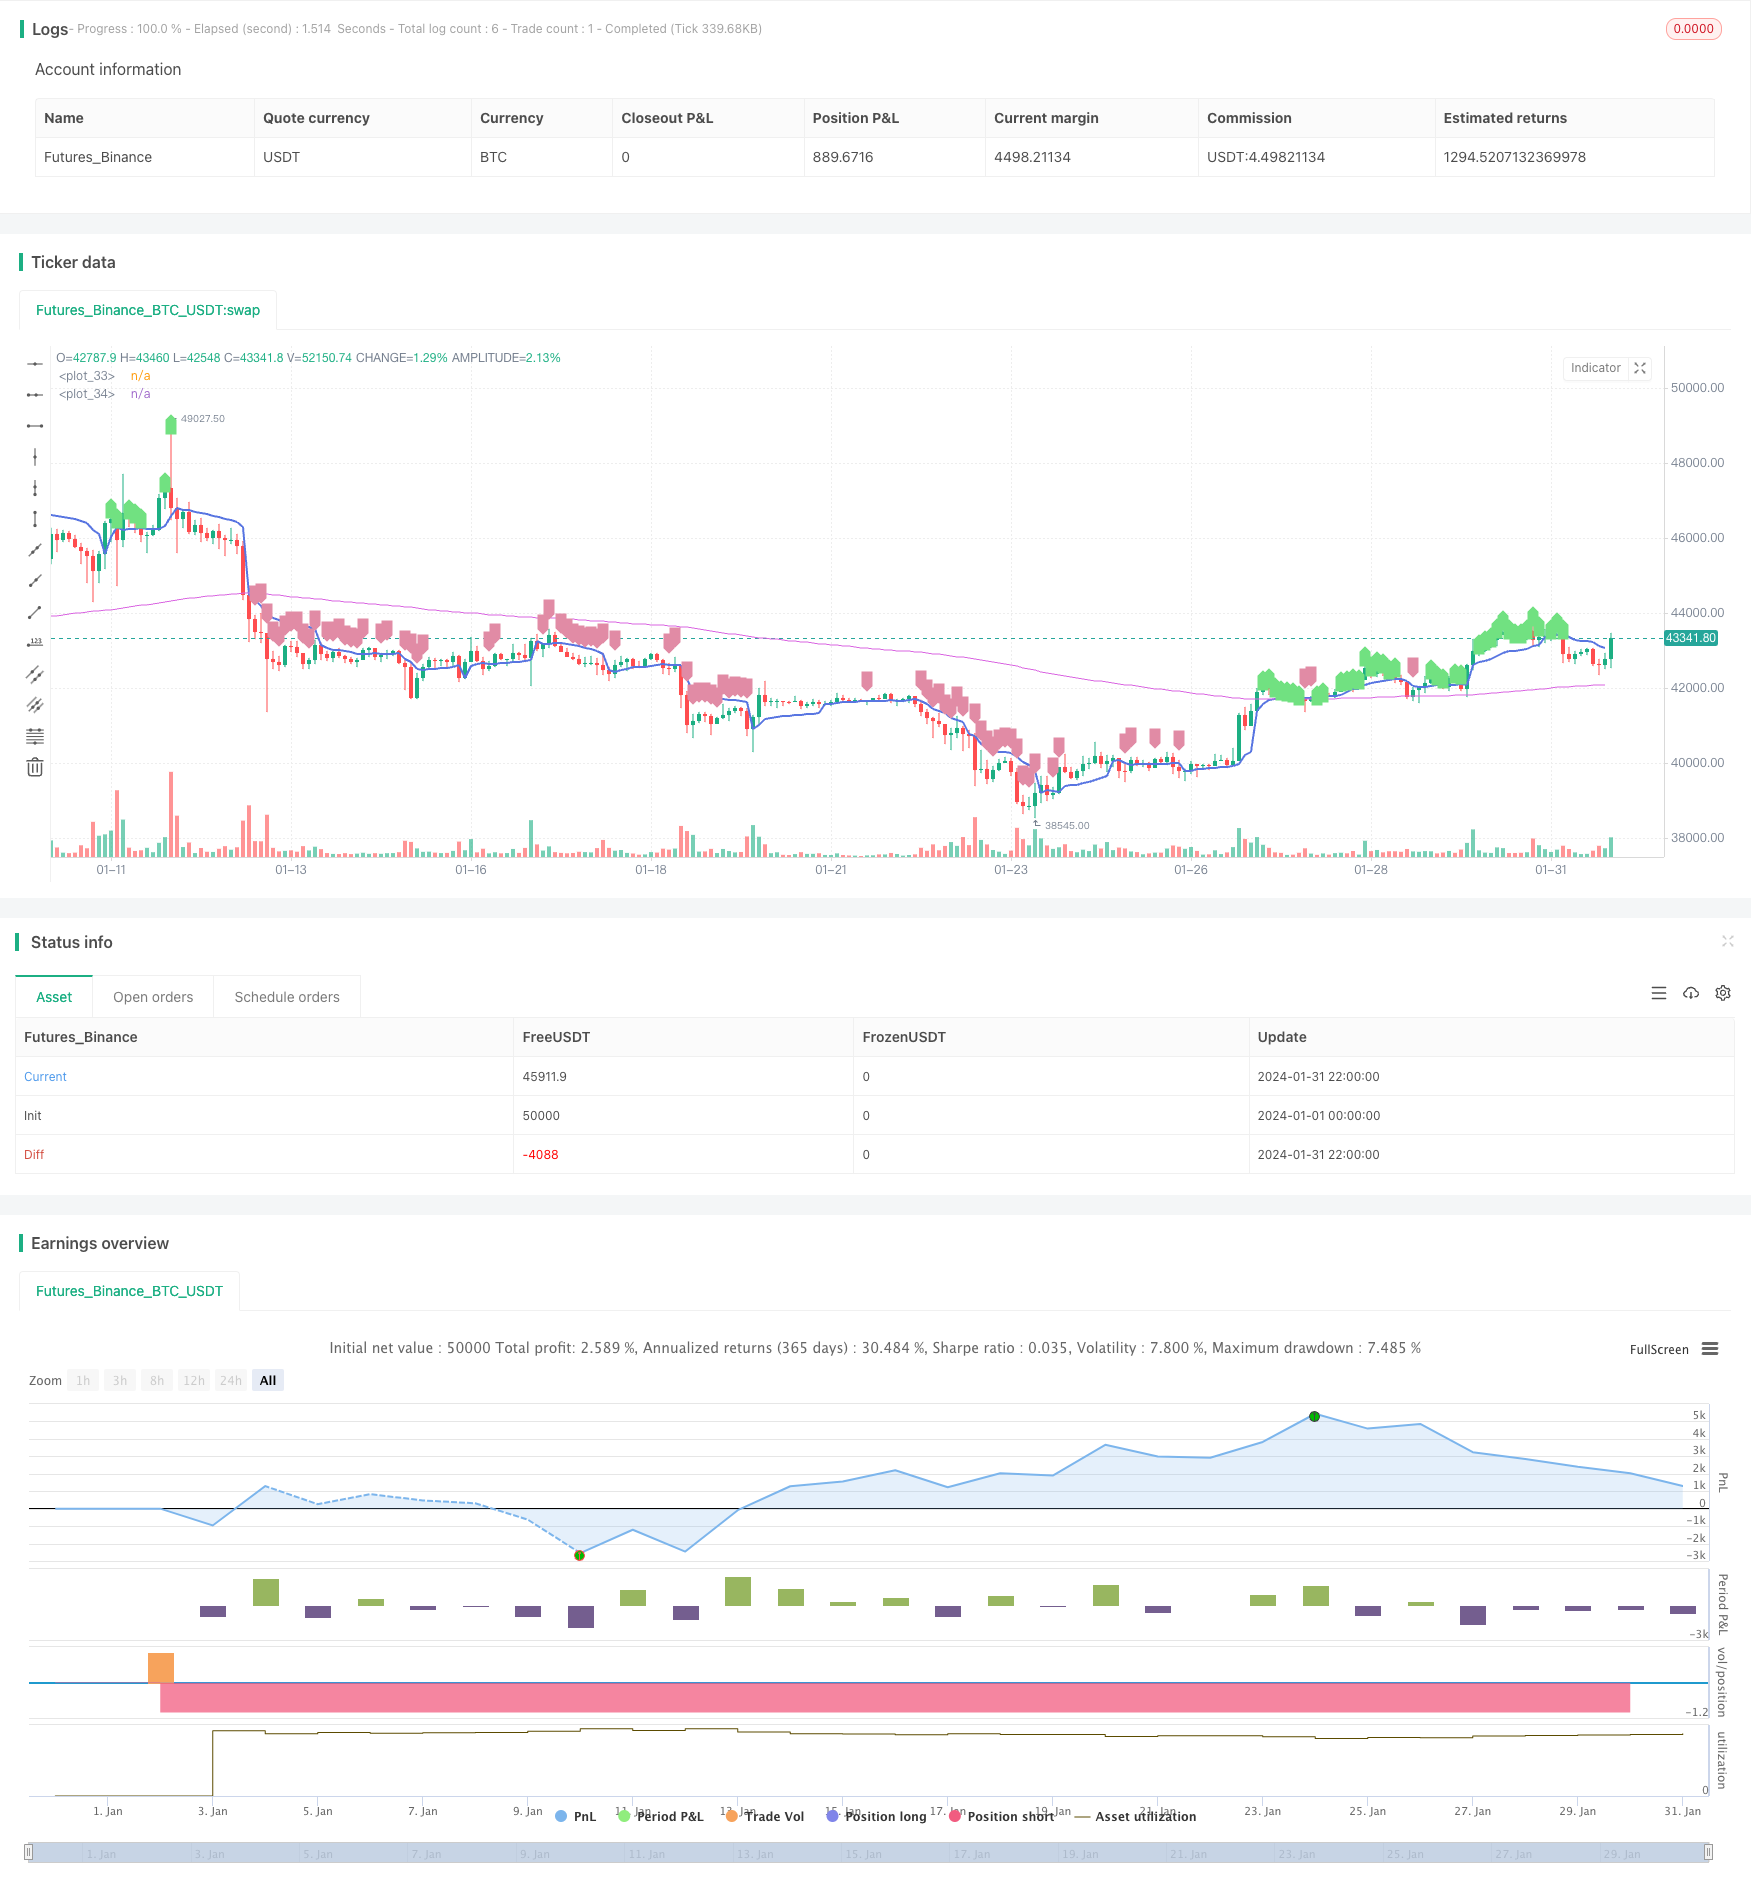
개요
이 전략은 VWAP와 EMA를 기준으로 트렌드 방향을 판단하는데, VWAP는 전형적인 가격을, EMA200는 중장선 트렌드를 나타낸다. 가격이 VWAP와 EMA200보다 높을 때 더 많이 하고, VWAP와 EMA200보다 낮을 때 더 많이 하락하는 것이 전형적인 트렌드를 따르는 전략이다.
전략 원칙
이 전략의 핵심 논리는 VWAP와 EMA를 사용하여 가격 동향을 판단하는 것이다.
- VWAP는 가격을 대표하는 전형적인 가격으로, 시장 참여자의 평균 비용을 반영할 수 있다. 가격이 VWAP보다 높으면 구매자의 힘이 증가하는 것을 대표하며, 더 많이 한다. 가격이 VWAP보다 낮으면 판매자의 힘이 증가하는 것을 대표하며, 공백을 해야 한다.
- EMA200은 가격의 중장선 경향을 나타냅니다. EMA200 위의 가격은 중장선 부진을 나타냅니다. 더 많이 해야합니다.
따라서, 이 전략은 우선 가격이 VWAP와 EMA200보다 동시에 높는지 판단하고, 만약 그렇다면 더 많이 한다. 가격이 VWAP와 EMA200보다 동시에 낮다면 공백을 한다.
또한, 전략은 스톱 스톱 손실 지점을 설정한다. 상장 후 스톱 스톱을 출구 가격의 3.5%, 상장 후 스톱 스톱은 1.4%로 설정하고, 상장 후 스톱 스톱을 출구 가격의 2.5%, 상장 후 스톱 스톱은 0.9%로 설정한다. 이것은 과도한 손실을 피할 수 있다.
전략적 이점
이 전략의 가장 큰 장점은 VWAP와 EMA를 이용해서 트렌드를 판단할 수 있다는 것입니다.
- VWAP는 시장 참가자들의 평균 비용을 정확하게 반영하여 트렌드를 판단하는 매우 좋은 지표입니다.
- EMA200은 중장선 트렌드를 명확하게 나타내고, 큰 트렌드의 방향을 매우 정확하게 판단할 수 있다.
따라서 VWAP와 EMA를 결합하여 트렌드를 판단하는 신뢰성이 매우 높습니다. 둘 다 동향을 판단할 때, 작업을 수행하는 성공률이 높습니다.
또한, 단독 손실이 너무 커지는 것을 방지할 수 있는 스톱 스톱 포인트를 설정한다.
전략적 위험
이 전략의 주요 위험은 VWAP와 EMA가 잘못된 신호를 보낼 수 있다는 것입니다.
- 시장이 급격하게 변동할 때, 가격은 VWAP에서 단기적으로 떨어져서 잘못된 신호를 보낼 수 있습니다.
- 새로운 트렌드가 막 시작될 때, EMA는 가격 변화에 뒤쳐져서 전략이 가장 좋은 진입 시점을 놓칠 수 있다.
또한, 스톱스토프의 설정이 부적절할 수 있고, 단독 손실이 너무 커질 위험이 남아 있습니다.
위와 같은 문제를 해결하기 위해, 우리는 VWAP와 EMA의 파라미터 설정을 최적화하여 새로운 트렌드의 시작을 더 잘 식별 할 수 있습니다. 또한, 조정 가능한 스톱 로드를 설정하여 스톱 로드가 가격 변동에 따라 조정 될 수 있습니다.
전략 최적화 방향
이 전략은 다음의 몇 가지 측면에서 최적화될 수 있습니다.
- VWAP 파라미터를 최적화하여 보다 안정적으로 추세를 판단하는 VWAP 파라미터 조합을 찾습니다.
- EMA 주기를 최적화하여 트렌드를 더 정확하게 판단할 수 있는 EMA 파라미터를 찾습니다.
- VWAP와 EMA와 결합하여 판단의 정확성을 높이기 위해 다른 판단 트렌드의 지표를 추가합니다.
- 자동적으로 스톱 스톱 손실을 설정하십시오. 스톱 스톱 손실 수준이 가격 변동에 따라 조정되도록하는 규칙에 따라 스톱 스톱 손실이 너무 강하지 않도록하십시오.
- 포지션 관리와 결합 회수, 연손이행 수 등 지표에 따라 포지션 크기를 조정하고, 전략 전반적인 위험을 제어
요약하다
이 전략은 전체적으로 매우 신뢰할 수 있는 트렌드 추적 전략이다. 그것은 VWAP와 EMA를 사용하여 트렌드 방향을 판단하고, 아이디어는 명확하고 간단하며, 둘 다 일치하는 신호를 발산할 때, 진입의 성공 확률은 높다. 합리적인 스톱포드를 설정함으로써 위험을 제어할 수 있다. 우리는 여전히 여러 가지 방법으로 (변수 최적화, 지표의 증가, 스톱포드의 적응, 포지션 관리 등) 이 전략을 더 개선하여 더 우수한 성과를 낼 수 있습니다.
/*backtest
start: 2024-01-01 00:00:00
end: 2024-01-31 23:59:59
period: 2h
basePeriod: 15m
exchanges: [{"eid":"Futures_Binance","currency":"BTC_USDT"}]
*/

//26m Binance BTCUSDTPERP
//@version=4
strategy("VWAP Trend Follower", initial_capital=100, overlay=true, commission_type=strategy.commission.percent, commission_value=0.04, default_qty_type = strategy.percent_of_equity, default_qty_value = 90, currency = currency.USD )

/// INITIALISE STRATEGY ///
price=close[1]
vprice=vwap(price)
trend=ema(price, 200)

/// RISK MANAGEMENT ///
long_tp_inp = input(3.5, title='Long Take Profit %',step=0.1)/100
long_sl_inp = input(1.4, title='Long Stop Loss %',step=0.1)/100
short_tp_inp = input(2.5, title='Short Take Profit %',step=0.1)/100
short_sl_inp = input(0.9, title='Short Stop Loss %',step=0.1)/100
long_take_level = strategy.position_avg_price * (1 + long_tp_inp)
long_stop_level = strategy.position_avg_price * (1 - long_sl_inp)
short_take_level = strategy.position_avg_price * (1 - short_tp_inp)
short_stop_level = strategy.position_avg_price * (1 + short_sl_inp)
//long_trailing = input(5, title='Trailing Stop Long',step=0.1) / 100
//short_trailing = input(5, title='Trailing Stop short',step=0.1) / 100

/// STRATEGY CONDITIONS ///
aLong= price > trend and price > vprice
entry_long = aLong and aLong[2] and aLong[1]
aShort= price < trend and price < vprice
entry_short = aShort and aShort[2] and aShort[1]
//exit_long =
//exit_short =
//entry_price_long=valuewhen(entry_long,close,0)
//entry_price_short=valuewhen(entry_short,close,0)

/// PLOTTING ///
plot(vprice,                color=#5875E1, linewidth=2)
plot(trend,                 color=#D965E1, linewidth=1)
plotshape(series=aLong,     color=#71E181,style=shape.labelup)
plotshape(series=aShort,    color=#E18BA5,style=shape.labeldown)
//plot(long_take_level,     color=#00E676, linewidth=2)
//plot(long_stop_level,     color=#FF5252, linewidth=1)
//plot(short_take_level,    color=#4CAF50, linewidth=2)
//plot(short_stop_level,    color=#FF5252, linewidth=1)

/// PERIOD ///
testStartYear   = input(2019, "Backtest Start Year")
testStartMonth  = input(1, "Backtest Start Month")
testStartDay    = input(1, "Backtest Start Day")
testPeriodStart = timestamp(testStartYear,testStartMonth,testStartDay,0,0)
testStopYear    = input(2020, "Backtest Stop Year")
testStopMonth   = input(12, "Backtest Stop Month")
testStopDay     = input(31, "Backtest Stop Day")
testPeriodStop  = timestamp(testStopYear,testStopMonth,testStopDay,0,0)
testPeriod() => true

//// STRATEGY EXECUTION ////

if testPeriod()
    if strategy.position_size == 0 or strategy.position_size > 0
        strategy.entry(id="Long", long=true, when=entry_long, comment="Long")
        strategy.exit("Take Profit/ Stop Loss","Long", limit=long_take_level, stop=long_stop_level,comment="Exit Long")//,trail_points=entry_price_long * long_trailing / syminfo.mintick, trail_offset=entry_price_long * long_trailing / syminfo.mintick)
//        strategy.close(id="Long", when=exit_long, comment = "Exit Long")

    if strategy.position_size == 0 or strategy.position_size < 0
        strategy.entry(id="Short", long=false, when=entry_short, comment = "Short")
        strategy.exit("Take Profit/ Stop Loss","Short", limit=short_take_level , stop=short_stop_level,comment = "Exit Short")//, trail_points=entry_price_short * short_trailing / syminfo.mintick, trail_offset=entry_price_short * short_trailing / syminfo.mintick)
//        strategy.close(id="Short", when=exit_short, comment = "Exit Short")