RSI Stop Loss 트래킹 전략
저자:차오장, 날짜: 2024-03-28 17:56:58태그:

전반적인 설명
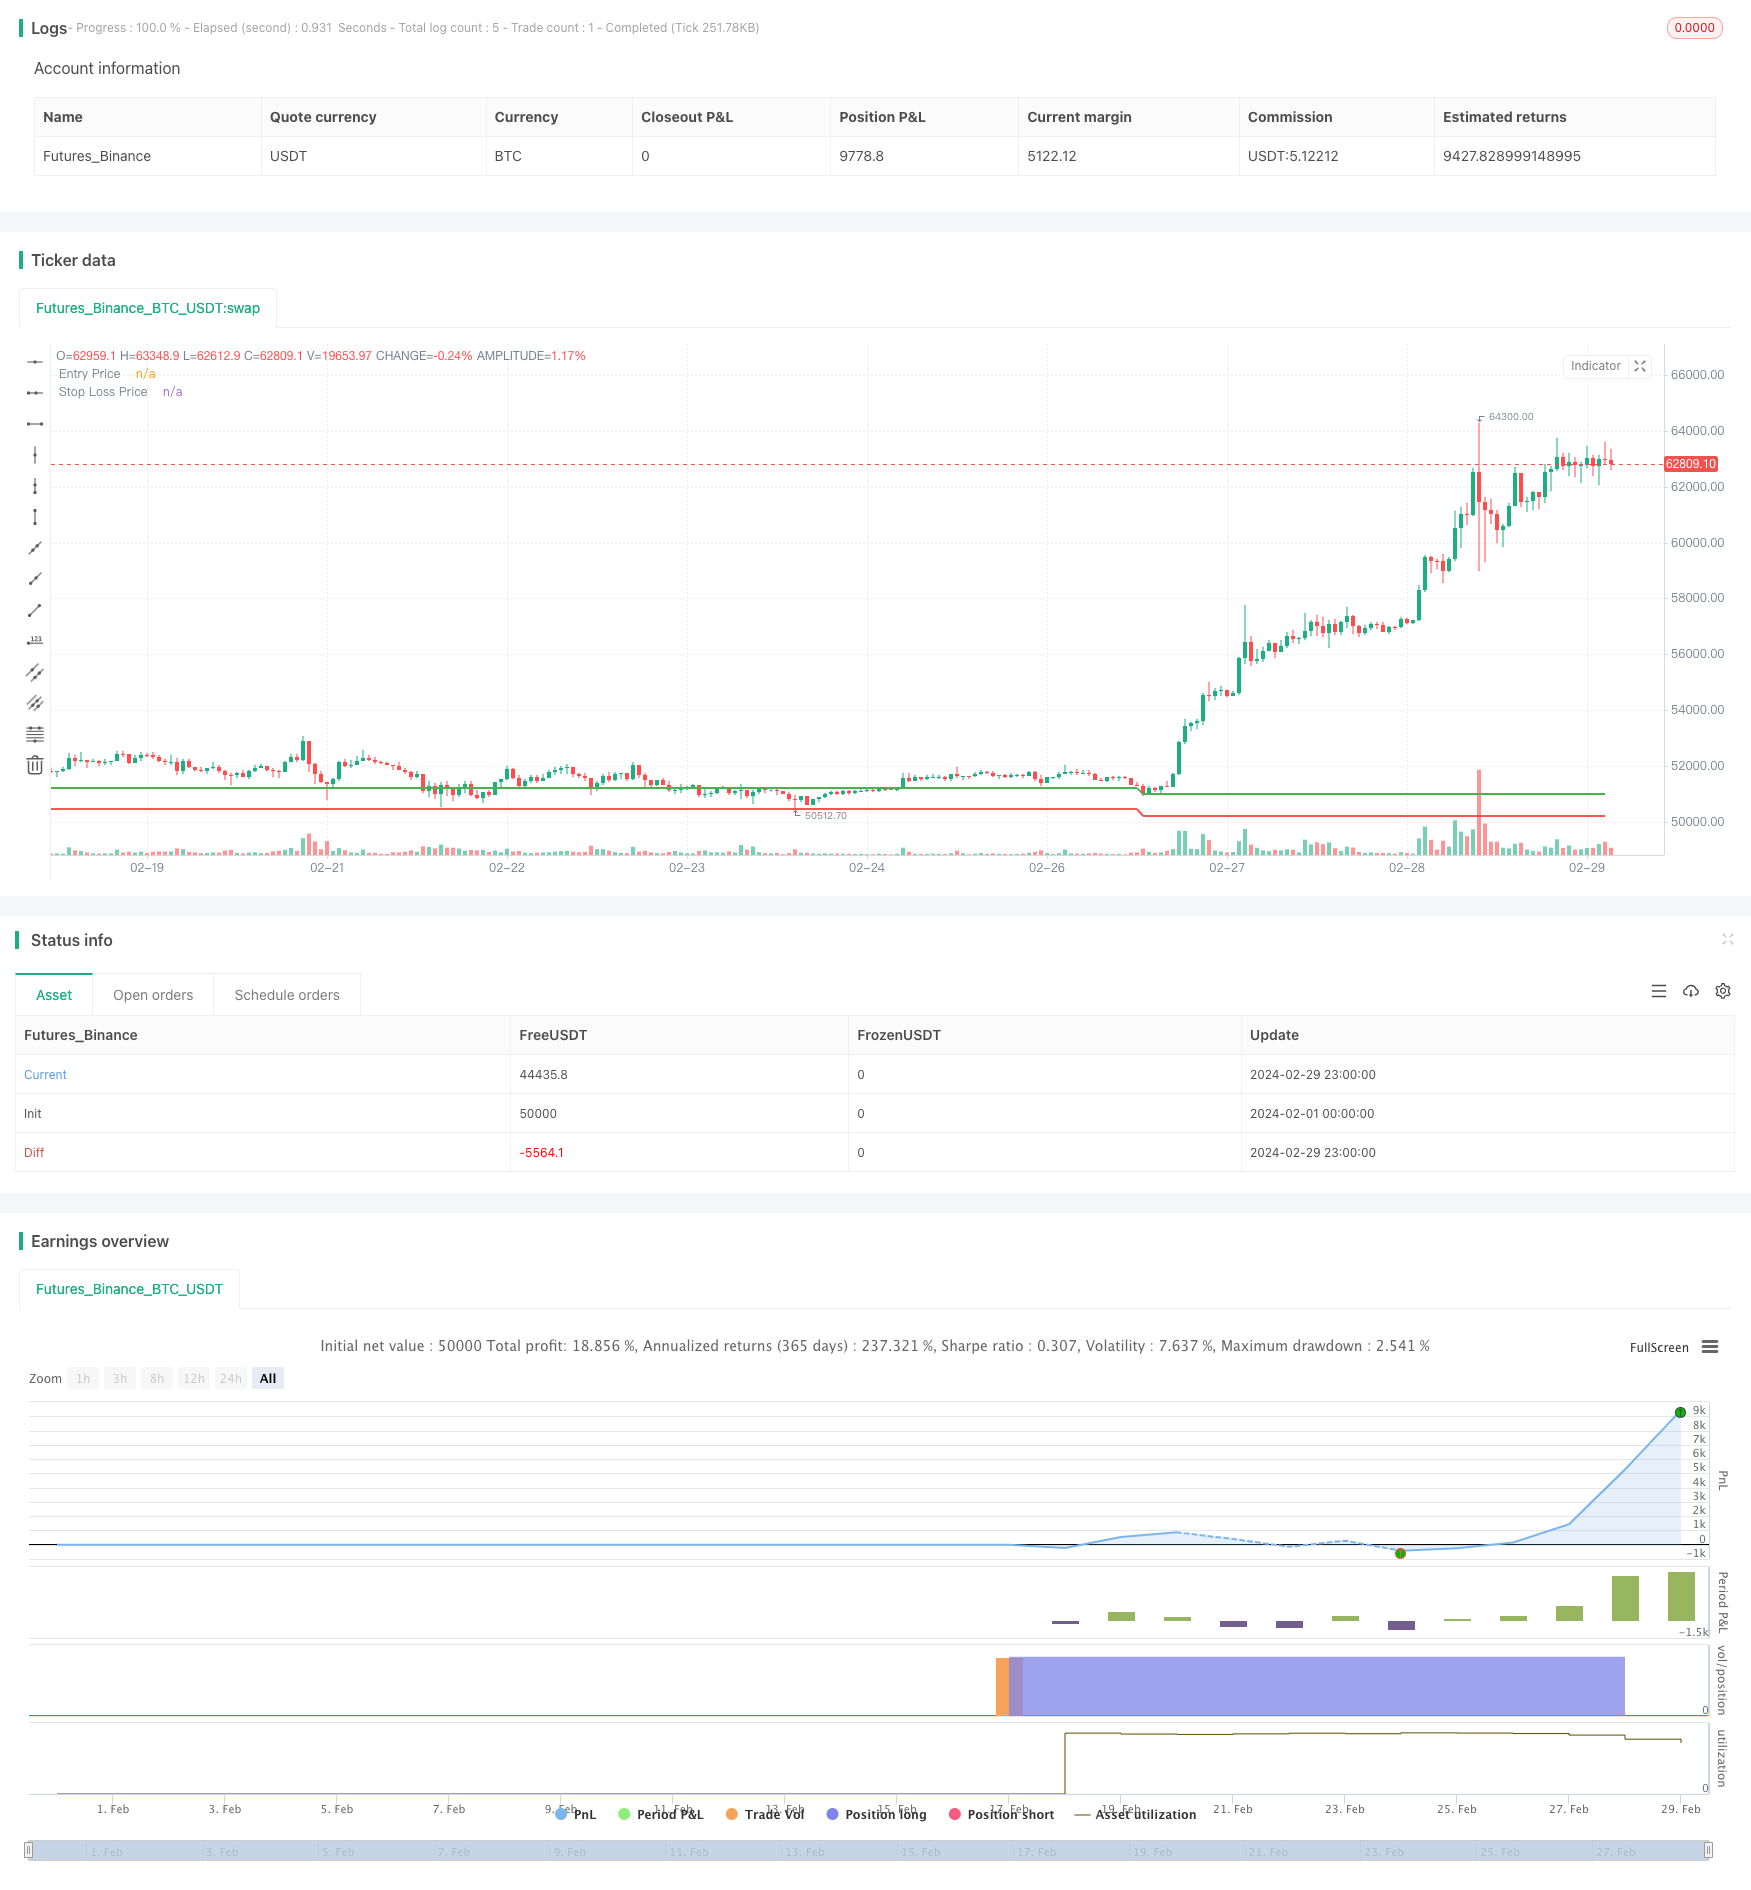
이 전략은 과잉 판매 시나리오 (RSI) 를 활용하여 과잉 판매 시나리오를 결정한다. RSI가 30 이하로 떨어지면 긴 포지션을 입력하고, 스톱 로스 가격은 엔트리 가격의 98.5%로 설정된다. 이 전략의 주된 아이디어는 과잉 판매 신호가 나타나면 시장에 진입하는 동시에 위험을 엄격히 제어하는 것이다. 가격이 스톱 로스 가격 이하로 떨어지면 지위를 즉시 폐쇄하여 손실을 막는다.
전략 원칙
- RSI 인디케이터는 14 바의 폐쇄 가격을 사용하여 계산합니다.
- RSI가 30 이하로 떨어지면 과잉 판매 신호가 생성되고 긴 지위가 입력됩니다.
- 입시 시점에는 입시 가격을 기록하고 입시 가격과 Stop Loss 비율 (1.5%) 를 기반으로 Stop Loss 가격을 계산합니다.
- 가격이 스톱 로스 가격 이하로 떨어지면 즉시 포지션을 닫고 손실을 멈추게 됩니다.
- 포지션을 마친 후, 엔트리 가격과 스톱 로스 가격을 재설정하고 다음 엔트리 기회를 기다립니다.
전략적 장점
- 단순하고 이해하기 쉽고, 명확한 논리로, 초보자 학습 및 사용에 적합합니다.
- 스톱 로스 가격을 설정하여 엄격한 리스크 통제. 스톱 로스 가격이 트리거되면 지위가 즉시 닫히며 손실의 확장을 최소화합니다.
- RSI 지표를 활용하여 과잉 판매 상황을 결정하여 단기적 과잉 판매 기간 후 시장에 적시에 진출하여 리바운드 기회를 잡을 수 있습니다.
- 코드는 간결하고 효율적이며 빠른 실행 속도로 거래 신호가 놓치지 않도록합니다.
전략 위험
- RSI 지표는 뒤떨어진 지표이며, 지표가 과판되어도 가격이 계속 하락하는 상황이 발생할 수 있습니다. 그러한 경우 시장에 진입하면 추가 손실의 위험이 발생할 수 있습니다.
- 고정 스톱 로스 비율은 시장 변동에 동적으로 대응할 수 없을 수 있습니다. 시장 변동이 심할 때 고정 스톱 로스는 빈번한 스톱 아웃으로 이어지고 후속 리바운드 기회를 놓칠 수 있습니다.
- 이 전략은 수익 목표를 가지고 있지 않으며 위험을 통제하기 위해 완전히 스톱 손실에 의존하고 있으며 이는 전반적인 수익성이 낮을 수 있습니다.
전략 최적화 방향
- RSI 인디케이터 외에도 다른 기술적 인 인디케이터를 도입하여 판단을 돕고 MACD, KDJ 등 신호 정확도를 향상시킵니다.
- 최적의 스톱 로스 설정을 찾기 위해 역사적 데이터에 기초하여 다른 스톱 로스 비율을 테스트하여 스톱 로스 비율을 최적화하십시오.
- 고정된 스톱 로스 위에 트레일링 스톱 로스 같은 동적 스톱 로스 메커니즘을 추가하여 스톱 로스를 보다 유연하고 효과적으로 만듭니다.
- 수익 목표를 설정하고 특정 수익 수준에 도달했을 때 적극적으로 포지션을 닫습니다.
요약
RSI 스톱 로스 트래킹 트레이딩 전략은 RSI 지표를 사용하여 과잉 판매 조건을 결정하면서 위험을 엄격히 제어하기 위해 고정된 스톱 로스 비율을 설정합니다. 전반적인 아이디어는 간단하고 이해하기 쉽고 초보자도 배우고 사용할 수 있습니다. 그러나이 전략에는 지연, 간단한 스톱 로스 메커니즘 및 낮은 수익성과 같은 문제도 있습니다. 전략의 안정성과 수익성을 향상시키기 위해 실제 응용에서 지속적으로 최적화하고 개선해야합니다.
/*backtest
start: 2024-02-01 00:00:00
end: 2024-02-29 23:59:59
period: 1h
basePeriod: 15m
exchanges: [{"eid":"Futures_Binance","currency":"BTC_USDT"}]
*/

//@version=5
strategy('RSI Trading Bot', overlay=true)

// RSI threshold value and stop loss percentage
rsiThreshold = 30
stopLossPercentage = 1.5

// Calculate RSI
rsiLength = 14
rsiValue = ta.rsi(close, rsiLength)

// Initialize variables
var bool positionOpen = false
var float entryPrice = na
var float stopLossPrice = na

// Enter position when RSI crosses below threshold
if ta.crossunder(rsiValue, rsiThreshold)
    strategy.entry('Long', strategy.long)
    positionOpen := true
    entryPrice := close
    stopLossPrice := entryPrice * (1 - stopLossPercentage / 100)
    stopLossPrice

// Exit position on stop loss
if positionOpen and close < stopLossPrice
    strategy.close('Long')
    positionOpen := false
    entryPrice := na
    stopLossPrice := na
    stopLossPrice

// Plot entry and stop loss prices
plot(entryPrice, title='Entry Price', color=color.new(color.green, 0), linewidth=2)
plot(stopLossPrice, title='Stop Loss Price', color=color.new(color.red, 0), linewidth=2)
더 많은
- 전략에 따른 역동적 경향
- 슈퍼트렌드 ATR 전략
- 3배 기하급수적 이동 평균 컨버전스 디버전스 및 상대적 강도 지표 결합 1분 차트 암호화폐 양적 거래 전략
- RSI 및 1시간 트렌드를 기반으로 한 이중 이동 평균 전략
- 기하급수적인 이동 평균 크로스오버 양적 거래 전략
- SMA 기반의 BankNifty 퓨처스 거래 전략
- 볼링거 밴드 및 RSI 거래 전략
- 가우스 채널 적응 이동 평균 전략
- 타겟/스톱 로스 비율과 고정 포지션 크기와 함께 EMA 크로스오버 전략
- 이동 평균 회전 추적 전략
- SMA 이동 평균 크로스오버 전략
- 볼링거 5분 브레이크업 내일 거래 전략
- 변동과 이동 평균에 기반한 변동성 전략
- 이동 평균 크로스오버 양적 전략
- EMA 크로스 ADR 전략 - 엄격한 리스크 관리와 함께 다차원적 기술 지표 기반 거래 방법
- 촛불 패턴에 기초한 상승 및 하락 포용 전략
- 볼링거 밴드 롱 단 전략
- 알파트렌드와 볼링거 밴드 합성 평균 반전 + 트렌드 다음 전략
- 그리드 달러 비용 평균화 전략
- 양적 거래 전략 세 개의 연속적인 상승/하락 촛불과 이중 이동 평균에 기초