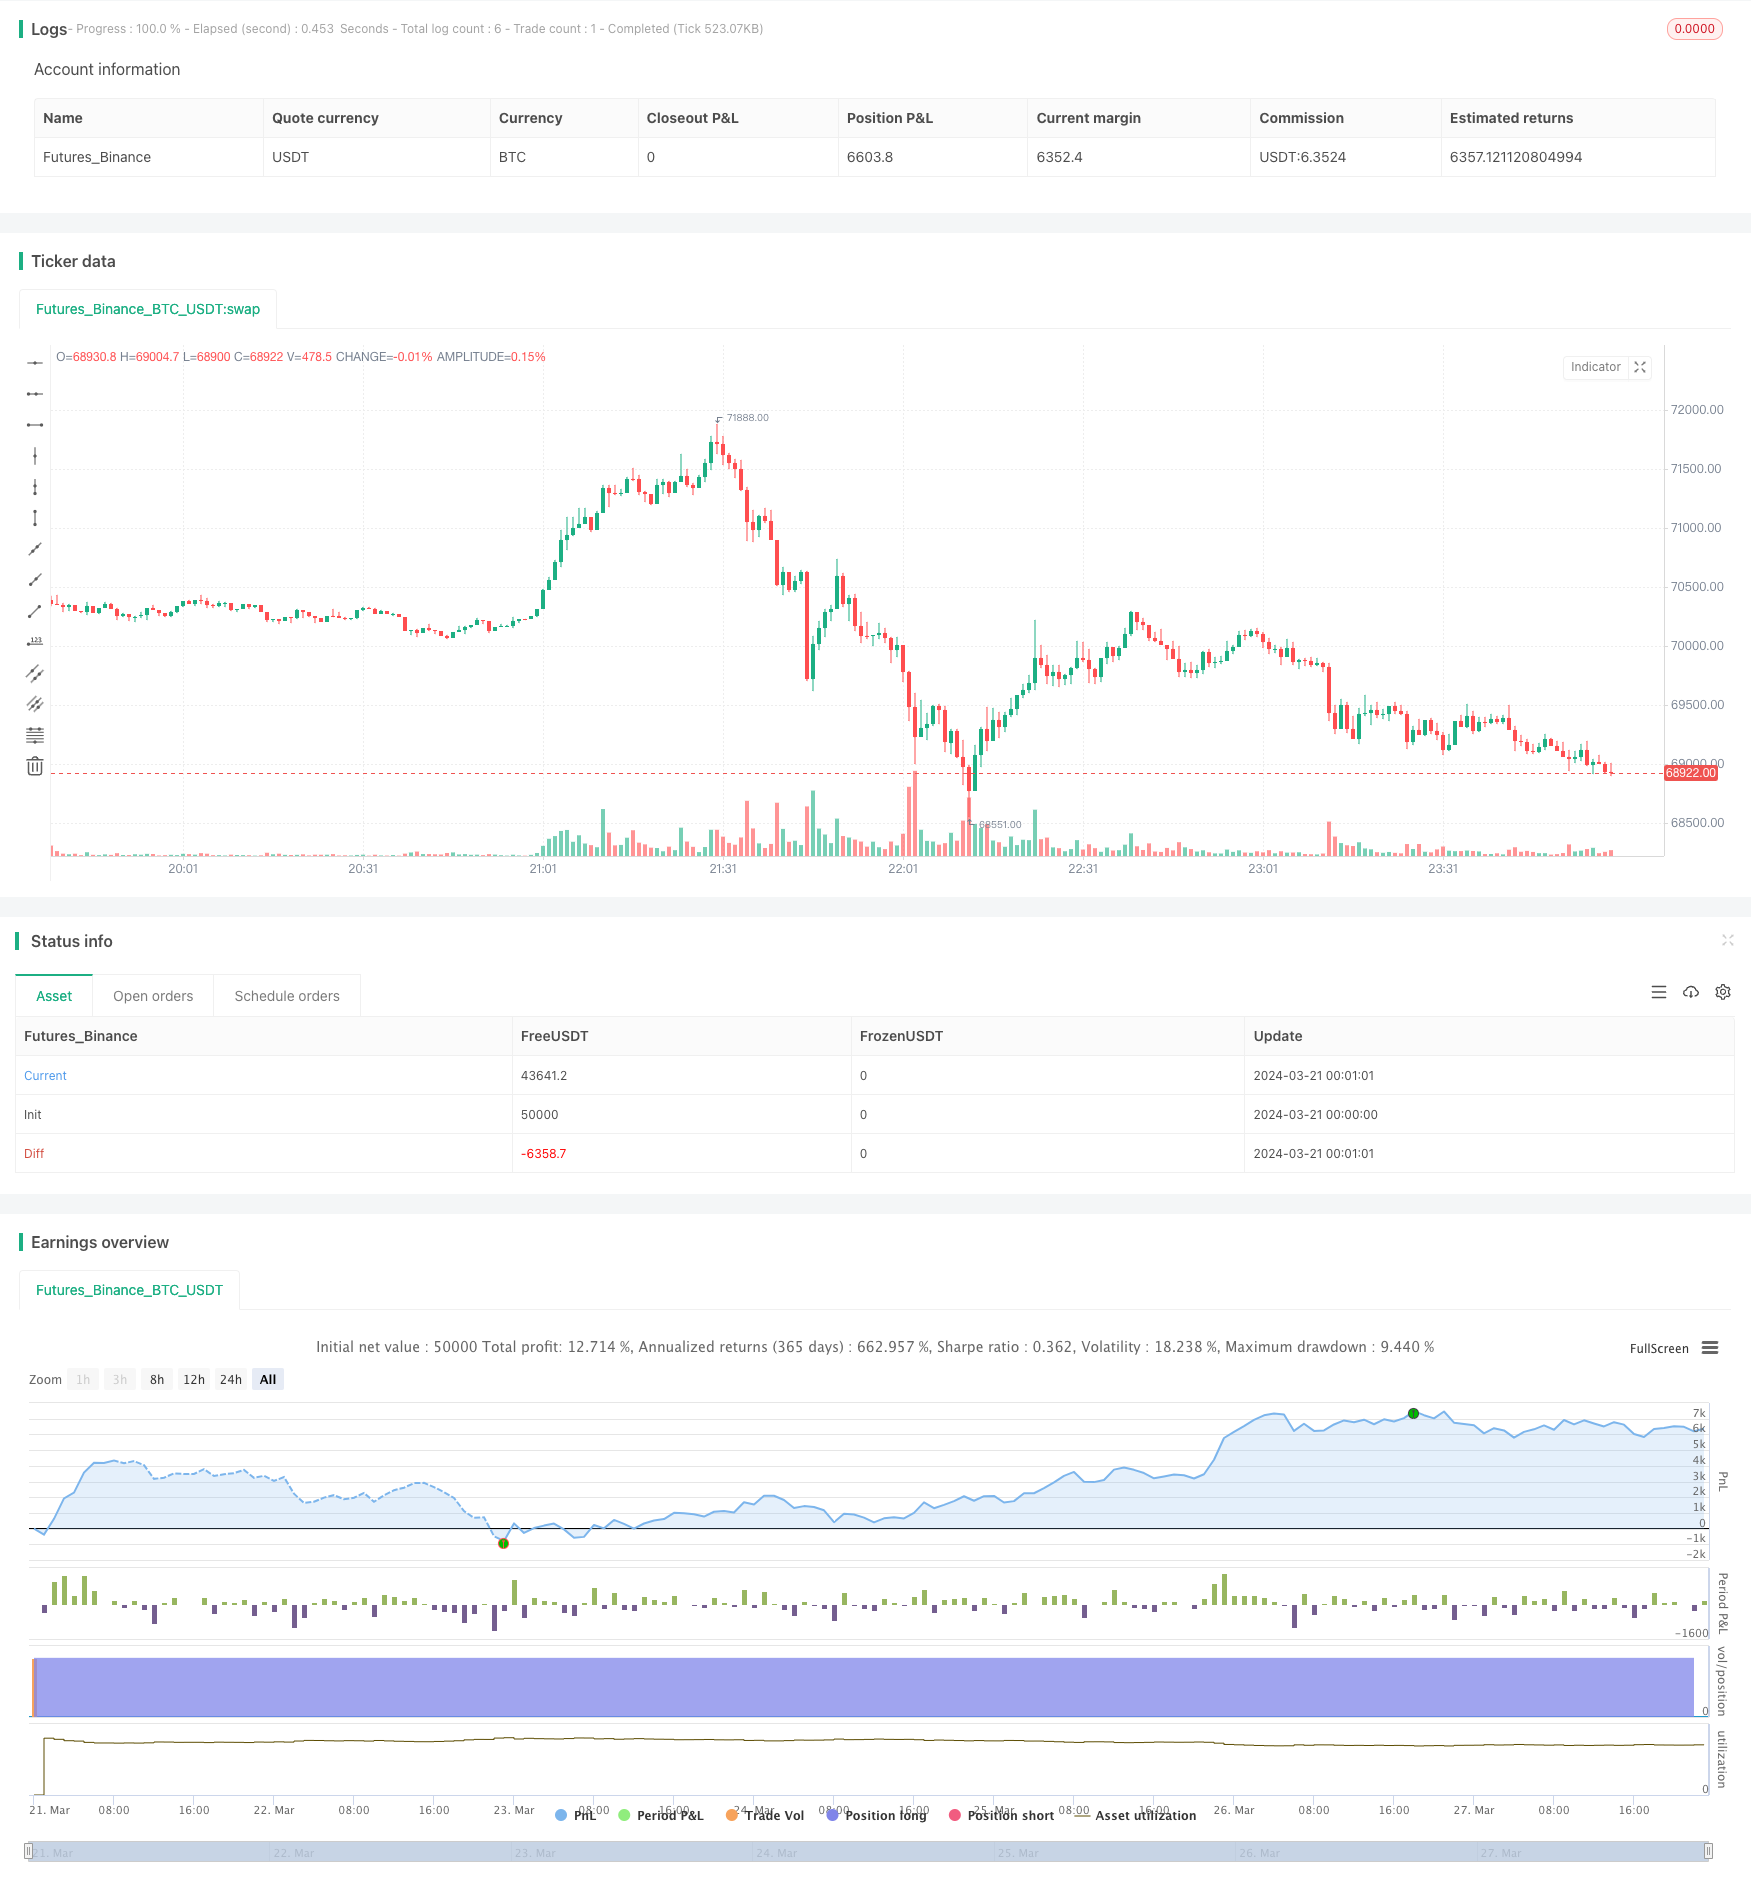
EMA RSI 트렌드 추적 및 모멘텀 전략
저자:차오장, 날짜: 2024-03-29 16:30:42태그:

전반적인 설명
바이비트 EMA RSI 트렌드-추천 및 모멘텀 전략은 기하급수적 이동 평균 (EMA) 과 상대적 강도 지수 (RSI) 를 결합한 양적 거래 전략이다. 전략은 시장 추세를 결정하기 위해 서로 다른 기간을 가진 두 개의 EMA와 트렌드의 타당성을 확인하기 위해 RSI 지표를 사용합니다. 빠른 EMA가 느린 EMA를 넘어서고 RSI가 특정 하위 임계 이하로 떨어지면 전략은 긴 신호를 생성합니다. 반대로 빠른 EMA가 느린 EMA를 넘어서고 RSI가 특정 상위 임계 이상으로 떨어지면 전략은 짧은 신호를 생성합니다. 전략에는 또한 바이비트 계정 수준에 따라 다른 수수료 비율을 설정하고 위험을 효과적으로 관리하기 위해 내장 된 수익 및 손실 중지 기능을 포함합니다.
전략 원칙
- 빠른 EMA와 느린 EMA를 각각 90 및 300의 기간으로 계산합니다.
- RSI 지표를 5의 기간으로 계산합니다.
- 빠른 EMA가 느린 EMA를 넘고 RSI가 45보다 낮을 때 긴 신호를 생성한다. 빠른 EMA가 느린 EMA를 넘고 RSI가 85보다 높을 때 짧은 신호를 생성한다.
- Bybit 계정 수준에 따라 다른 수수료 비율을 설정합니다. VIP 0의 0.075%에서 VIP 4의 0.035%까지요.
- 수수료를 포함해서 입시 가격을 계산합니다.
- 이윤을 취하고 손실을 멈추는 가격을 정해진 비율 (5% 및 3%) 에 기초하여 계산합니다.
- 진입값을 그래프에 그려서 수익선과 손해를 멈추는 선을 그려보세요.
- 트레이딩 신호를 기반으로 엔트리 오더를 실행합니다.
전략적 장점
- 트렌드 추적 및 동력 지표를 결합하여 시장 추세를 효과적으로 파악합니다.
- 리스크를 효과적으로 관리하기 위해 내장된 수익 및 손실 중지 기능을 포함합니다.
- Bybit 계정 수준에 따라 다른 수수료 비율을 설정하고, 다른 사용자들의 거래 조건에 적응합니다.
- 차트에서 엔트리 가격, 수익 라인 및 스톱 로스 라인을 그래프로 표시하여 거래 신호를 시각적으로 확인합니다.
전략 위험
- EMA와 RSI 매개 변수 선택은 모든 시장 조건에 적합하지 않을 수 있으며 실제 상황에 따라 최적화를 요구할 수 있습니다.
- 불안정한 시장에서 전략은 높은 거래 비용을 초래하는 빈번한 거래 신호를 생성 할 수 있습니다.
- 수익을 취하고 손실을 중지하는 설정은 너무 보수적이거나 공격적이어서 개인 위험 선호도에 따라 조정해야 할 수 있습니다.
전략 최적화 방향
- 다른 시장 조건에 적응하기 위해 EMA 및 RSI 매개 변수를 최적화합니다. 최적의 매개 변수 조합을 찾기 위해 백테스팅 및 매개 변수 스캔을 통해 수행 할 수 있습니다.
- 거래 신호의 정확성을 향상시키기 위해 볼링거 밴드, MACD 등과 같은 다른 기술 지표를 도입하십시오.
- 예를 들어, 수익을 더 잘 보호하고 위험을 관리하기 위해 트레일링 스톱 또는 동적 스톱 손실 방법을 사용하여 수익 및 스톱 손실 설정을 최적화하십시오.
- 시장 변동성 및 거래량과 같은 요소를 고려하여 거래 신호를 필터하고 빈번한 거래와 관련된 비용을 줄이십시오.
요약
바이비트 EMA RSI 트렌드 추적 및 모멘텀 전략은 트렌드 추적 및 모멘텀 지표를 결합한 양적 거래 전략이다. EMA와 RSI를 함께 사용하면 시장 트렌드를 효과적으로 파악할 수 있다. 전략에는 내장된 수익 및 스톱 로스 기능이 포함되어 있으며 바이비트 계정 수준에 따라 수수료 비율을 설정하여 위험을 효과적으로 관리하고 다른 사용자들의 거래 조건에 적응할 수 있다. 그러나, 여전히 매개 변수 최적화, 다른 기술적 지표 도입, 수익 및 스톱 로스 설정을 최적화하는 등의 전략에서 최적화의 여지가 있다. 지속적인 최적화와 개선으로, 전략은 실제 거래에서 더 나은 결과를 얻을 것으로 예상된다.
/*backtest
start: 2024-03-21 00:00:00
end: 2024-03-28 00:00:00
period: 1m
basePeriod: 1m
exchanges: [{"eid":"Futures_Binance","currency":"BTC_USDT"}]
*/

// @BryanAaron

//@version=5
strategy("Bybit EMA RSI Strategy", overlay=true)

// Input parameters
fastLength = input(90, title="Fast EMA Length")
slowLength = input(300, title="Slow EMA Length")
rsiLength = input(5, title="RSI Length")
rsiUpperThreshold = input(85, title="RSI Upper Threshold")
rsiLowerThreshold = input(45, title="RSI Lower Threshold")
takeProfitPerc = input(5, title="Take Profit %")
stopLossPerc = input(3, title="Stop Loss %")
bybitAccountLevel = input.string("VIP 0", title="Bybit Account Level", options=["VIP 0", "VIP 1", "VIP 2", "VIP 3", "VIP 4"])

// Calculate moving averages
fastMA = ta.ema(close, fastLength)
slowMA = ta.ema(close, slowLength)

// Calculate RSI
rsi = ta.rsi(close, rsiLength)

// Trading conditions
longCondition = (fastMA > slowMA) and (rsi < rsiLowerThreshold)
shortCondition = (fastMA < slowMA) and (rsi > rsiUpperThreshold)

// Set commission based on Bybit account level
commissionPerc = switch bybitAccountLevel
    "VIP 0" => 0.075
    "VIP 1" => 0.065
    "VIP 2" => 0.055
    "VIP 3" => 0.045
    "VIP 4" => 0.035
    => 0.075

// Calculate entry prices with commission
var float longEntryPrice = na
var float shortEntryPrice = na

longEntryPriceWithCommission = close * (1 + commissionPerc / 100)
shortEntryPriceWithCommission = close * (1 - commissionPerc / 100)

// Calculate take profit and stop loss prices
takeProfitPrice(entryPrice) => entryPrice * (1 + takeProfitPerc / 100)
stopLossPrice(entryPrice) => entryPrice * (1 - stopLossPerc / 100)

// Plot entry prices
plotchar(longCondition, title="Long Entry Price", char="LE", location=location.belowbar, color=color.green)
plotchar(shortCondition, title="Short Entry Price", char="SE", location=location.abovebar, color=color.red)

// Draw position on the chart
longColor = color.green
shortColor = color.red
profitColor = color.new(color.green, 80)
lossColor = color.new(color.red, 80)

plotshape(longCondition and strategy.position_size > 0, title="Long Position", text="Long", location=location.belowbar, style=shape.labelup, size=size.small, color=longColor, textcolor=color.white)
plotshape(shortCondition and strategy.position_size < 0, title="Short Position", text="Short", location=location.abovebar, style=shape.labeldown, size=size.small, color=shortColor, textcolor=color.white)

if (strategy.position_size > 0)
    line.new(bar_index, longEntryPrice, bar_index + 1, longEntryPrice, color=longColor, width=2)

    longProfitLine = line.new(bar_index, takeProfitPrice(longEntryPrice), bar_index + 1, takeProfitPrice(longEntryPrice), color=profitColor, width=1)
    longLossLine = line.new(bar_index, stopLossPrice(longEntryPrice), bar_index + 1, stopLossPrice(longEntryPrice), color=lossColor, width=1)


else if (strategy.position_size < 0)
    line.new(bar_index, shortEntryPrice, bar_index + 1, shortEntryPrice, color=shortColor, width=2)

    shortProfitLine = line.new(bar_index, stopLossPrice(shortEntryPrice), bar_index + 1, stopLossPrice(shortEntryPrice), color=profitColor, width=1)
    shortLossLine = line.new(bar_index, takeProfitPrice(shortEntryPrice), bar_index + 1, takeProfitPrice(shortEntryPrice), color=lossColor, width=1)


// Entry
if (longCondition)
    strategy.entry("Long", strategy.long)
    longEntryPrice := longEntryPriceWithCommission
else if (shortCondition)
    strategy.entry("Short", strategy.short)
    shortEntryPrice := shortEntryPriceWithCommission
더 많은
- 전략에 따른 변동성 추세
- 이중 이동 평균 및 RSI 기반 단기 확장 트렌드 전략
- 듀얼 레인지 필터 모멘텀 거래 전략
- VWAP 이동 평균 크로스오버와 동적 ATR 스톱 로스 및 영업 전략
- 자금 데이터에 기초한 시간 계열 적응적 동적 기준 전략
- 아시아 세션 높은 낮은 브레이크업 전략
- 화살표와 경고 전략으로 마커스의 트렌드 트레이더
- 전략에 따른 EMA의 이중 이동평균 크로스오버 트렌드
- 이동 평균 크로스오버 전략
- 수동 TP와 SL로 RSI 모멘텀 전략
- 가우스 채널 트렌드 전략
- 볼링거 밴드와 DCA를 결합한 고주파 거래 전략
- 전략에 따라 상대적 강도 지표의 변화 추세
- 내일 상승성 브레이크업 전략
- EMA-MACD-SuperTrend-ADX-ATR 다중 지표 거래 신호 전략
- 트렌드를 따르는 변수 위치 그리드 전략
- 슈퍼트렌드와 볼린거 밴드 조합 전략
- MACD 트렌드 전략
- EMA의 이중 이동 평균 크로스오버 전략
- XAUUSD 1분 스칼핑 전략