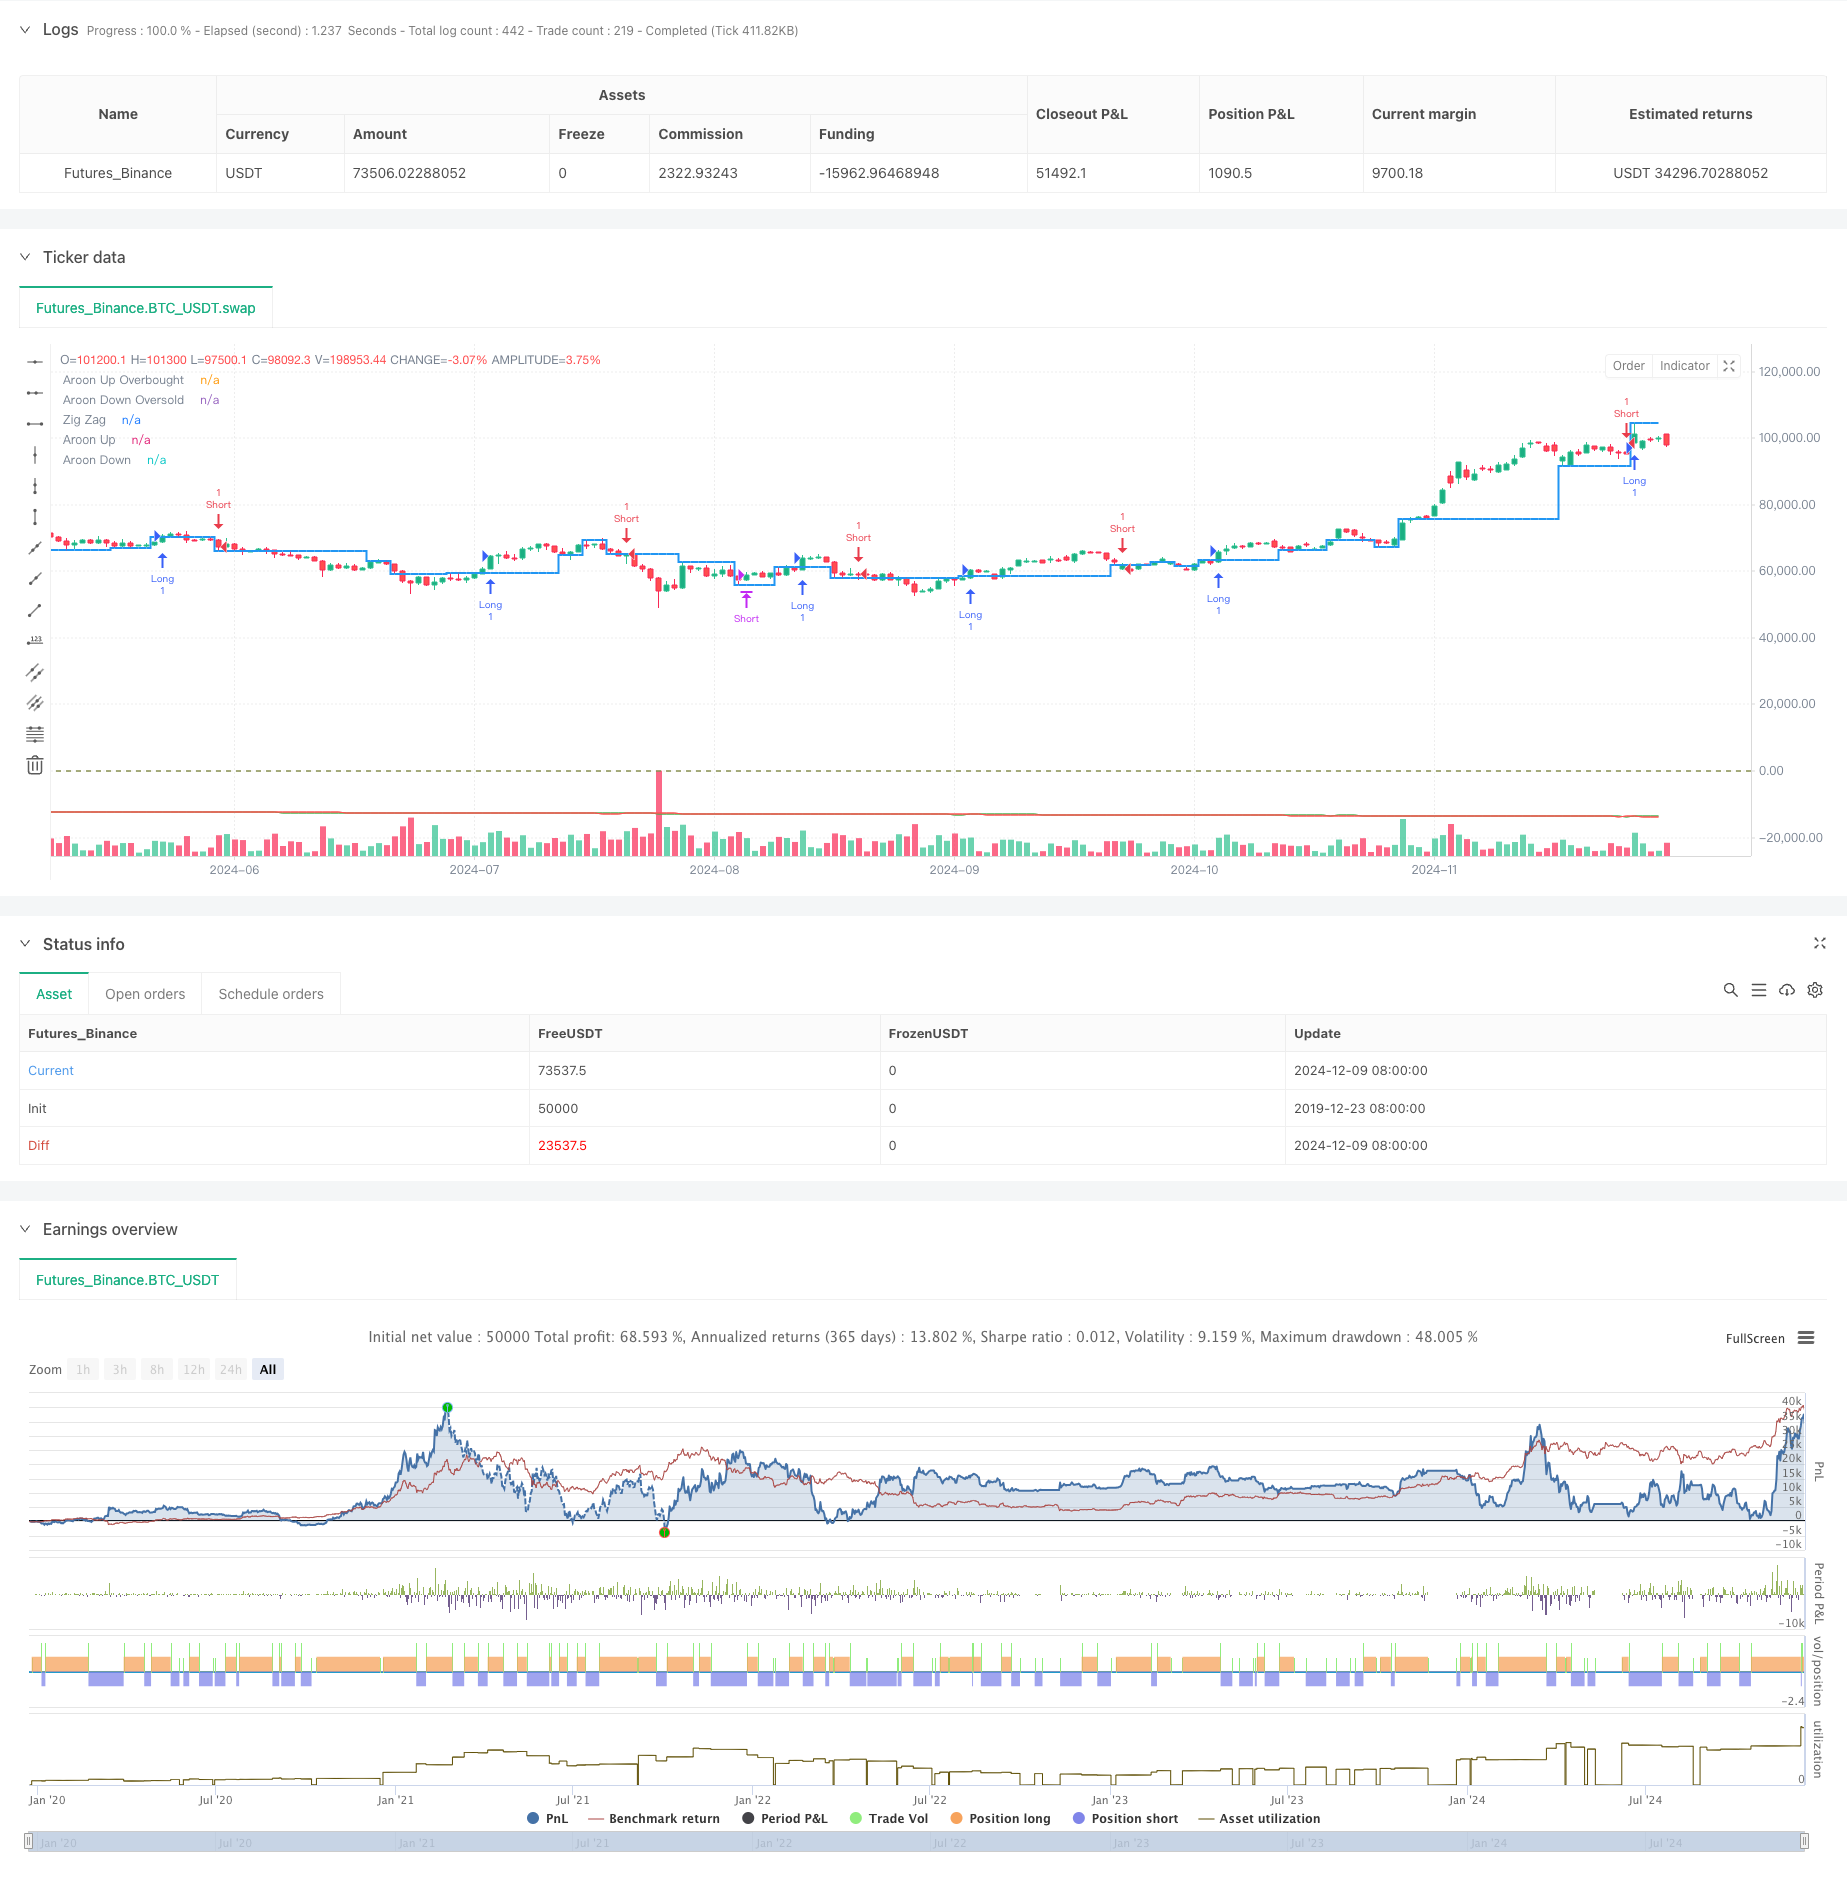
개요
이 전략은 ZigZag 지표와 Aroon 지표가 결합된 적응 거래 시스템이다. ZigZag 지표는 시장 소음을 필터링하고 중요한 가격 변동을 식별하는 데 사용되며, Aroon 지표는 트렌드의 강도와 잠재적인 반전을 확인하는 데 사용된다. 이 전략은 두 지표의 조화를 통해 트렌드에 민감성을 유지하면서 시장의 전환점을 적시에 잡을 수 있다.
전략 원칙
전략의 핵심 논리는 다음과 같은 핵심 요소에 기초합니다.
- 지그자그 지표는 깊이 파라미터를 설정하여 단기 변동성을 필터링하여 통계적으로 중요한 가격 변동만을 유지한다.
- 아론 지표는 최고 가격과 최저 가격의 시간 간격을 계산하여 Aroon Up와 Aroon Down 두 개의 선을 생성한다.
- 입력 신호는 두 가지 조건에 의해 촉발됩니다.
- Aroon Up가 Aroon Down을 뚫고 ZigZag가 상승세를 보였을 때, Aroon Up는 Aroon Up을 뚫고 ZigZag가 상승세를 보였을 때, Aroon Up는 Aroon Down을 뚫고 ZigZag가 상승세를 보였을 때, ZigZag는 Aroon Up를 뚫고 Aroon Down을 뚫고 Aroon Up을 뚫고 ZigZag가 상승세를 보였을 때,
- 아론 다운이 아론 업을 뚫고 지그자그가 하향세를 보인 동시에 공백을 열었습니다.
- 출구 신호는 아론 지표의 교차로에서 발생한다:
- 아론 다운에서 더 많은 포지션, 아론 업에서 더 적은 포지션
- 아론 업 (Aroon Up) 에서 아론 다운 (Aroon Down) 을 통과할 때 빈 가방을 평정한다.
전략적 이점
- 이중 확인 메커니즘은 거래의 신뢰성을 높이고 가짜 신호를 줄여줍니다.
- ZigZag 지표의 사용은 시장 소음의 영향을 효과적으로 줄였습니다.
- Aroon 지표는 트렌드 강도를 수치적으로 측정할 수 있습니다.
- 전략은 다양한 시장 환경에 적응할 수 있습니다.
- 출전 메커니즘이 명확해져 위험을 통제하는데 도움이 됩니다.
전략적 위험
- 불안정한 시장에서 거래 신호가 자주 발생하여 거래 비용이 증가할 수 있습니다.
- 지그자그 지표의 지연으로 인해 출입 시기가 약간 늦어질 수 있습니다.
- 매개 변수의 선택은 전략의 성과에 큰 영향을 미칩니다.
- 급격한 반전 시에는 더 큰 반전이 일어날 수 있다.
전략 최적화 방향
- 시장의 변동에 따라 변수를 조정하는 변동률 지표를 도입한다.
- 추가적인 확인을 위해 거래량 지표를 추가하십시오.
- 손해제기를 최적화하여 이동형 손해제기를 추가합니다.
- 시장 환경 분류에 포함하는 것을 고려하고, 다른 시장 환경에서는 다른 파라미터 조합을 사용한다.
- 포지션 관리 시스템을 도입하여 신호 강도에 따라 포지션 크기를 조정한다.
요약하다
이 전략은 ZigZag와 Aroon 지표를 결합하여 비교적 완전한 트렌드 추적 시스템을 구축한다. 전략의 장점은 자율 적응성과 이중 확인 메커니즘에 있다. 그러나 동시에 전략의 성능에 대한 파라미터 선택과 시장 환경의 영향을 고려해야 한다. 지속적인 최적화와 개선으로 전략은 실제 거래에서 안정적인 성능을 기대한다.
전략 소스 코드
/*backtest
start: 2019-12-23 08:00:00
end: 2024-12-10 08:00:00
period: 1d
basePeriod: 1d
exchanges: [{"eid":"Futures_Binance","currency":"BTC_USDT"}]
*/

//@version=5
strategy("Zig Zag + Aroon Strategy", overlay=true)

// Zig Zag parameters
zigzagDepth = input(5, title="Zig Zag Depth")

// Aroon parameters
aroonLength = input(14, title="Aroon Length")

// Zig Zag logic
var float lastZigZag = na
var float lastZigZagHigh = na
var float lastZigZagLow = na
var int direction = 0  // 1 for up, -1 for down

// Calculate Zig Zag
if (not na(high) and high >= ta.highest(high, zigzagDepth) and direction != 1)
    lastZigZag := high
    lastZigZagHigh := high
    direction := 1
if (not na(low) and low <= ta.lowest(low, zigzagDepth) and direction != -1)
    lastZigZag := low
    lastZigZagLow := low
    direction := -1

// Aroon calculation
highestHigh = ta.highest(high, aroonLength)
lowestLow = ta.lowest(low, aroonLength)
aroonUp = (aroonLength - (bar_index - ta.highestbars(high, aroonLength))) / aroonLength * 100
aroonDown = (aroonLength - (bar_index - ta.lowestbars(low, aroonLength))) / aroonLength * 100

// Long entry condition
longCondition = (ta.crossover(aroonUp, aroonDown)) and (lastZigZag == lastZigZagHigh)
if (longCondition)
    strategy.entry("Long", strategy.long)

// Short entry condition
shortCondition = (ta.crossover(aroonDown, aroonUp)) and (lastZigZag == lastZigZagLow)
if (shortCondition)
    strategy.entry("Short", strategy.short)

// Exit conditions
if (ta.crossover(aroonDown, aroonUp) and strategy.position_size > 0)
    strategy.close("Long")

if (ta.crossover(aroonUp, aroonDown) and strategy.position_size < 0)
    strategy.close("Short")

// Plot Zig Zag
plot(lastZigZag, color=color.blue, title="Zig Zag", linewidth=2, style=plot.style_stepline)

// Plot Aroon
hline(70, "Aroon Up Overbought", color=color.red)
hline(30, "Aroon Down Oversold", color=color.green)
plot(aroonUp, color=color.green, title="Aroon Up")
plot(aroonDown, color=color.red, title="Aroon Down")