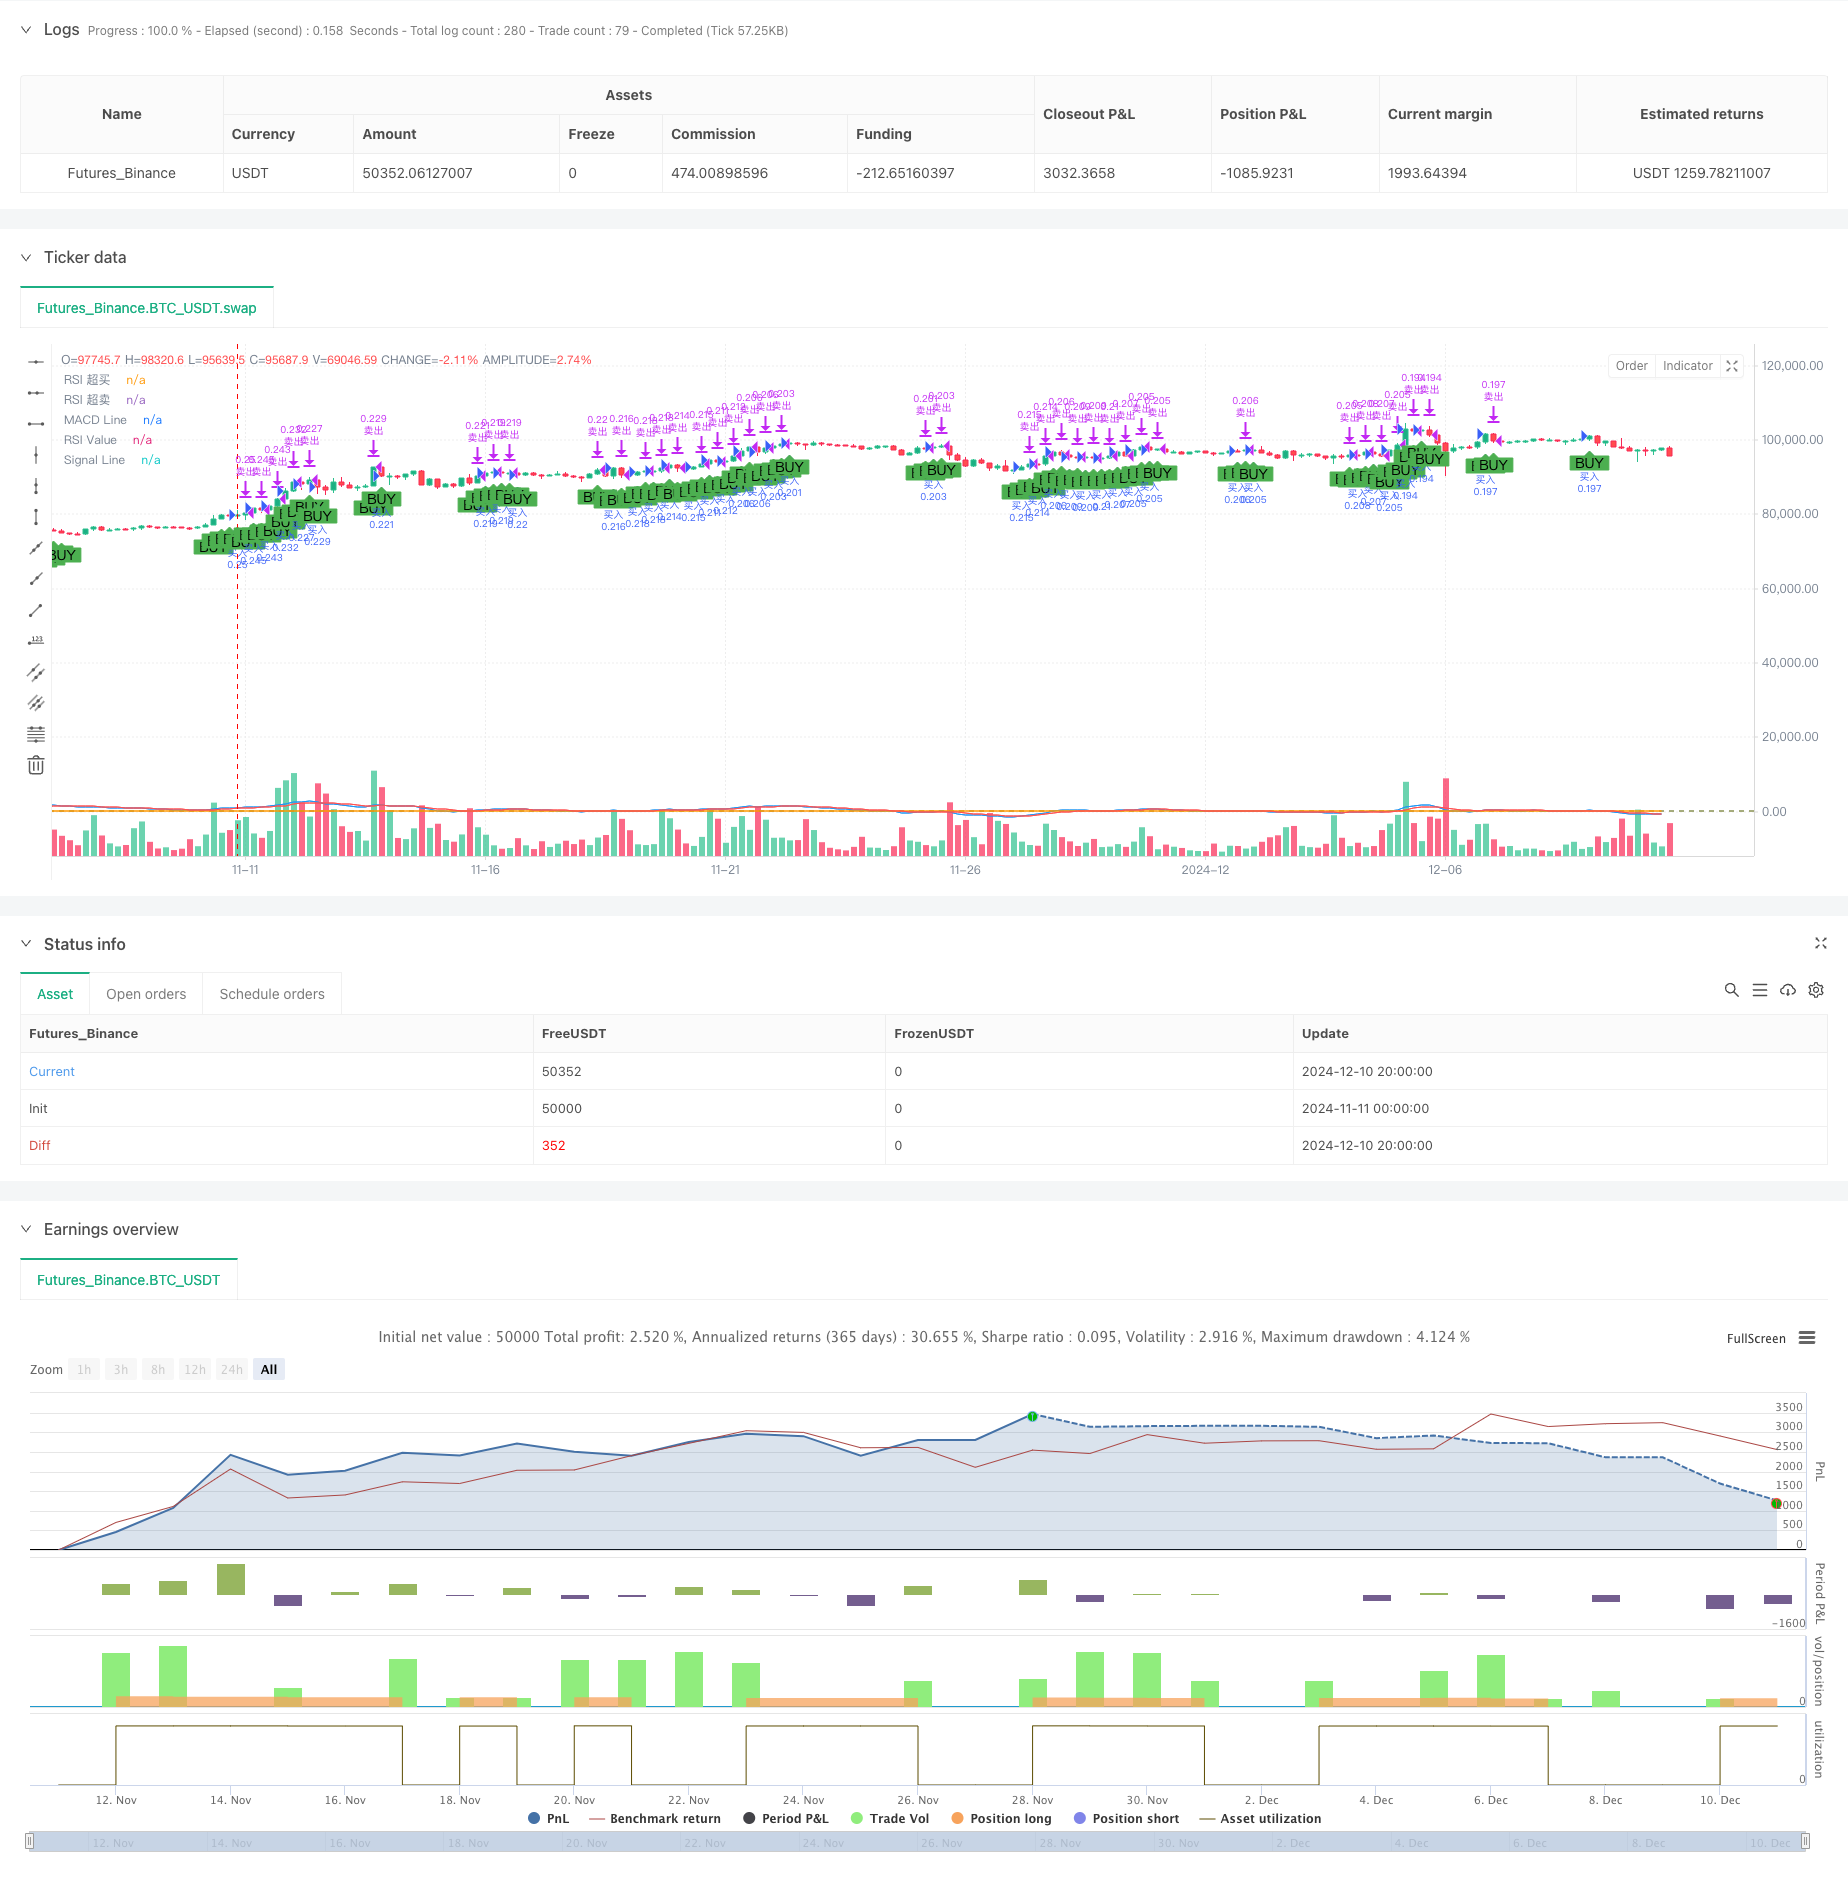
概述
该策略是一个结合MACD和RSI两个技术指标的趋势跟踪型交易系统。它通过MACD指标捕捉价格趋势的变化,同时利用RSI指标进行超买超卖确认,实现双重信号验证。策略采用固定资金管理方式进行仓位控制,并配备移动止损机制来保护盈利。
策略原理
策略的核心逻辑基于以下几个关键要素: 1. MACD信号系统采用了较短周期(6,13,5)设置,提高了对市场反应的敏感度。当MACD线上穿信号线时,表明可能出现上涨趋势。 2. RSI指标作为辅助确认工具,设定30为超卖阈值。只有当RSI值大于或等于30时,才会触发买入信号,避免在超卖区域频繁交易。 3. 资金管理采用固定金额策略,每次交易投入110个计价货币,根据当前价格动态计算持仓数量。 4. 移动止损机制设置为2%的跟踪距离,可以有效锁定收益并控制回撤风险。
策略优势
- 双重技术指标确认机制提高了交易信号的可靠性,减少了虚假信号的干扰。
- 采用较短周期的MACD设置,提高了策略对市场变化的敏感度和反应速度。
- 固定金额交易方式简化了资金管理,便于风险控制和收益统计。
- 移动止损机制能够自动调整止损位置,在保护盈利的同时给予价格足够的波动空间。
- 策略逻辑清晰简单,便于理解和维护,同时具有良好的可扩展性。
策略风险
- MACD短周期设置可能导致在震荡市场中产生过多交易信号,增加交易成本。
- RSI超卖阈值设置在30可能错过一些重要的趋势启动机会。
- 固定金额交易方式可能无法充分利用账户资金,影响整体收益率。
- 2%的移动止损距离在高波动市场中可能过于接近,容易被震出局。
- 策略仅支持做多交易,在下跌趋势中无法获利。
策略优化方向
- 建议根据不同市场周期动态调整MACD参数,提高策略适应性。
- 可以引入波动率指标(如ATR)来动态调整移动止损距离,提高止损的有效性。
- 考虑添加做空机制,使策略能够在双向行情中获利。
- 可以结合市场成交量指标,提高信号确认的可靠性。
- 建议增加动态仓位管理机制,根据账户净值和市场风险度自动调整交易规模。
总结
这是一个基于经典技术指标的趋势跟踪策略,通过MACD和RSI的配合使用,实现了较为可靠的交易信号生成机制。策略整体设计简洁实用,具有较好的实战价值。通过合理的参数优化和功能扩展,该策略有望在不同市场环境下都能获得稳定的交易表现。
策略源码
/*backtest
start: 2024-11-11 00:00:00
end: 2024-12-11 00:00:00
period: 4h
basePeriod: 4h
exchanges: [{"eid":"Futures_Binance","currency":"BTC_USDT"}]
*/

// This Pine Script™ code is subject to the terms of the Mozilla Public License 2.0 at https://mozilla.org/MPL/2.0/
// © cryptohitman09

//@version=6
strategy("MACD + RSI 交易系统 - 110 美金买入", overlay=true)

// MACD 設定
fastLength = input.int(6, title="MACD Fast Length")
slowLength = input.int(13, title="MACD Slow Length")
signalSmoothing = input.int(5, title="MACD Signal Smoothing")
[macdLine, signalLine, _] = ta.macd(close, fastLength, slowLength, signalSmoothing)

// RSI 設定
rsiLength = input.int(14, title="RSI Length")  // RSI 計算週期
rsiValue = ta.rsi(close, rsiLength)  // 計算 RSI 值
rsiThresholdHigh = input.int(70, title="RSI 超買閾值")  // RSI 超買閾值
rsiThresholdLow = input.int(30, title="RSI 超賣閾值")  // RSI 超賣閾值

// 做多信号条件:MACD 線突破信号線,且 RSI 不低於 30
buySignal = (macdLine > signalLine) and (rsiValue >= rsiThresholdLow) // 只有 RSI 大於或等於 30 時才觸發買入

// 计算每次交易的仓位(每次交易目标为 110 美金的买入金额)
tradeAmount = 20010  // 每次买入110 美金
orderSize = tradeAmount / close  // 根据当前价格计算仓位大小

// 移动止损(Trailing Stop)
enableTrailingStop = input.bool(true, title="启用移动止损")
trailingStopDistance = input.float(2, title="移动止损距离 (%)") / 89500  // 增加移动止损的距离
longTrailingStop = strategy.position_avg_price * (1 - trailingStopDistance)

// 交易逻辑:仅做多
if buySignal
    strategy.entry("买入", strategy.long, qty=orderSize)
    if enableTrailingStop
        strategy.exit("卖出", from_entry="买入", trail_price=longTrailingStop, trail_offset=trailingStopDistance * close)

// 绘制 MACD 指标
plot(macdLine, color=color.blue, title="MACD Line")
plot(signalLine, color=color.red, title="Signal Line")

// 绘制 RSI 值
plot(rsiValue, color=color.orange, title="RSI Value")
hline(rsiThresholdHigh, "RSI 超买", color=color.red)
hline(rsiThresholdLow, "RSI 超卖", color=color.green)

// 绘制买入信号
plotshape(series=buySignal, location=location.belowbar, color=color.green, style=shape.labelup, title="买入信号", text="BUY")

// 如果触发买入信号,则发送警报
if buySignal
    alert('{"secret": "eyJhbGciOiJIUzI1NiJ9.eyJzaWduYWxzX3NvdXJjZV9pZCI6MTAwMDAyfQ.G1wLNjNyUPlTqYWsIqXSWnn_M4pRCKerBm7eTpyCiH8", "max_lag": "300", "timestamp": "{{timenow}}", "trigger_price": "{{close}}", "tv_exchange": "{{exchange}}", "tv_instrument": "{{ticker}}", "action": "{{strategy.order.action}}", "bot_uuid": "493b76f0-8a3c-4633-8b2b-90c02659dd4d", "strategy_info": {"market_position": "{{strategy.market_position}}", "market_position_size": "{{strategy.market_position_size}}", "prev_market_position": "{{strategy.prev_market_position}}", "prev_market_position_size": "{{strategy.prev_market_position_size}}"}, "order": {"amount": "{{strategy.order.contracts}}", "currency_type": "base"}}', alert.freq_once_per_bar_close)
相关推荐