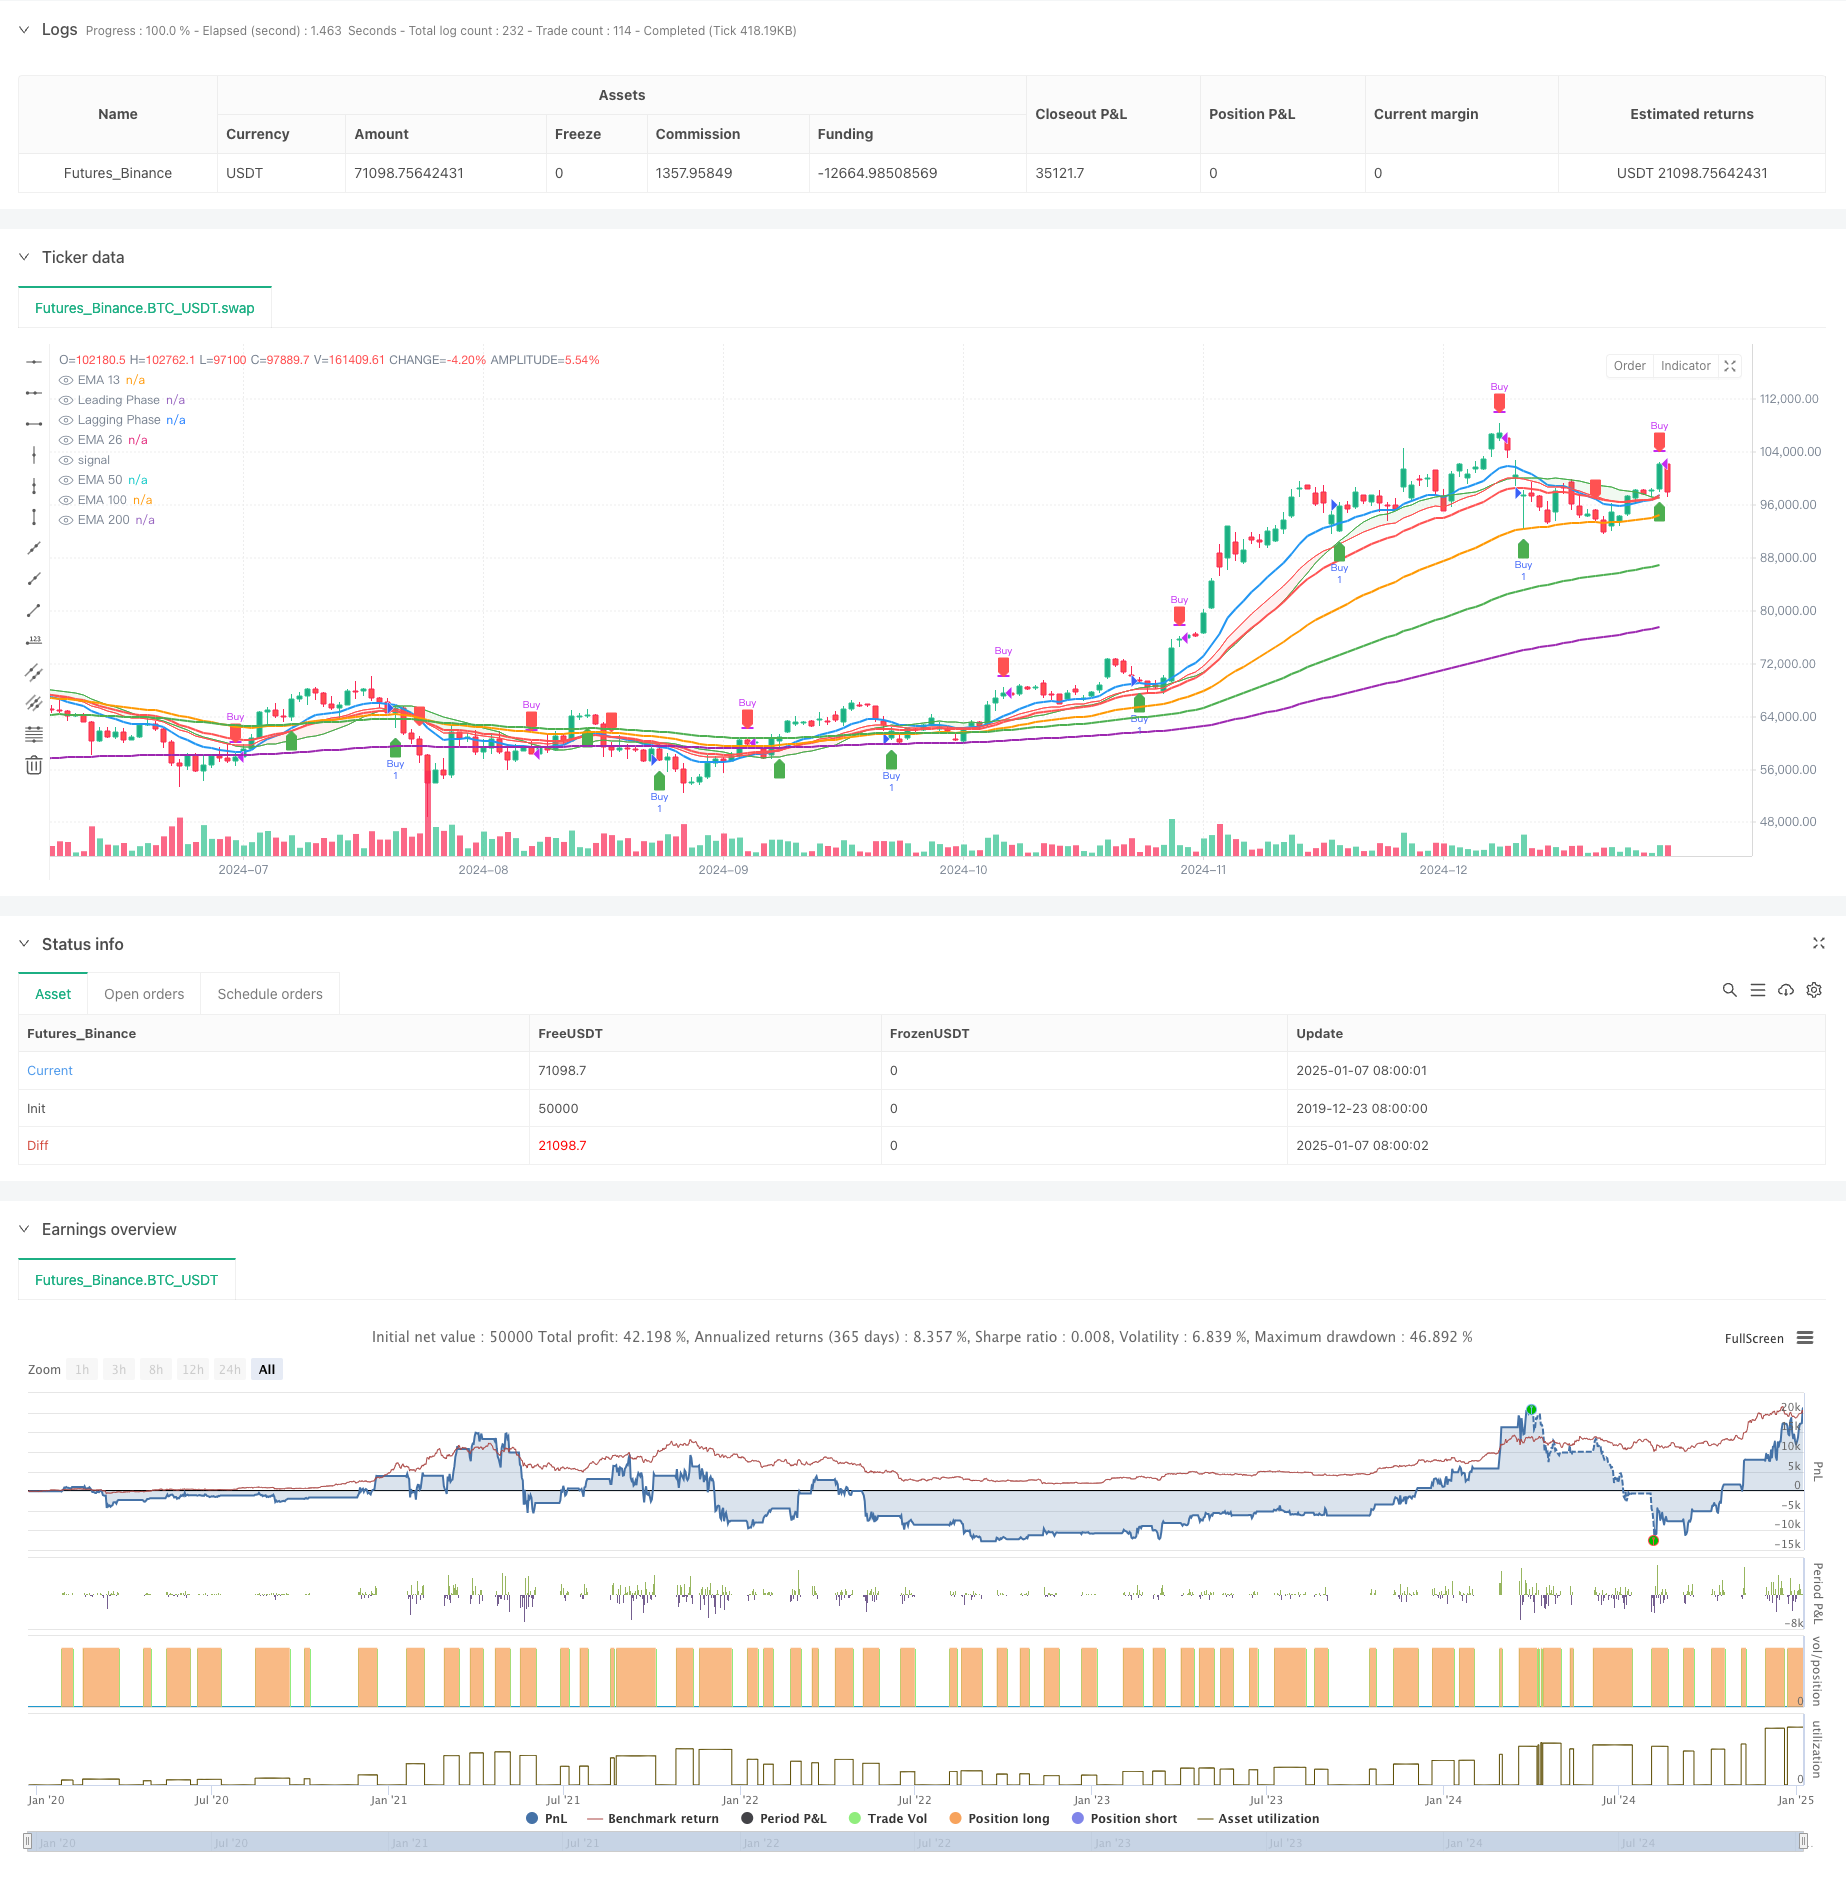
EMA 트렌드 다음 전략과 다기단계 교차
저자:차오장, 날짜: 2025-01-10 15:17:33태그:SMAEMAMA

전반적인 설명
이 전략은 시장 구매 및 판매 기회를 포착하기 위해 단계 크로스오버 신호와 다기 지수 이동 평균을 결합합니다. 트렌드 확인을 위해 13, 26, 50, 100 및 200 기간 EMA를 통합하면서 트렌드 다음 및 단기 거래에 대한 포괄적 인 솔루션을 제공하는 동시에 거래 신호를 생성하기 위해 선도 단계와 후퇴 단계의 크로스오버를 사용합니다.
전략 원칙
핵심 논리는 두 가지 주요 구성 요소로 구성되어 있습니다: 단계 교차 시스템 및 EMA 트렌드 확인 시스템. 단계 교차 시스템에서는 리딩 단계로 상향 오프셋이있는 간단한 이동 평균 (SMA) 과 지연 단계로 하향 오프셋이있는 기하급수적 이동 평균 (EMA) 을 사용합니다. 리딩 단계가 지연 단계 위에 넘어가면 구매 신호가 생성되며, 지연 단계 아래로 넘어가면 판매 신호가 생성됩니다. EMA 트렌드 확인 시스템은 전반적인 시장 추세를 확인하기 위해 여러 기간 (13/26/50/100/200) 기하급수적 이동 평균을 사용하고, 13 및 26 기간 EMA 교차가 2차 거래 신호로 사용됩니다.
전략적 장점
- 완전한 신호 시스템: 단기 단계 교차 신호와 장기 트렌드 확인을 결합하여 잘못된 신호를 효과적으로 필터합니다.
- 강력한 트렌드 추적 능력: 다기기 EMA 시스템을 통해 주요 트렌드 방향을 정확하게 포착합니다.
- 좋은 시각화: 명확한 거래 신호로 상승 및 하락 상태를 식별하기 위해 색상 구역을 사용합니다.
- 강력한 매개 변수 적응성: 다른 시장 특성과 거래 기간에 조정할 수 있습니다.
- 합리적인 위험 통제: 거래 위험을 효과적으로 통제하기 위해 확인을 위한 여러 지표를 결합합니다.
전략 위험
- 오스실레이션 시장 위험: 연립 단계에서 과도한 거래 신호를 생성하여 거래 비용을 증가시킬 수 있습니다.
- 지연 위험: 이동 평균은 본질적으로 지연을 가지고 있으며 최적의 입점 지점을 놓칠 수 있습니다.
- 허위 파업 위험: 높은 시장 변동성 중 허위 파업 신호를 생성할 수 있습니다.
- 매개 변수 민감성: 다른 매개 변수 설정은 전략 성능의 중요한 변동으로 이어질 수 있습니다.
- 시장 환경 의존성: 전략은 트렌딩 시장에서 더 잘 수행되지만 변동 시장에서 성과가 낮습니다.
전략 최적화 방향
- 변동성이 낮은 기간 동안 거래 빈도를 줄이기 위해 변동성 필터를 추가합니다.
- 신호 신뢰성을 향상시키기 위해 부피 확인 지표를 포함합니다.
- 스톱 로스 및 수익 취득 메커니즘을 최적화하고 동적인 스톱 로스 시스템을 구축
- 다른 시장 상태에 대한 전략 매개 변수를 조정하기 위해 시장 환경 분류를 도입
- 동적 전략 최적화를 위한 적응적 매개 변수 시스템을 개발
요약
이 전략은 단계 크로스오버와 다기간의 EMA 시스템을 결합하여 종합적인 트렌드 다음 거래 시스템을 구축합니다. 명확한 신호, 정확한 트렌드 캡처 및 합리적인 리스크 제어 기능을 갖추고 있으며, 또한 특정 지연 및 잘못된 신호 위험을 가지고 있습니다. 변동성 필터와 볼륨 확인 등의 최적화로 전략의 안정성과 신뢰성을 더욱 향상시킬 수 있습니다. 명확하게 트렌딩하는 시장에서 적용하기에 적합하며 거래자는 특정 시장 특성과 개별 위험 선호도에 따라 매개 변수를 조정해야합니다.
/*backtest
start: 2019-12-23 08:00:00
end: 2025-01-08 08:00:00
period: 1d
basePeriod: 1d
exchanges: [{"eid":"Futures_Binance","currency":"BTC_USDT"}]
*/

//@version=5
strategy("Phase Cross Strategy with Zone", overlay=true)

// Inputs
length = input.int(20, title="Smoothing Length")
source = input(close, title="Source")
offset = input.float(0.5, title="Offset Amount", minval=0.0)  // Offset for spacing

// Simulating "Phases" with Smoothed Oscillators
lead_phase = ta.sma(source, length) + offset  // Leading phase with offset
lag_phase = ta.ema(source, length) - offset  // Lagging phase with offset

// Signal Logic
buySignal = ta.crossover(lead_phase, lag_phase)
sellSignal = ta.crossunder(lead_phase, lag_phase)

// Plot Phases (as `plot` objects for `fill`)
lead_plot = plot(lead_phase, color=color.green, title="Leading Phase", linewidth=1)
lag_plot = plot(lag_phase, color=color.red, title="Lagging Phase", linewidth=1)

// Fill Zone Between Phases
fill_color = lead_phase > lag_phase ? color.new(color.green, 90) : color.new(color.red, 90)
fill(plot1=lead_plot, plot2=lag_plot, color=fill_color, title="Phase Zone")

// Plot Buy and Sell Signals
plotshape(buySignal, style=shape.labelup, location=location.belowbar, color=color.new(color.green, 0), title="Buy Signal", size=size.small)
plotshape(sellSignal, style=shape.labeldown, location=location.abovebar, color=color.new(color.red, 0), title="Sell Signal", size=size.small)

// Strategy Entry and Exit
if buySignal
    strategy.entry("Buy", strategy.long)

if sellSignal
    strategy.close("Buy")


//indicator("EMA 13, 26, 50, 100, and 200 with Crossover, Value Zone, and Special Candles", overlay=true)

// Define the EMAs
ema13 = ta.ema(close, 13)
ema26 = ta.ema(close, 26)
ema50 = ta.ema(close, 50)
ema100 = ta.ema(close, 100)
ema200 = ta.ema(close, 200)

// Plot the EMAs
plot(ema13, color=color.blue, linewidth=2, title="EMA 13")
plot(ema26, color=color.red, linewidth=2, title="EMA 26")
plot(ema50, color=color.orange, linewidth=2, title="EMA 50")
plot(ema100, color=color.green, linewidth=2, title="EMA 100")
plot(ema200, color=color.purple, linewidth=2, title="EMA 200")

// Crossover conditions
uptrend = ta.crossover(ema13, ema26)  // EMA 13 crosses above EMA 26 (buy)
downtrend = ta.crossunder(ema13, ema26)  // EMA 13 crosses below EMA 26 (sell)

// Plot buy/sell arrows
plotshape(series=uptrend, location=location.belowbar, color=color.green, style=shape.labelup, size=size.small, title="Buy Signal")
plotshape(series=downtrend, location=location.abovebar, color=color.red, style=shape.labeldown, size=size.small, title="Sell Signal")
- MA, SMA, MA 슬로프, 트래일링 스톱 손실, 재입구
- 부피 분석 적응 전략과 함께 높은 주파수 가격-용량 트렌드
- 다 기간 이동 평균 크로스오버 전략에 따른 동적 경향
- Bollinger Awesome 알렛 R1
- 다이내믹 피보나치 리트랙먼트 거래 전략
- 다단계 피보나치 EMA 트렌드 다음 전략
- RSI 오시슬레이션 전략에 따른 다중 이동 평균 크로스 트렌드
- 풀백 최적화 시스템과 동적 다 기간 기하급수적 이동 평균 크로스 전략
- 동적 파동 트렌드 추적 전략
- 트리플 바닥 리바운드 모멘텀 돌파구 전략
- 피라미드 거래 전략을 따르는 다차원적 경향
- 트리플 바닥 리바운드 모멘텀 돌파구 전략
- 듀얼 타임프레임 트렌드 역전 촛불 패턴 양적 거래 전략
- 부피 분석 적응 전략과 함께 높은 주파수 가격-용량 트렌드
- 증강된 가격-용량 트렌드 동력 전략
- 동적 수익/손실 관리 시스템으로 지능적인 이동 평균 크로스오버 전략
- 적응형 멀티-MA 모멘텀 돌파구 거래 전략
- 적응 동력 평균 역전 크로스오버 전략
- 역 거래 최적화 전략과 함께 적응 가능한 양방향 EMA 트렌드 거래 시스템
- 이중 EMA 풀백 거래 시스템 ATR 기반 동적 스톱 로스 최적화
- RSI 오시슬레이션 전략에 따른 다중 이동 평균 크로스 트렌드
- 변동성 리스크 제어 모델과 함께 다기간의 볼링거 밴드 트렌드 브레이크업 전략
- 동적 지지 및 저항 적응 피브트 거래 전략
- 이중 EMA-RSI 격차 전략: 기하급수적인 이동 평균과 상대적 강도에 기초한 트렌드 캡처 시스템
- 다기간의 슈퍼트렌드 다이내믹 피라미딩 거래 전략
- 장기 트렌드 SMA 크로스오버 양적 전략
- 양적 거래 전략에 따른 다기술 지표 융합 추세
- 다기술 지표 모멘텀-MA 트렌드 전략
- 스마트 R2R 기반의 스톱 로스 관리와 함께 트리플 EMA 크로스오버 거래 시스템
- 동적 변동성 원동 고주파 EMA 크로스오버 양적 전략