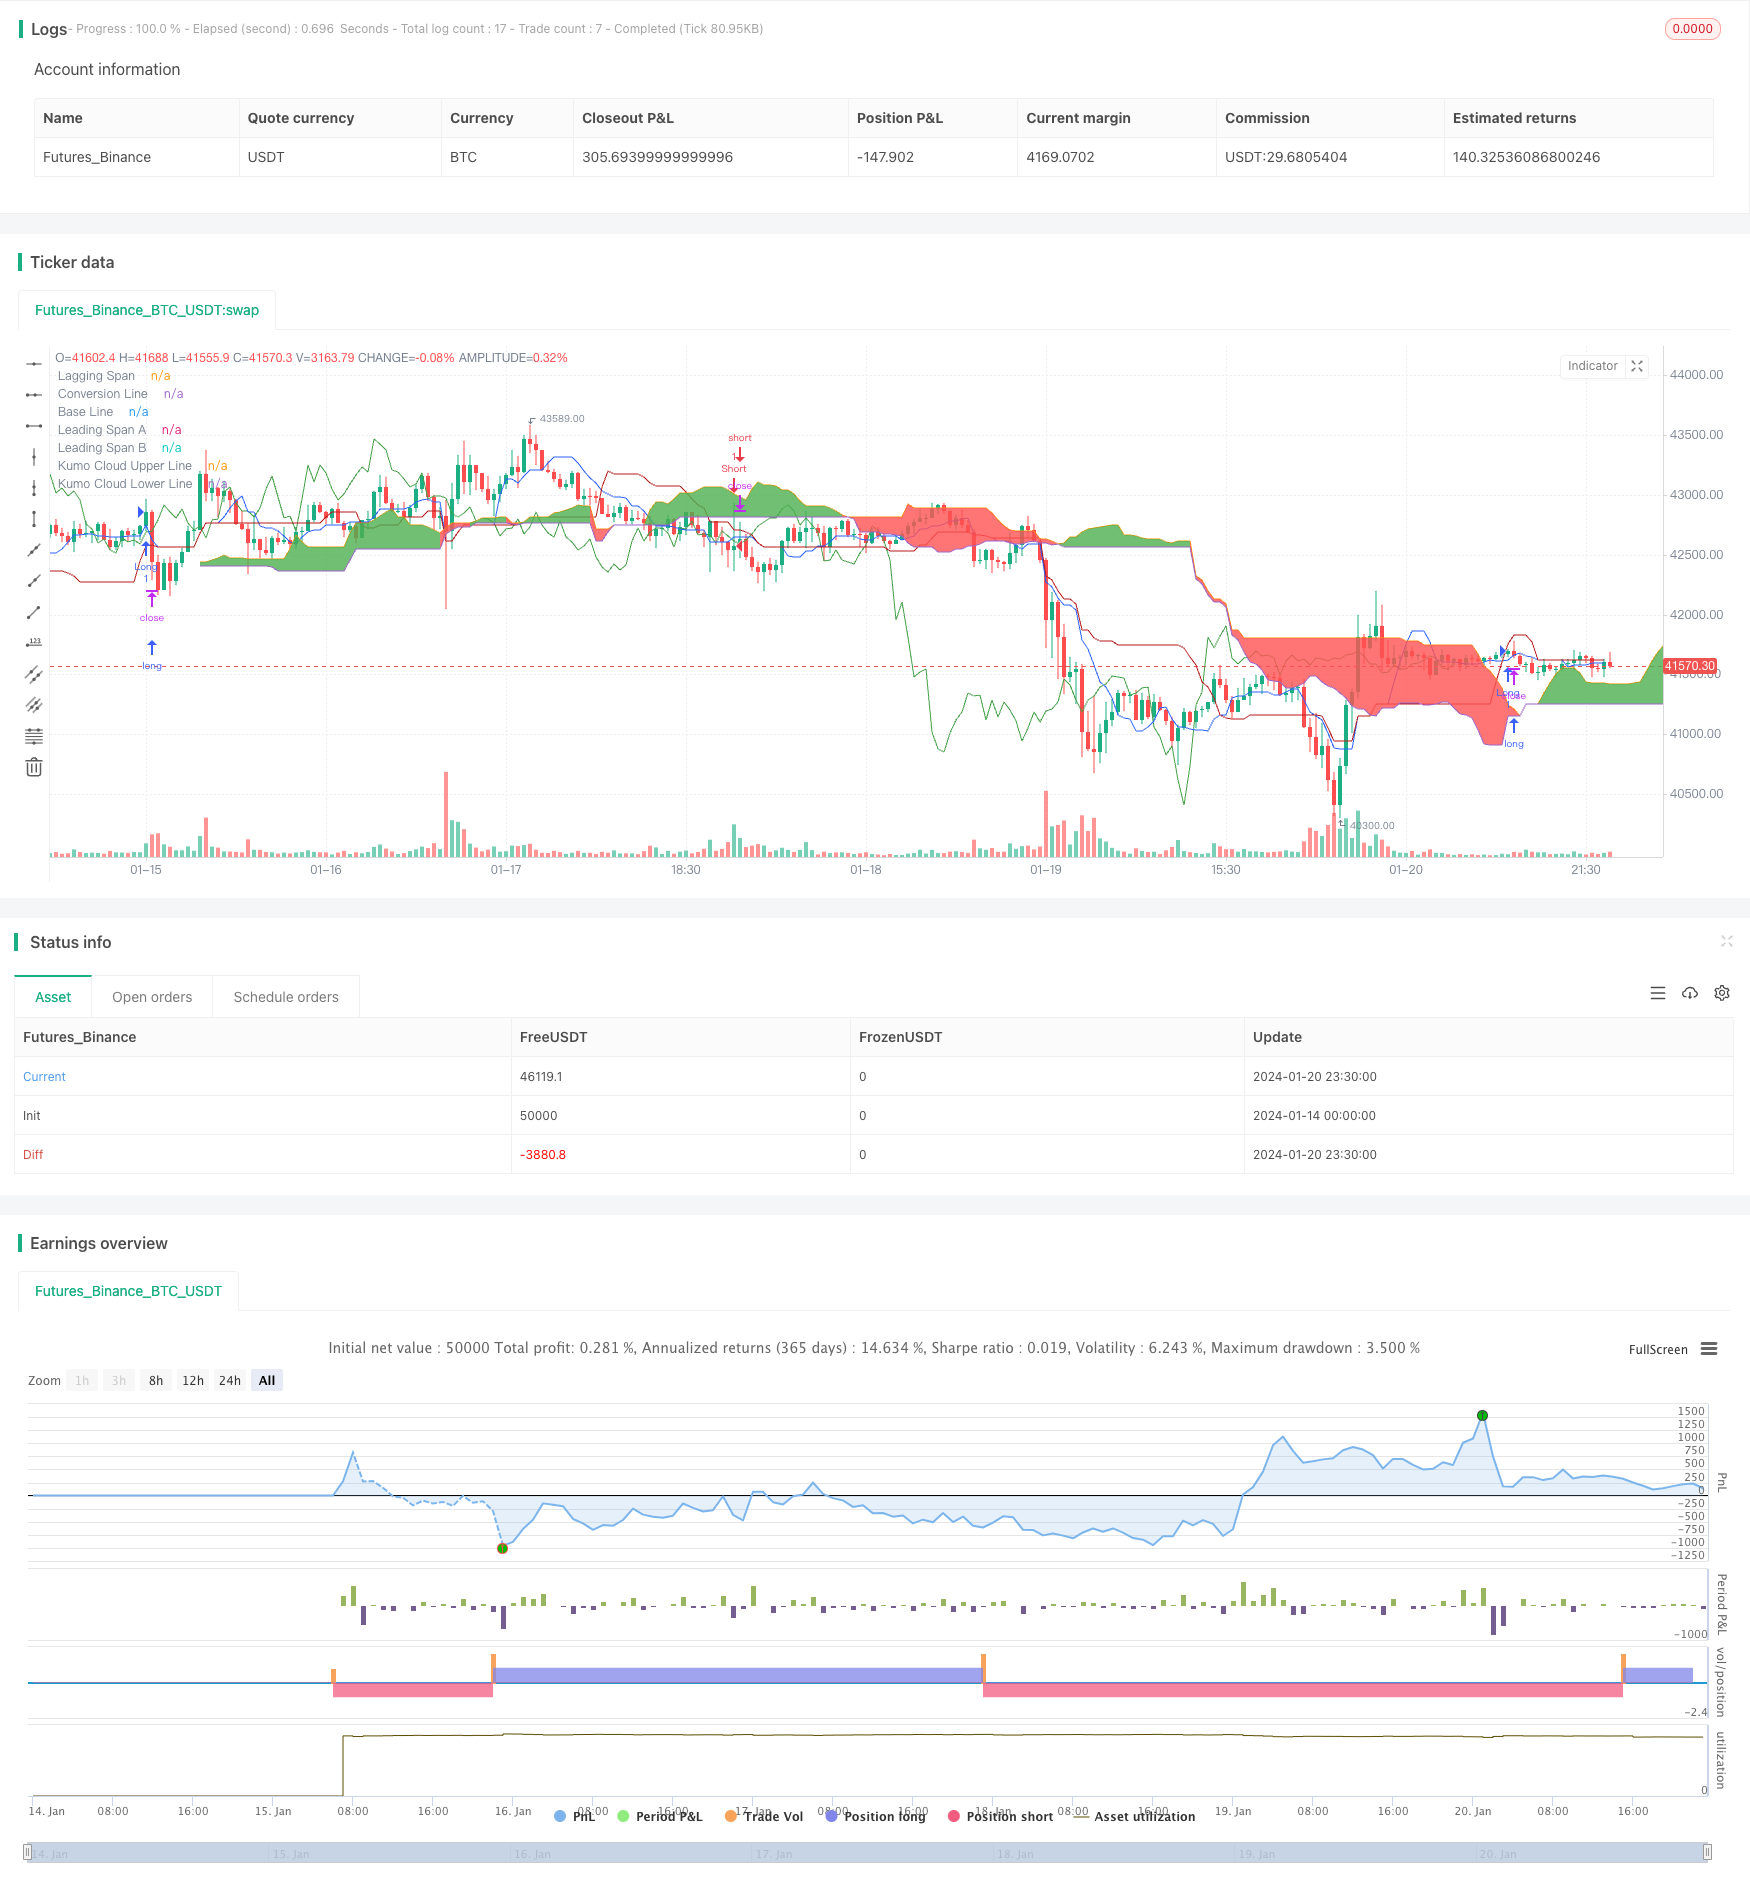
Strategi pokok keputusan berbilang penunjuk: IMACD, EMA dan Tabel Keseimbangan Pertama

Ringkasan
Strategi ini menggunakan pelbagai penunjuk teknikal, seperti IMACD, EMA dan First Equilibrium Table, untuk membina model pokok keputusan yang komprehensif untuk menghantar isyarat beli dan jual.
Prinsip-prinsip strategi
- IMACD: Enhanced MACD, untuk menangkap lebih baik trend pasaran dengan ImpulseMACD dan ImpulseHisto
- Jadual keseimbangan pertama: Menggambar garis pertukaran, garis rujukan, garis pendahulu A, garis pendahulu B, dan lain-lain, mengesan tahap sokongan dan rintangan
- EMA 40: membantu menentukan arah trend
- Menerbitkan isyarat banyak dan kosong berdasarkan hubungan tertentu antara IMACD, komponen grafik awan dan EMA 40
Melakukan lebih banyak isyarat: Melakukan lebih banyak apabila IMACD adalah warna untuk keadaan tertentu dan EMA 40 lebih tinggi daripada grafik awan
Isyarat kosong: kosong apabila IMACD berwarna merah dan EMA 40 di bawah garis bawah carta awan
Analisis Kelebihan
- Gabungan pelbagai penunjuk, penilaian keseluruhan terhadap trend pasaran, peningkatan ketepatan keputusan
- Model pokok keputusan dikategorikan dengan jelas, isyarat transaksi dihasilkan dengan jelas
- Panjang EMA boleh diselaraskan, fleksibiliti penilaian tambahan lebih tinggi
- Menggabungkan carta awan dan penunjuk trend untuk mengenal pasti sokongan dan rintangan yang lebih baik
Analisis risiko
- Kombinasi pelbagai penunjuk, parameter yang lebih rumit
- EMA yang tidak betul, boleh menyebabkan isyarat perdagangan palsu
- Perhatian terhadap beberapa indikator pada masa yang sama adalah sukar untuk dioperasikan.
Penyelesaian risiko: mengoptimumkan tetapan parameter, menyesuaikan panjang EMA, menyederhanakan proses operasi.
Arah pengoptimuman
- Mengoptimumkan tetapan parameter untuk meningkatkan kestabilan strategi
- Menambah strategi menghentikan kerugian untuk mengawal kerugian tunggal
- Pengukuran semula berdasarkan data besar untuk meningkatkan kualiti isyarat
- Menggabungkan algoritma pembelajaran mesin untuk membina pokok keputusan adaptif
Ringkasan
Strategi ini menggunakan pelbagai trend pengenalan penunjuk untuk membina model pokok keputusan untuk menghasilkan isyarat dagangan. Kelebihan adalah kualiti isyarat yang tinggi, ketepatan yang tinggi dan sesuai untuk pengoptimuman secara beransur-ansur. Perlu memberi tumpuan kepada pengoptimuman parameter dan strategi stop loss untuk mengawal risiko dagangan untuk mendapatkan pulangan yang stabil dalam jangka panjang.
                    /*backtest
start: 2024-01-14 00:00:00
end: 2024-01-21 00:00:00
period: 30m
basePeriod: 15m
exchanges: [{"eid":"Futures_Binance","currency":"BTC_USDT"}]
*/

//@version=5
strategy("Decision Tree Strategy: IMACD, EMA and Ichimoku [cryptoonchain]", overlay=true)

lengthMA = input(34, title="Length MA")
lengthSignal = input(9, title="Length Signal")
conversionPeriods = input.int(9, minval=1, title="Conversion Line Length")
basePeriods = input.int(26, minval=1, title="Base Line Length")
laggingSpan2Periods = input.int(52, minval=1, title="Leading Span B Length")
displacement = input.int(26, minval=1, title="Lagging Span")
emaLength = input(40, title="EMA Length")  // Added user-configurable EMA length

calc_smma(src, len) =>
    smma = float(na)
    smma := na(smma[1]) ? ta.sma(src, len) : (smma[1] * (len - 1) + src) / len
    smma

calc_zlema(src, length) =>
    ema1 = ta.ema(src, length)
    ema2 = ta.ema(ema1, length)
    d = ema1 - ema2
    ema1 + d

src = ohlc4
hi = calc_smma(high, lengthMA)
lo = calc_smma(low, lengthMA)
mi = calc_zlema(src, lengthMA)

md = (mi > hi) ? (mi - hi) : (mi < lo) ? (mi - lo) : 0
sb = ta.sma(md, lengthSignal)
sh = md - sb
mdc = src > mi ? (src > hi ? color.rgb(128, 255, 0, 26) : color.green) : (src < lo ? color.red : color.orange)

colorCondition = color.rgb(128, 255, 0, 26)

conversionLine = math.avg(ta.lowest(conversionPeriods), ta.highest(conversionPeriods))
baseLine = math.avg(ta.lowest(basePeriods), ta.highest(basePeriods))
leadLine1 = math.avg(conversionLine, baseLine)
leadLine2 = math.avg(ta.lowest(laggingSpan2Periods), ta.highest(laggingSpan2Periods))

// Use user-configurable length for EMA
ema40 = ta.ema(close, emaLength)

ebc = input(false, title="Enable bar colors")
barcolor(ebc ? mdc : na)

conversionLinePlot = plot(conversionLine, color=#2962FF, title="Conversion Line", display=display.none)
baseLinePlot = plot(baseLine, color=#B71C1C, title="Base Line", display=display.none)
laggingSpanPlot = plot(close, offset=-displacement + 1, color=#43A047, title="Lagging Span", display=display.none)
leadLine1Plot = plot(leadLine1, offset=displacement - 1, color=#A5D6A7, title="Leading Span A", display=display.none)
leadLine2Plot = plot(leadLine2, offset=displacement - 1, color=#EF9A9A, title="Leading Span B", display=display.none)
kumoCloudUpperLinePlot = plot(leadLine1 > leadLine2 ? leadLine1 : leadLine2, offset=displacement - 1, title="Kumo Cloud Upper Line", display=display.none)
kumoCloudLowerLinePlot = plot(leadLine1 < leadLine2 ? leadLine1 : leadLine2, offset=displacement - 1, title="Kumo Cloud Lower Line", display=display.none)
fill(kumoCloudUpperLinePlot, kumoCloudLowerLinePlot, color=leadLine1 > leadLine2 ? color.green : color.red)

a = (leadLine1 > leadLine2 ? leadLine1 : leadLine2)
b = (leadLine1 < leadLine2 ? leadLine1 : leadLine2)

if mdc == colorCondition and ema40 > a[displacement - 1]
    strategy.entry("Long", strategy.long)

if mdc == color.red and ema40 < b[displacement - 1]
    strategy.entry("Short", strategy.short)
- Strategi perdagangan dinamik berdasarkan indikator QQE
- Strategi Ramalan Gelombang Tinggi
- Strategi pengukuran EMAS yang dinamik
- Donchian Tunnel Trend Tracking Strategi
- Strategi Peningkatan Rata-Rata
- Strategi persimpangan rata-rata bergerak untuk menangkap perubahan trend dengan tepat
- Strategi pelbagai trend
- Strategi perdagangan campuran
- Strategi pengesanan trend berdasarkan perbezaan harga
- RSI berlawanan dengan strategi dagangan
- MACD dua arah untuk mengoptimumkan strategi perdagangan
- Strategi algoritma silang emas EMA berganda
- Strategi dagangan jangka masa berbilang berdasarkan RSI dan purata
- Strategi dagangan yang mempengaruhi garis pusingan
- Strategi dagangan MACD berdasarkan EVWMA
- Strategi Kembali Berkembang Berdasarkan Saluran Blinken
- Strategi pengukuran trend yang disatukan dengan pelbagai penunjuk teknologi
- RSI digabungkan dengan CCI untuk strategi dagangan kuantitatif
- Strategi perdagangan trend DCA berisiko rendah
- Strategi perdagangan kuantitatif terhadap indikator yang lemah dan kuat