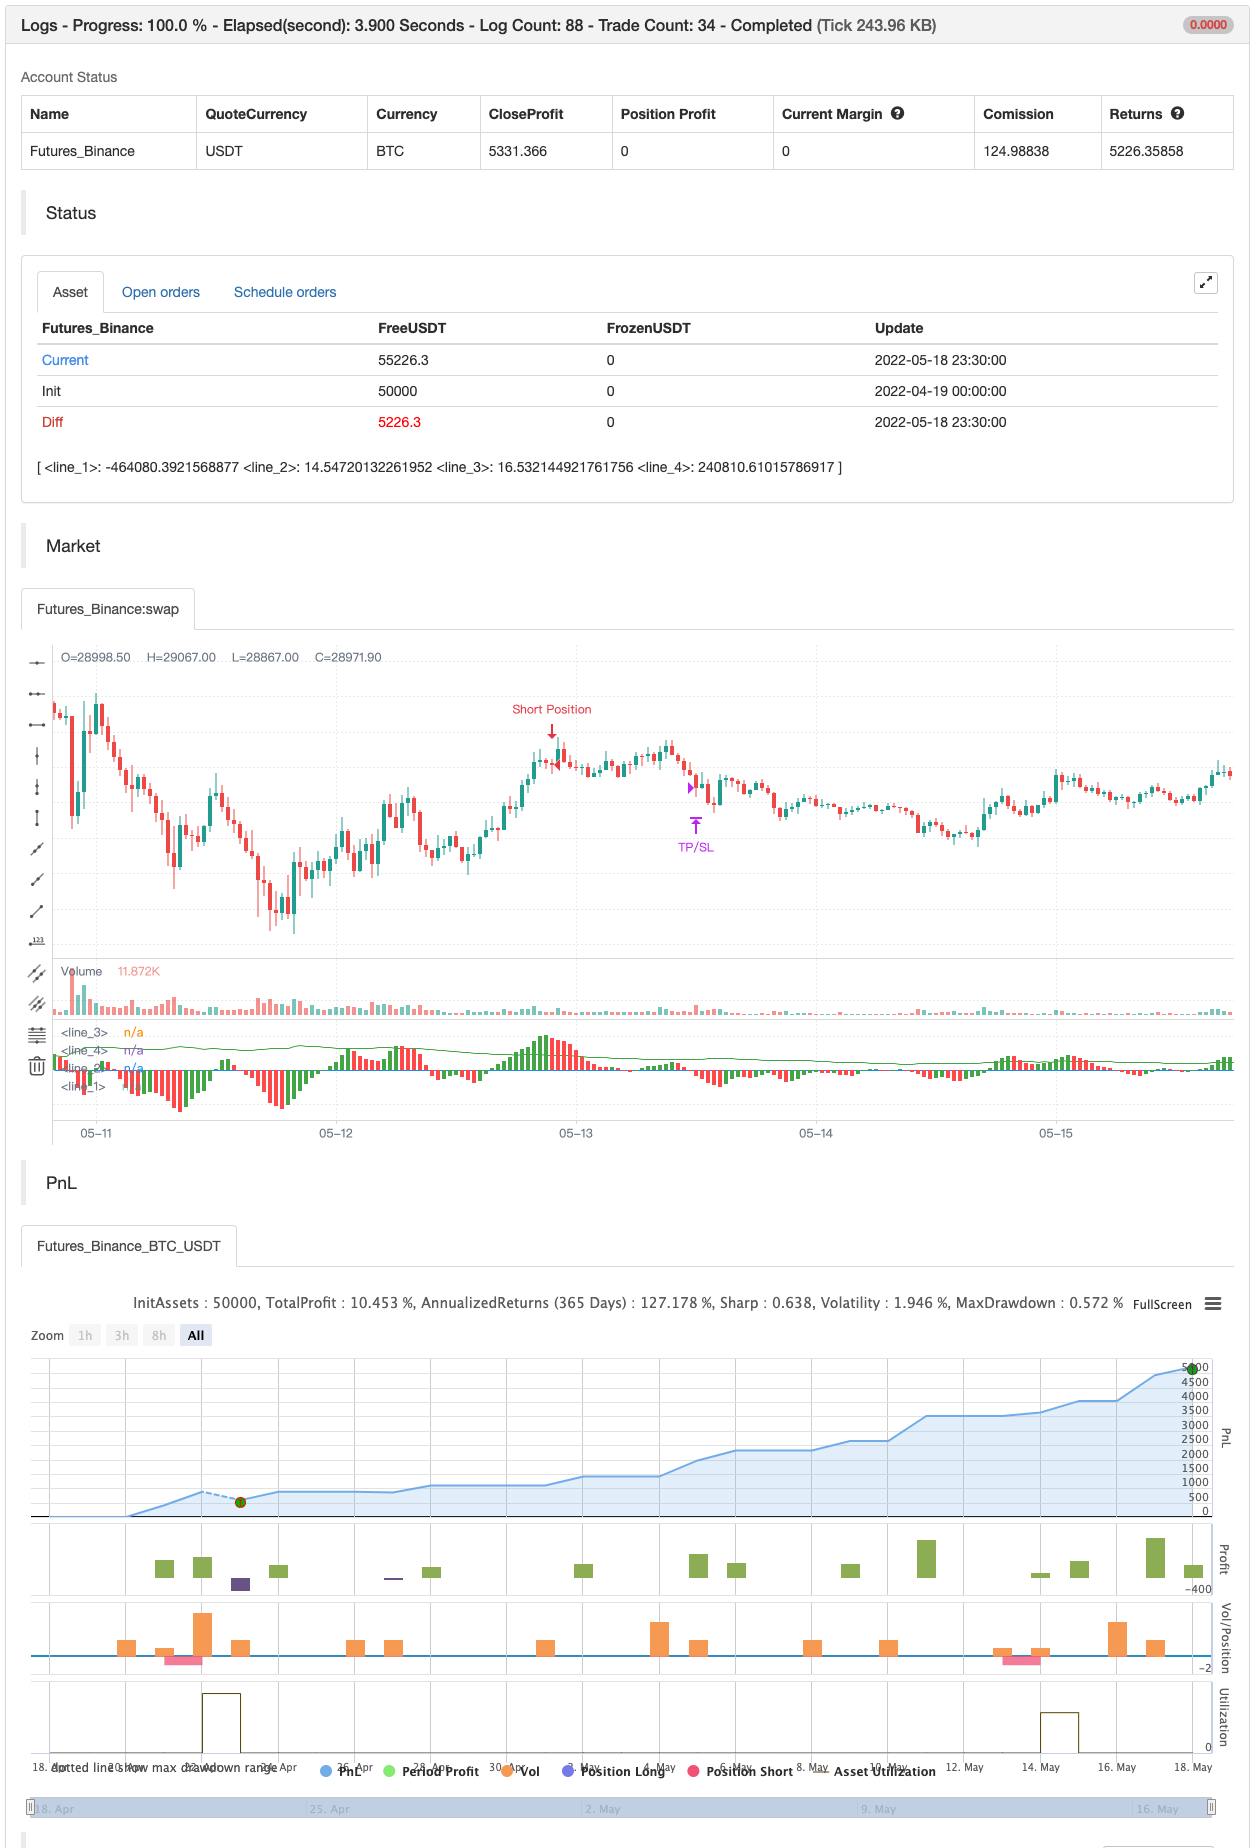
A estratégia de compra e venda depende de AO+Stoch+RSI+ATR
Autora:ChaoZhang, Data: 2022-05-20 15:52:46Tags:RSIATRSTOCHSMA
Esta estratégia é apenas para treinamento, seu propósito é apenas aprender código em pinho script. Não tome decisões de compra ou venda com esta estratégia.
Turco/Turquia Esta estratégia é apenas um script de código para o que podemos fazer. Esta estratégia dura, definitivamente o Al-Sat islemleri yapmayin.
Como é que funciona?
Quando o RSI e o Stoch estão na área de sobrevenda e se o osc. for positivo, tome uma posição longa.
Quando o RSI e o Stoch estão sobrecomprados e se o osc. for negativo, tome posição curta.
Turco/Turquia
O RSI e o Stoch asiri satım bölgesinde iken awesome positive döner is long position açar, zarar kes ve kar al nivelileri ATR indicador ile tanımlandı.
O RSI e o índice de mercado de ações regionais estão em uma posição negativa, e o nível do indicador ATR está definido.
backtest

/*backtest
start: 2022-04-19 00:00:00
end: 2022-05-18 23:59:00
period: 30m
basePeriod: 15m
exchanges: [{"eid":"Futures_Binance","currency":"BTC_USDT"}]
*/

//@version=4

strategy("Buy&Sell Strategy depends on AO+Stoch+RSI+ATR by SerdarYILMAZ", shorttitle="Buy&Sell Strategy")
// Created by Serdar YILMAZ
// This strategy is just for training, its purpose is just learning code in pine script.
// Don't make buy or sell decision with this strategy.
// Bu strateji sadece pine script'te kodlamanın nasıl yapildigini ogrenmek icindir.
// Bu stratejiye dayanarak, kesinlikle al-sat islemleri yapmayin.

//AO

fast=input(title="Fast Length",type=input.integer,defval=3)
slow=input(title="Slow length",type=input.integer,defval=17)

awesome=(sma(hl2,fast)-sma(hl2,slow))*1000

plot(awesome, style=plot.style_histogram, color=(awesome>awesome[1]?color.green:color.red))

//Stoch

K=input(title="K",type=input.integer,defval=14)
D=input(title="D",type=input.integer,defval=3)
smooth=input(title="smooth",type=input.integer,defval=3)

k=sma(stoch(close,high,low,K),D)
d=sma(k,smooth)

hline(80)
hline(20)

plot(k,color=color.blue)

//RSI

rsisource=input(title="rsi source",type=input.source,defval=low)
rsilength=input(title="rsi length",type=input.integer,defval=10)

rsi=rsi(rsisource,rsilength)

hline(70,color=color.orange)
hline(30,color=color.orange)

plot(rsi,color=color.orange)

//ATR

atrlen=input(title="ATR Length", type=input.integer,defval=14)

atrvalue=rma(tr,atrlen)

plot(atrvalue*1000,color=color.green)

LongCondition=k<20 and rsi<30 and awesome>awesome[1]
ShortCondition=k>80 and rsi>70 and awesome<awesome[1]
if (LongCondition)
    stoploss=low-atrvalue
    takeprofit=close+atrvalue
    strategy.entry("Long Position", strategy.long)
    strategy.exit("TP/SL",stop=stoploss,limit=takeprofit)

if (ShortCondition)
    stoploss=high+atrvalue
    takeprofit=close-atrvalue
    strategy.entry("Short Position",strategy.short)
    strategy.exit("TP/SL",stop=stoploss,limit=takeprofit)
- Estratégia de pirâmide inteligente de múltiplos indicadores
- Mudança da média de cruzamento com estratégia de stop loss
- Tendência dinâmica Seguindo uma estratégia com aprendizagem automática e gestão de riscos melhorada
- RSI Dinâmica Estratégia de negociação inteligente stop-loss
- Estratégia de negociação quantitativa de curto prazo baseada em indicadores de crossover de média móvel dupla, RSI e estocásticos
- Estratégia de ruptura de RSI e Bollinger Bands de alta precisão com relação risco-retorno otimizada
- Estratégia de impulso do RSI cruzado de média móvel dupla com sistema de otimização risco-recompensa
- O valor da posição de referência deve ser calculado de acordo com o método de classificação do mercado.
- Tendência de adaptação dinâmica de vários fatores
- Estratégia de negociação equilibrada de rotação longa-curta baseada no tempo
- Scalping horário de futuros de criptomoedas com ma & rsi - ogcheckers
- ATR suavizado
- Buscador de blocos de ordem
- TendênciaScalp-FractalBox-3EMA
- Sinais QQE
- Filtragem de amplitude de grelha de bits U
- Indicador MACD personalizado CM - Quadro de tempo múltiplo - V2
- LÍNIA HODL
- 2 Detecção da direção da média móvel de cores
- Instrumento de recuperação de scalping R1
- EMA TREND CLOUD
- RedK Relação volume-aceleração da energia direcional
- Donchian Breakout sem pintura
- Barras de Momento RedK
- SuperJump Volta para trás Banda de Bollinger
- Tendência Fukuiz
- O BOT do Johnny.
- SSL híbrido
- Saída do candelabro
- RISOTTO