概述
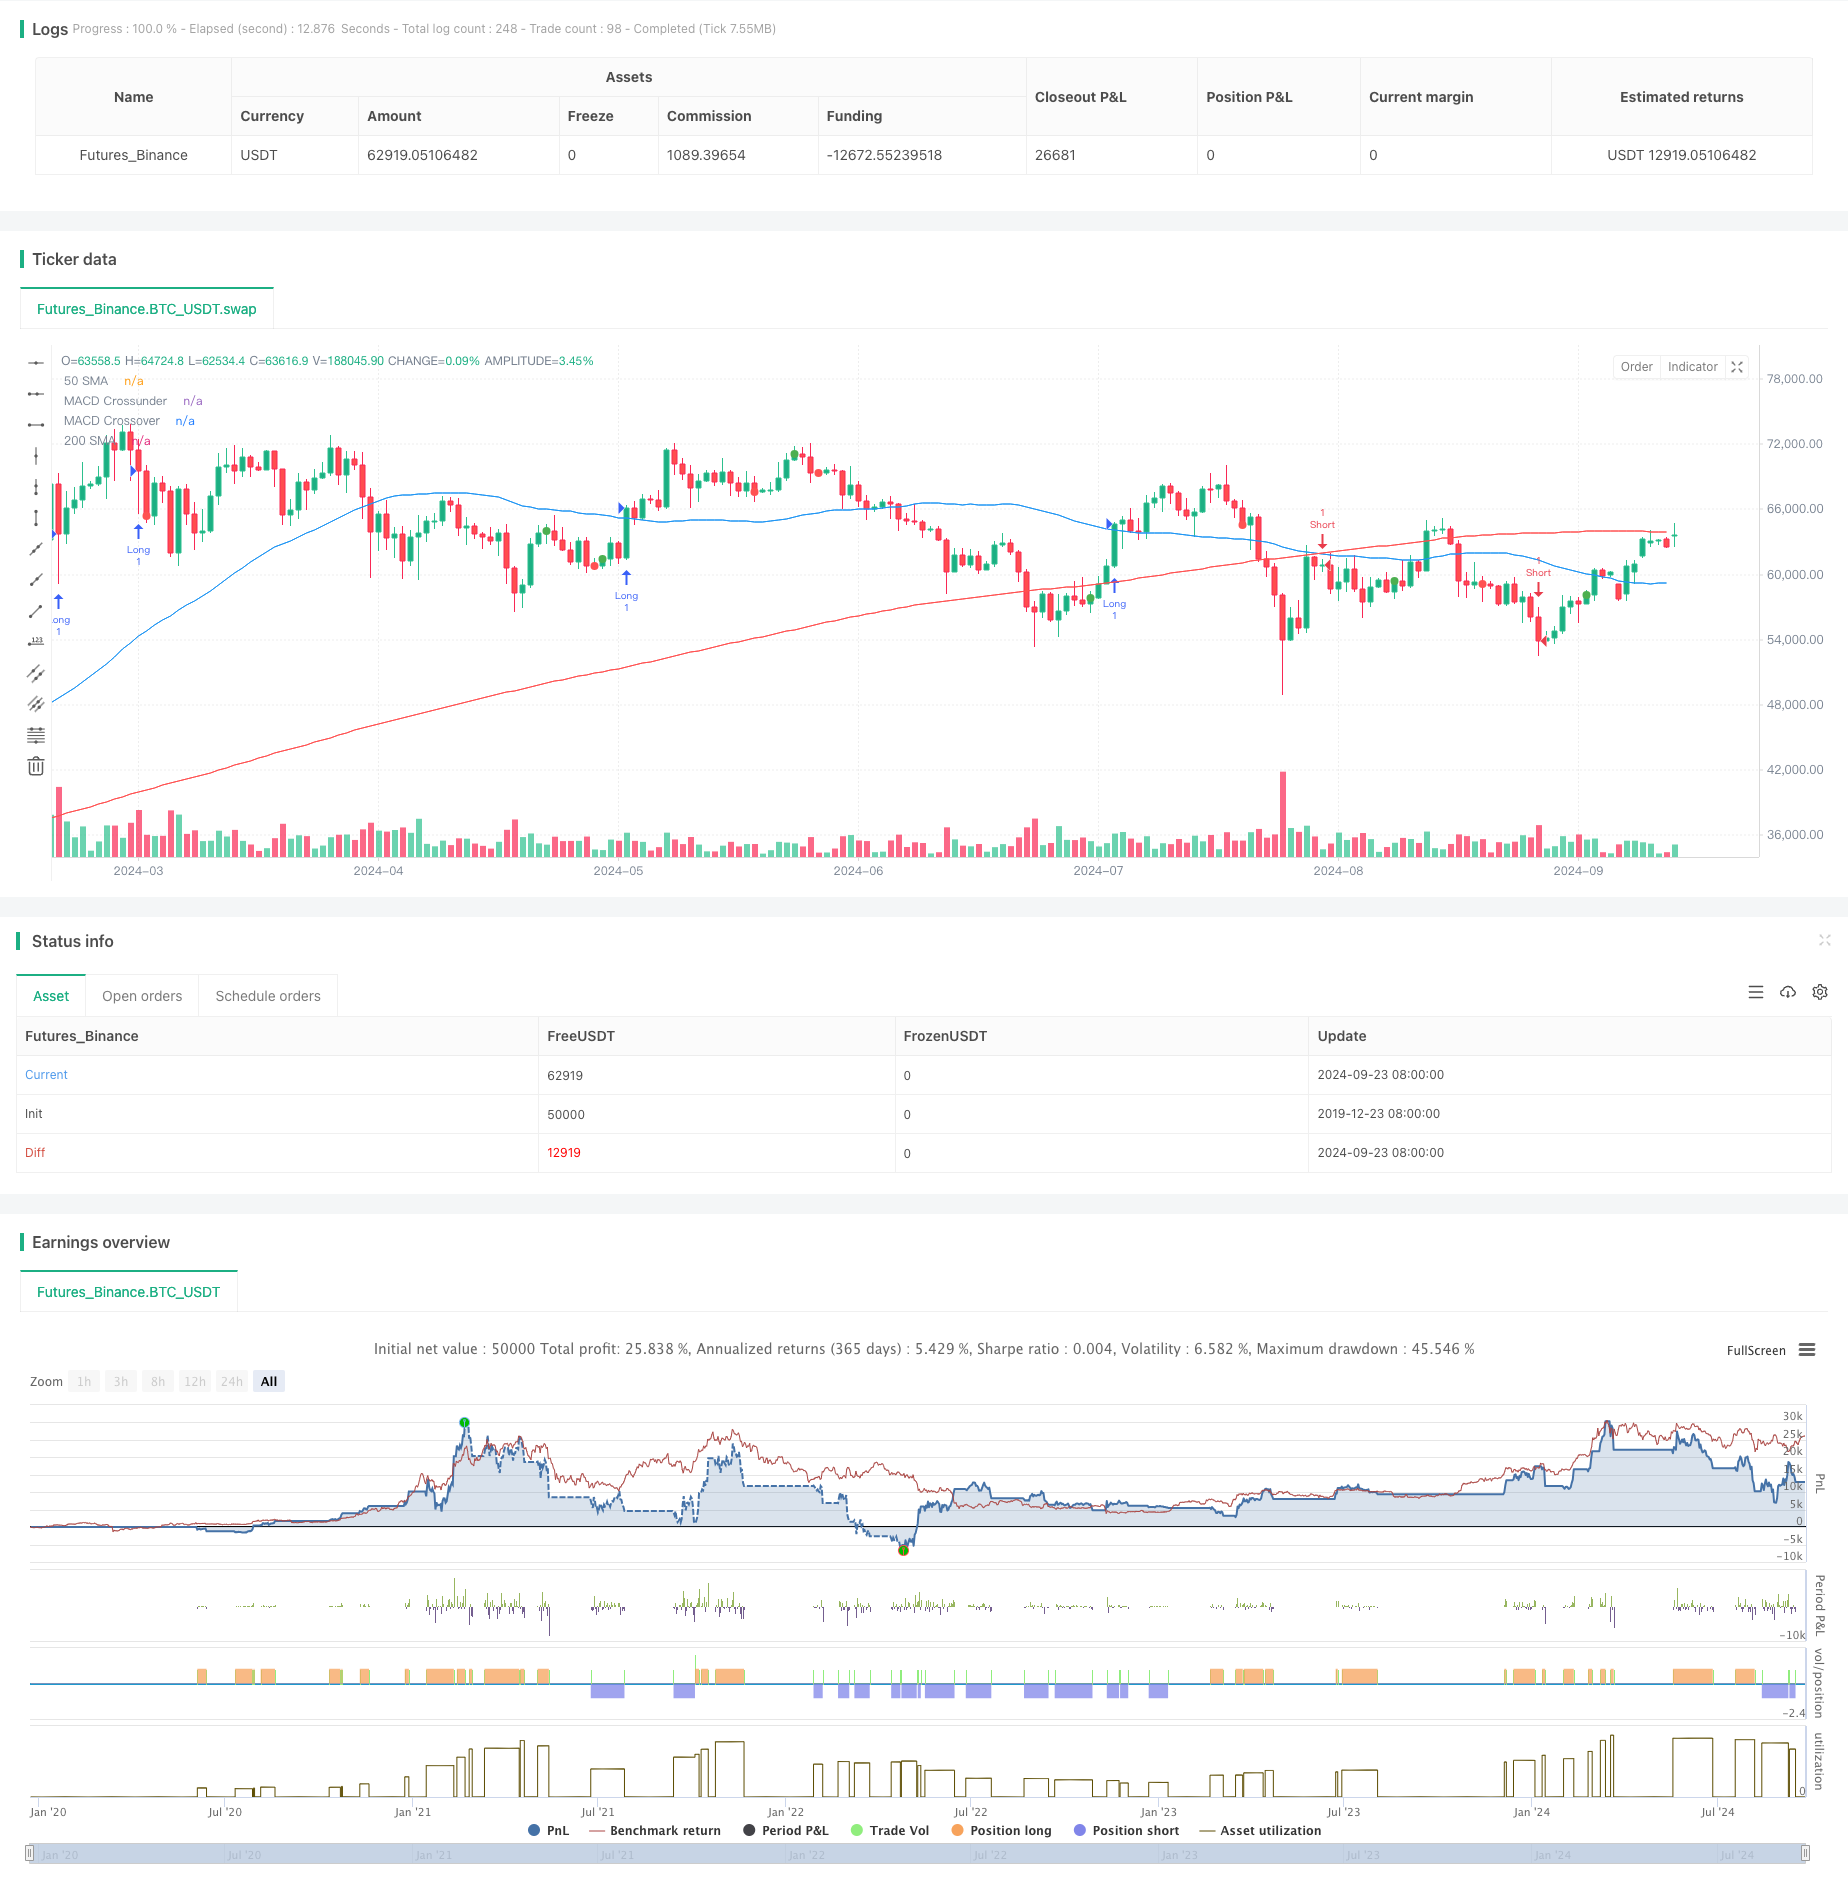
多因子动态适应型趋势跟踪策略是一种结合多个技术指标的系统化交易方法。该策略利用移动平均线收敛散度指标(MACD)、相对强弱指标(RSI)、平均真实波幅(ATR)和简单移动平均线(SMA)等多个指标,以捕捉市场趋势并优化入场和出场时机。策略通过多重指标确认来提高交易成功率,同时运用动态止损和获利方法来适应不同市场环境,实现风险管理与收益最大化的平衡。
策略原理
该策略的核心原理是通过多个技术指标的协同作用来识别和确认市场趋势。具体来说:
- 使用MACD指标的金叉和死叉来捕捉潜在的趋势转折点。
- 利用RSI指标来确认价格动量,避免在过度买入或卖出的情况下入场。
- 采用50日和200日SMA的位置关系来判断整体市场趋势。
- 应用ATR指标动态设置止损和获利水平,以适应市场波动性。
策略在满足以下条件时开仓做多:MACD线上穿信号线、RSI低于70、价格位于50日SMA之上且50日SMA高于200日SMA。相反的条件则触发做空信号。策略使用2倍ATR作为止损,3倍ATR作为获利目标,确保了1:1.5的风险收益比。
策略优势
- 多维度确认:通过结合多个指标,策略能够更全面地评估市场状况,降低假信号的影响。
- 动态风险管理:利用ATR动态调整止损和获利水平,使策略能够适应不同的市场波动环境。
- 趋势跟踪与动量结合:策略既考虑了长期趋势(通过SMA),又关注短期动量(通过MACD和RSI),有助于捕捉持续性强的趋势。
- 系统化决策:明确的入场和出场规则减少了主观判断,有利于保持交易纪律。
- 灵活性:策略参数可根据不同市场和交易品种进行调整,具有较强的适应性。
策略风险
- 震荡市场表现欠佳:在没有明显趋势的市场中,策略可能频繁产生虚假信号,导致交易成本增加。
- 滞后性:由于使用了移动平均线等滞后指标,策略可能在趋势初期错过部分机会。
- 过度依赖技术指标:忽视了基本面因素,可能在重大事件或新闻发布时作出错误判断。
- 参数敏感性:策略性能可能对指标参数设置较为敏感,需要定期优化以适应市场变化。
- 回撤风险:在剧烈行情反转时,2倍ATR的止损设置可能不足以有效控制风险。
策略优化方向
- 引入波动率过滤:可考虑在低波动率环境下暂停交易,以减少震荡市场中的虚假信号。
- 整合基本面因素:结合经济数据发布、公司财报等信息,提高策略的全面性。
- 优化指标组合:可尝试引入其他指标如布林带、Ichimoku云图等,以增强策略的稳健性。
- 实现自适应参数:开发机器学习模型,根据市场状况动态调整指标参数。
- 细化市场状态分类:区分不同的市场环境(如趋势、区间、高波动等),针对性地调整策略参数。
- 增加时间框架分析:结合多个时间周期的信号,提高交易决策的准确性。
总结
多因子动态适应型趋势跟踪策略通过整合多个技术指标,为交易者提供了一个系统化、可量化的交易方法。该策略在趋势明确的市场中表现出色,能够有效捕捉中长期行情。其动态风险管理机制和多维度信号确认过程有助于提高交易的稳定性和可靠性。然而,策略也存在一些局限性,如在震荡市场中的表现和对技术指标的过度依赖等。通过持续优化和引入更多元的分析维度,该策略有潜力成为一个更加全面和稳健的交易系统。交易者在使用此策略时,需要根据具体市场特征和个人风险偏好进行适当的参数调整和回测,以实现最佳的交易效果。
策略源码
/*backtest
start: 2019-12-23 08:00:00
end: 2024-09-24 08:00:00
period: 1d
basePeriod: 1d
exchanges: [{"eid":"Futures_Binance","currency":"BTC_USDT"}]
*/

//@version=5
strategy("Multi-Factor Hedge Fund Strategy", overlay=true)

// Input parameters
fastLength = input(12, "MACD Fast Length")
slowLength = input(26, "MACD Slow Length")
signalLength = input(9, "MACD Signal Length")
rsiLength = input(14, "RSI Length")
atrLength = input(14, "ATR Length")

// Calculate indicators
[macdLine, signalLine, histLine] = ta.macd(close, fastLength, slowLength, signalLength)
rsi = ta.rsi(close, rsiLength)
atr = ta.atr(atrLength)

sma50 = ta.sma(close, 50)
sma200 = ta.sma(close, 200)

// Strategy logic
longCondition = macdLine > signalLine and rsi < 70 and close > sma50 and sma50 > sma200
shortCondition = macdLine < signalLine and rsi > 30 and close < sma50 and sma50 < sma200

// Execute trades
if (longCondition)
    strategy.entry("Long", strategy.long)

if (shortCondition)
    strategy.entry("Short", strategy.short)

// Set stop loss and take profit
stopLoss = 2 * atr
takeProfit = 3 * atr

strategy.exit("Exit Long", "Long", stop = strategy.position_avg_price - stopLoss, limit = strategy.position_avg_price + takeProfit)
strategy.exit("Exit Short", "Short", stop = strategy.position_avg_price + stopLoss, limit = strategy.position_avg_price - takeProfit)

// Plot indicators
plot(sma50, color=color.blue, title="50 SMA")
plot(sma200, color=color.red, title="200 SMA")
plot(ta.crossover(macdLine, signalLine) ? close : na, style=plot.style_circles, color=color.green, title="MACD Crossover")
plot(ta.crossunder(macdLine, signalLine) ? close : na, style=plot.style_circles, color=color.red, title="MACD Crossunder")
相关推荐