资源加载中... loading...

Moving Average Crossover with Trailing Stop Loss Strategy

Author: ChaoZhang, Date: 2024-05-29 17:02:19
Tags: SMARSIATR

img

Overview

This strategy uses two Simple Moving Averages (SMAs) with different periods to capture price trends and incorporates the Relative Strength Index (RSI) and Average True Range (ATR) indicators to optimize trade signals and risk management. A buy signal is generated when the short-term SMA crosses above the long-term SMA, and a sell signal is generated when the opposite occurs. The strategy employs a trailing stop loss method, dynamically adjusting the take profit and stop loss levels based on price movements to better protect profits and control risks.

Strategy Principle

  1. Calculate two SMAs with different periods, defaulting to 10 and 30.
  2. Generate a buy signal when the short-term SMA crosses above the long-term SMA, and a sell signal when the short-term SMA crosses below the long-term SMA.
  3. Upon buying, set the stop loss and take profit levels based on the current closing price, defaulting to 2 units below and 6 units above the closing price, respectively.
  4. Dynamically adjust the take profit level during the holding period to better protect profits based on price movements.
  5. Use the 14-period RSI and ATR indicators to assist in assessing market trends and volatility, optimizing trade signals.

Strategy Advantages

  1. Simplicity: The strategy is based on the classic moving average crossover principle, with clear logic and easy to understand and implement.
  2. Trend following: By using two SMAs with different periods, the strategy effectively captures medium to long-term market trends and adapts to various market environments.
  3. Dynamic stop loss and take profit: The trailing stop loss method dynamically adjusts the take profit and stop loss levels based on price movements, protecting profits while controlling risks.
  4. Multi-indicator synergy: Combining RSI and ATR indicators provides a more comprehensive assessment of market trends and volatility, improving the reliability of trade signals.

Strategy Risks

  1. Parameter optimization risk: SMA periods, take profit and stop loss levels, and other parameters need to be optimized for different markets and instruments. Improper parameter settings may lead to poor strategy performance.
  2. Choppy market risk: In choppy market conditions, frequent trade signals may result in overtrading and rapid capital depletion.
  3. Trend reversal risk: When market trends reverse, the strategy may experience consecutive losses.

Strategy Optimization Directions

  1. Dynamic parameter optimization: Dynamically adjust key parameters such as SMA periods and take profit/stop loss levels based on market changes to improve the strategy’s adaptability.
  2. Signal filtering: Introduce additional technical indicators or market sentiment indicators for secondary confirmation of trade signals, reducing misjudgments and overtrading.
  3. Position sizing: Dynamically adjust position sizes based on market volatility and account risk tolerance to control single trade risk.
  4. Multi-instrument synergy: Apply the strategy to multiple related instruments and use inter-instrument correlations for hedging to reduce overall portfolio risk.

Summary

The Moving Average Crossover with Trailing Stop Loss Strategy is a quantitative trading strategy based on classic technical analysis principles. It captures market trends using two SMAs with different periods and dynamically controls risk using a trailing stop loss method. The strategy also incorporates RSI and ATR indicators for a more comprehensive assessment of market conditions. Although the strategy has clear logic and is easy to implement, it is essential to consider issues such as parameter optimization, choppy market risk, and trend reversal risk in practical applications. Future optimizations can focus on dynamic parameter optimization, signal filtering, position sizing, and multi-instrument synergy to improve the strategy’s stability and profitability.


/*backtest
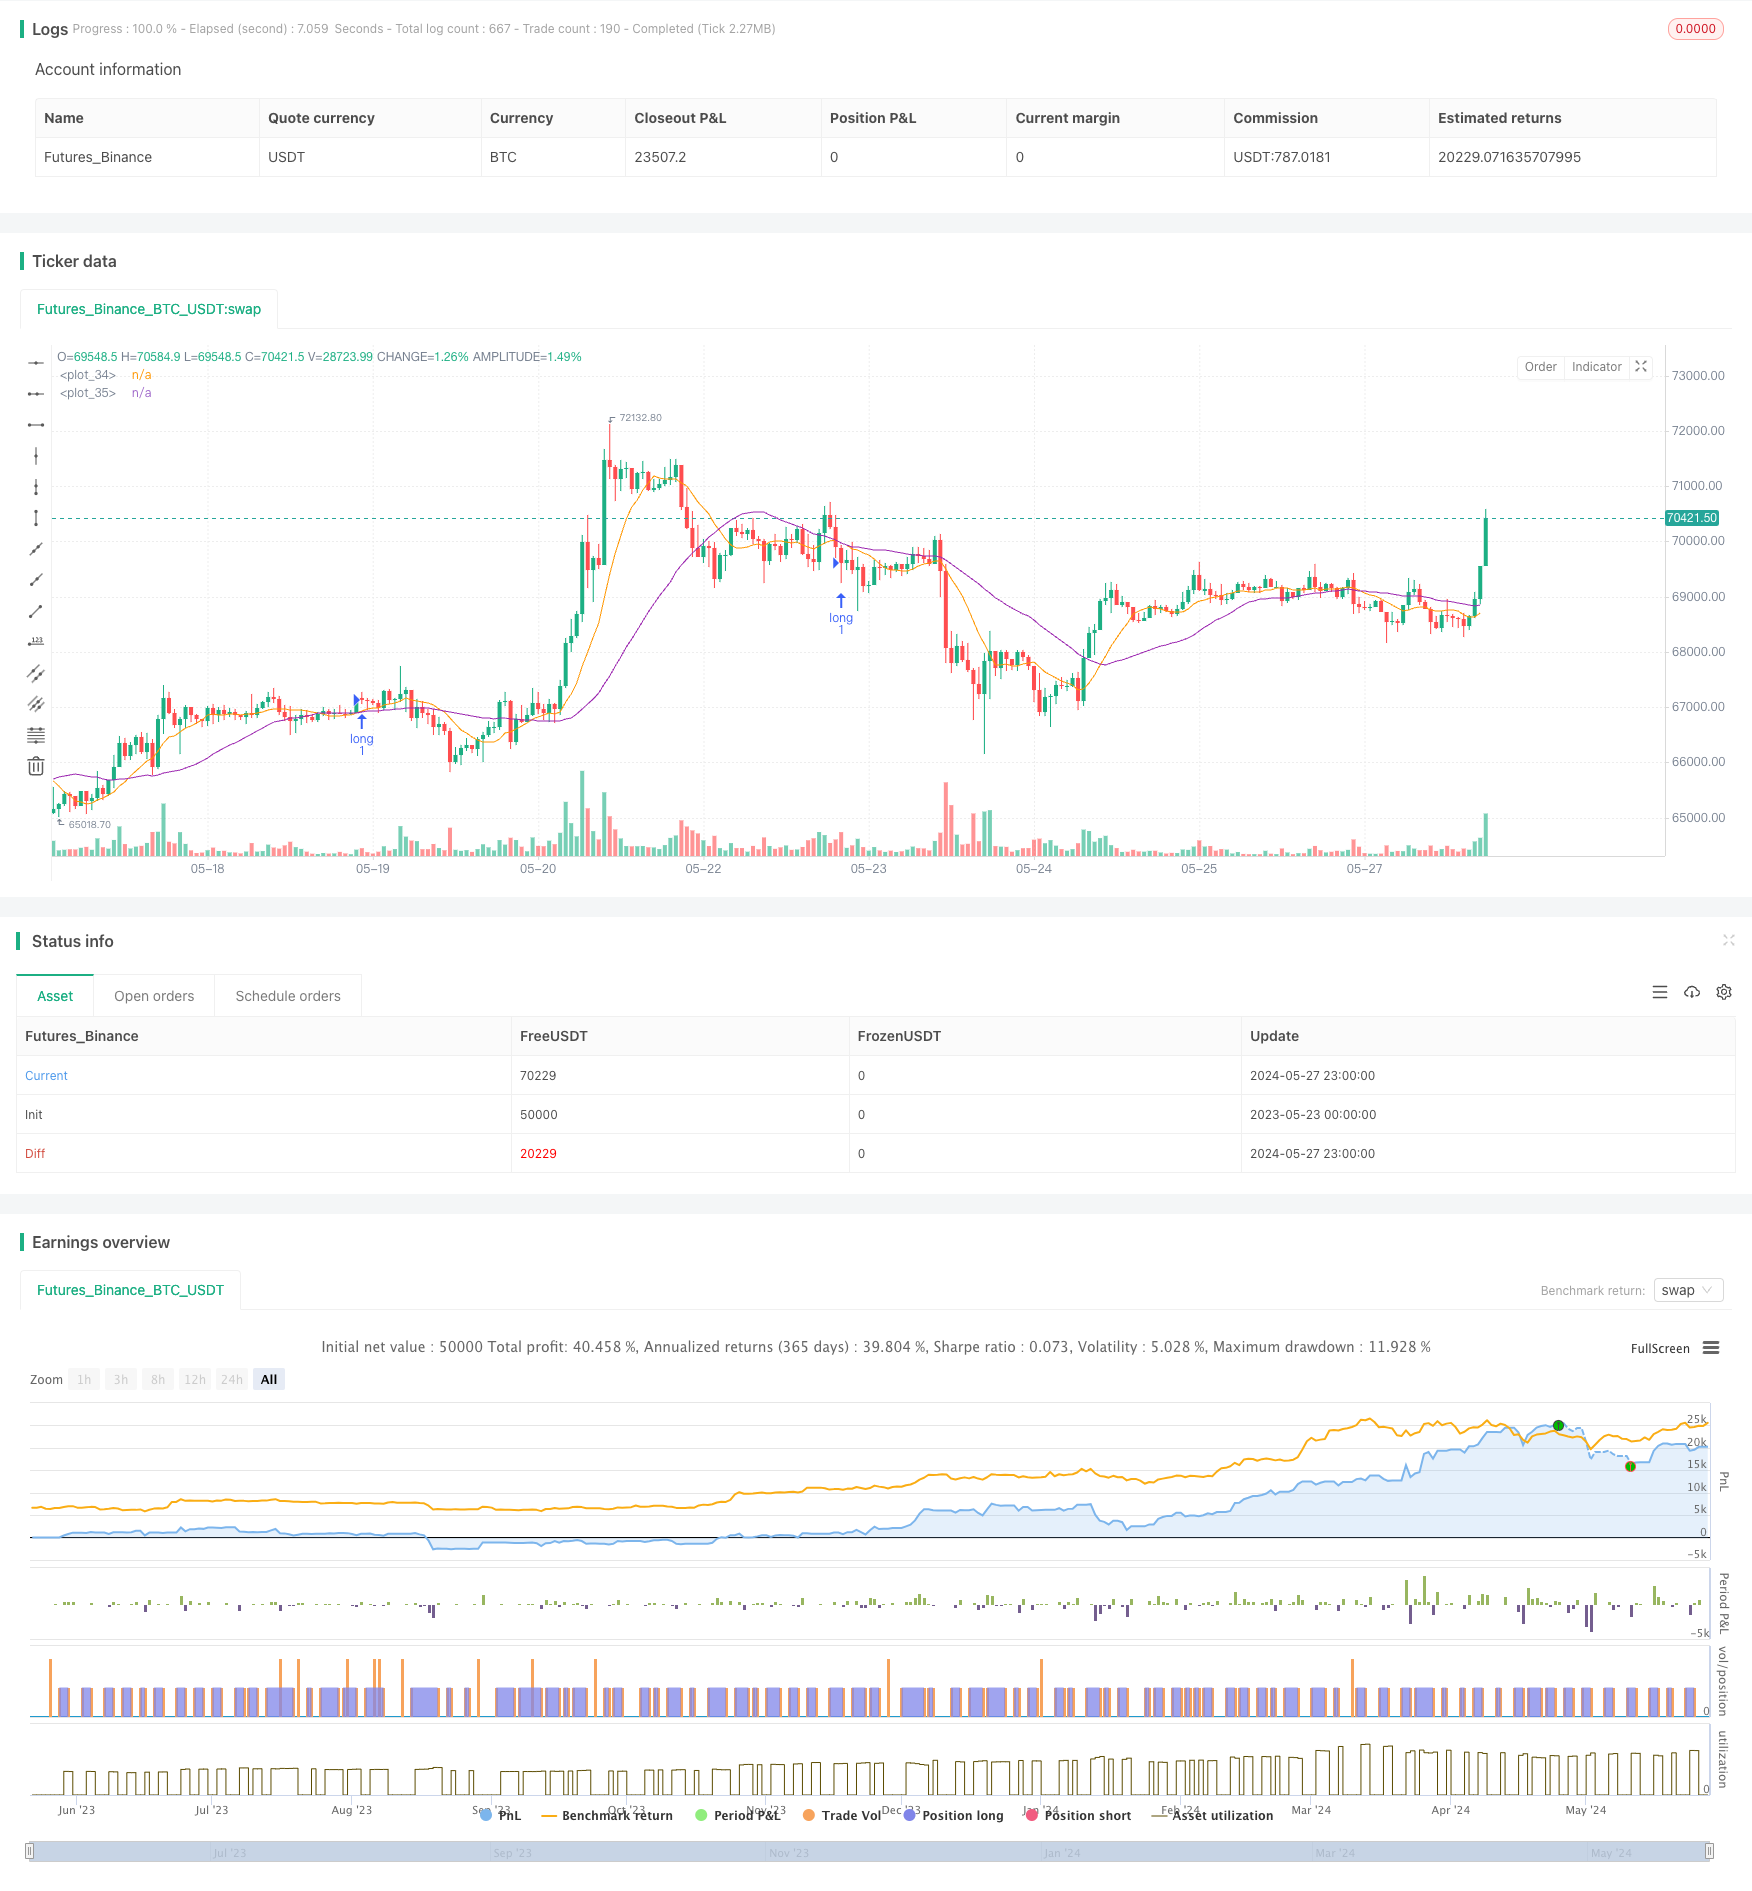
start: 2023-05-23 00:00:00
end: 2024-05-28 00:00:00
period: 1h
basePeriod: 15m
exchanges: [{"eid":"Futures_Binance","currency":"BTC_USDT"}]
*/

//@version=5
// suitable for : AMZN - 30 minutes, MSFT - 30 minutes, NVDA -15 minutes

strategy("AAPL-SIMPLE_SMA", overlay=true)

// Create Indicator's

// Create Indicator's
shortSMA = ta.sma(close, 10)
longSMA = ta.sma(close, 30)
rsi = ta.rsi(close, 14)
atr = ta.atr(14)
qty = 1

// Specify crossover conditions
longCondition = ta.crossover(shortSMA, longSMA)
shortCondition = ta.crossunder(shortSMA, longSMA)

// // Execute trade if condition is True
if (longCondition)
    stopLoss = close -2
    // stopLoss=1
    takeProfit = close +6

    action = "buy"
    strategy.entry("long", strategy.long, qty=qty)
    // strategy.exit("exit", "long", stop=stopLoss, limit=takeProfit)
    strategy.exit("exit", "long",  limit=takeProfit)
    alert('{"TICKER":"'+syminfo.ticker+'","ACTION":"'+action+'","PRICE":"'+str.tostring(close)+'","STOPLOSS":"'+str.tostring(stopLoss)+'","TAKEPROFIT":"'+str.tostring(takeProfit)+'","QTY":"'+str.tostring(qty)+'"}')


plot(shortSMA)
plot(longSMA, color=color.purple)
template: strategy.tpl:40:21: executing "strategy.tpl" at <.api.GetStrategyListByName>: wrong number of args for GetStrategyListByName: want 7 got 6