概述
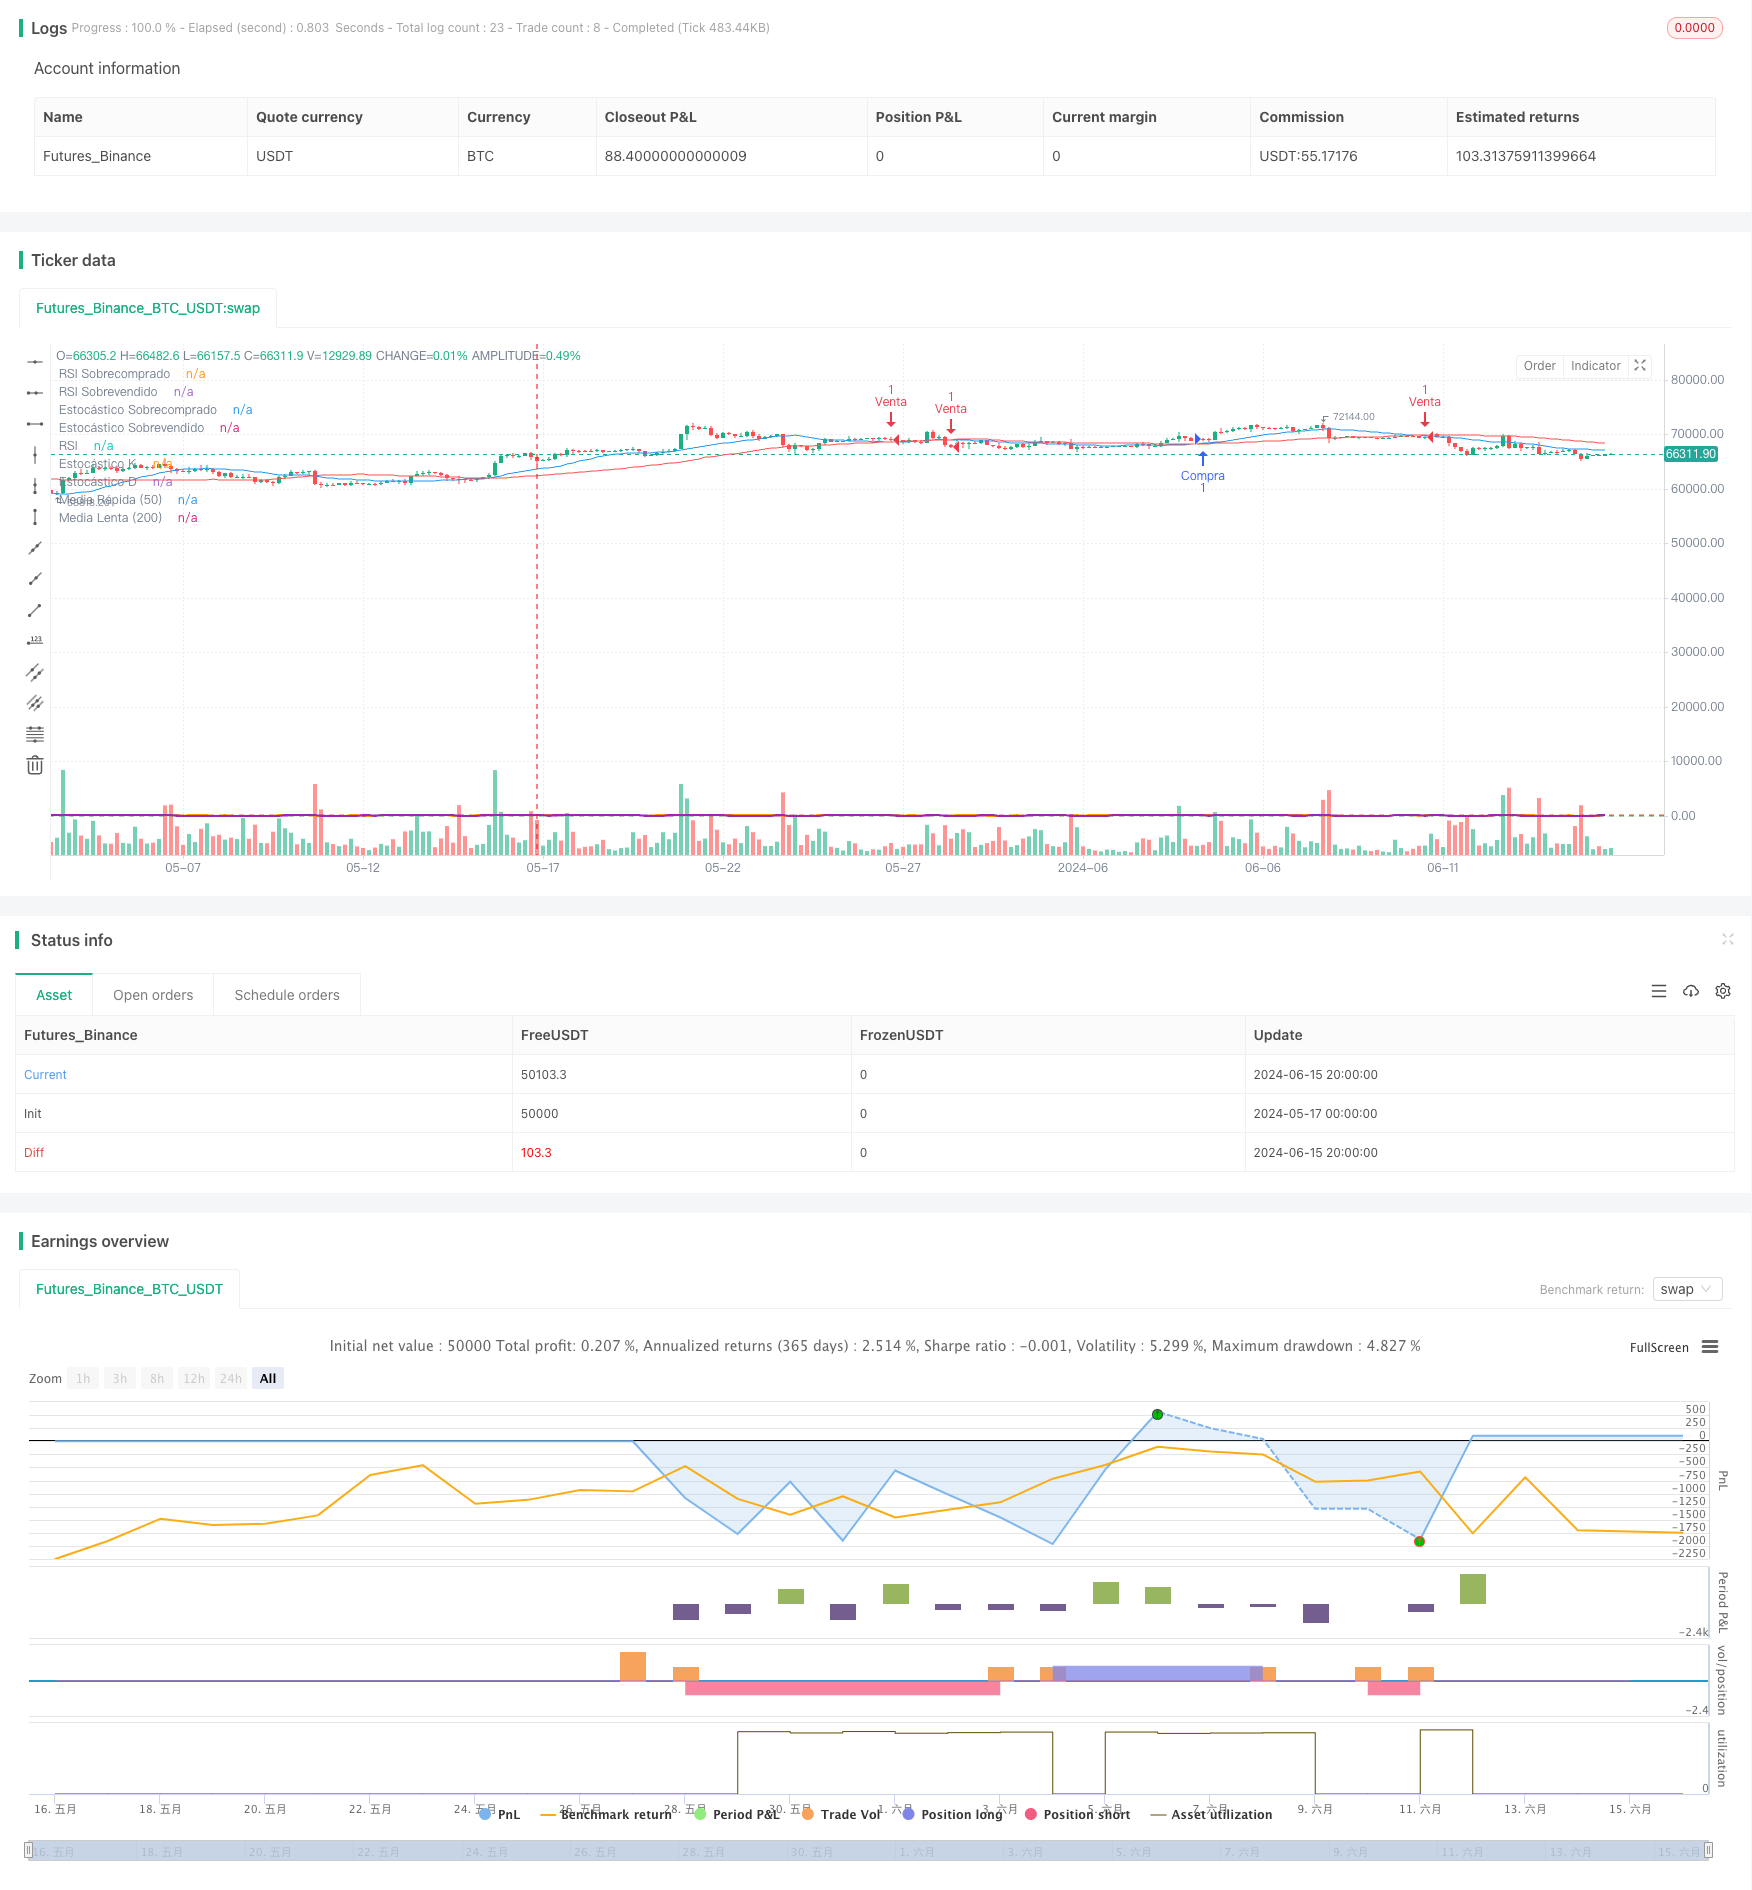
该策略结合了双均线交叉、RSI和随机指标,通过多个技术指标的共同确认,在短线交易中寻找高胜率的交易机会。策略使用20日和50日两条移动平均线的交叉作为主要交易信号,同时结合RSI和随机指标作为辅助判断,对交易信号进行二次确认。此外,该策略还采用了ATR作为止损和止盈的依据,以固定的风险收益比管理头寸,力求在控制风险的同时获取稳定收益。
策略原理
- 计算20日和50日两条移动平均线,当短期均线上穿长期均线时,产生做多信号;反之,产生做空信号。
- 引入RSI指标作为辅助判断,当RSI指标未达到超买或超卖区间时,才考虑建仓。
- 引入随机指标作为辅助判断,当随机指标K线未达到超买或超卖区间时,才考虑建仓。
- 使用ATR计算止损和止盈位置,按照1:2的风险收益比设置止损和止盈价位。
- 做多时,止损位置为最低价减去ATR,止盈位置为最高价加上2倍ATR;做空时,止损位置为最高价加上ATR,止盈位置为最低价减去2倍ATR。
策略优势
- 双均线交叉是一个简单易用的趋势判断指标,与RSI和随机指标的结合可以有效过滤假信号。
- RSI和随机指标可以帮助判断市场是否处于超买超卖状态,避免在极端行情下入场。
- 固定风险收益比的仓位管理方式,可以在控制整体风险的前提下,获得相对稳定的收益。
- 参数可调,适用于不同的市场环境和交易风格。
策略风险
- 趋势型策略在震荡市容易产生较多的假信号,导致频繁交易和资金损耗。
- 固定比例止损可能导致单次亏损过大,削弱资金曲线。
- 缺乏仓位管理和资金管理方面的考虑,难以应对极端行情。
策略优化方向
- 引入更多有效的技术指标,提高信号的准确性和可靠性。
- 优化止损止盈的设置方法,采用更加动态和智能的方式,提高策略收益水平。
- 在仓位管理方面,可以结合ATR等波动率指标,对仓位进行动态调整。
- 在资金管理方面,引入风险预算、凯利公式等方法,提高资金利用效率。
总结
该策略是一个基于双均线、RSI和随机指标的短线交易策略,通过多个技术指标的共同确认,在把握趋势性机会的同时,控制交易风险。策略逻辑清晰,参数易于优化,适合进行短线交易的投资者使用。但是,该策略也存在一些不足,如趋势把握能力有限,缺乏对仓位和资金的动态管理等。这些问题可以通过引入更多技术指标、优化信号和仓位管理等方式加以改进,以期进一步提高策略性能。
策略源码
/*backtest
start: 2024-05-17 00:00:00
end: 2024-06-16 00:00:00
period: 4h
basePeriod: 15m
exchanges: [{"eid":"Futures_Binance","currency":"BTC_USDT"}]
*/

//@version=5
strategy("Cruce de Medias con Filtros de RSI y Estocástico", overlay=true)

// Definir parámetros de las medias móviles
fast_length = input(20, title="Periodo de Media Rápida")
slow_length = input(50, title="Periodo de Media Lenta")

// Calcular medias móviles
fast_ma = ta.sma(close, fast_length)
slow_ma = ta.sma(close, slow_length)

// Añadir filtro RSI
rsi_length = input(7, title="Periodo del RSI")
rsi = ta.rsi(close, rsi_length)
rsi_overbought = input(70, title="RSI Sobrecomprado")
rsi_oversold = input(30, title="RSI Sobrevendido")

// Añadir filtro Estocástico
k_period = input(7, title="K Periodo del Estocástico")
d_period = input(3, title="D Periodo del Estocástico")
smooth_k = input(3, title="Suavización del Estocástico")
stoch_k = ta.sma(ta.stoch(close, high, low, k_period), smooth_k)
stoch_d = ta.sma(stoch_k, d_period)
stoch_overbought = input(80, title="Estocástico Sobrecomprado")
stoch_oversold = input(20, title="Estocástico Sobrevendido")

// Definir niveles de stop-loss y take-profit con ratio 2:1
risk = input(1, title="Riesgo en ATR")
reward_ratio = input(2, title="Ratio Riesgo/Beneficio")
atr_length = input(14, title="Periodo del ATR")
atr = ta.atr(atr_length)
stop_loss = risk * atr
take_profit = reward_ratio * stop_loss

// Señal de compra
long_condition = ta.crossover(fast_ma, slow_ma) and rsi < rsi_overbought and stoch_k < stoch_overbought
if (long_condition)
    strategy.entry("Compra", strategy.long)

// Señal de venta
short_condition = ta.crossunder(fast_ma, slow_ma) and rsi > rsi_oversold and stoch_k > stoch_oversold
if (short_condition)
    strategy.entry("Venta", strategy.short)

// Configurar Stop-Loss y Take-Profit para posiciones largas
if (strategy.position_size > 0)
    strategy.exit("Take Profit/Stop Loss", from_entry="Compra", stop=low - stop_loss, limit=high + take_profit)

// Configurar Stop-Loss y Take-Profit para posiciones cortas
if (strategy.position_size < 0)
    strategy.exit("Take Profit/Stop Loss", from_entry="Venta", stop=high + stop_loss, limit=low - take_profit)

// Plotear las medias móviles en el gráfico
plot(fast_ma, title="Media Rápida (50)", color=color.blue)
plot(slow_ma, title="Media Lenta (200)", color=color.red)

// Plotear RSI y Estocástico en subgráficos
hline(rsi_overbought, "RSI Sobrecomprado", color=color.red)
hline(rsi_oversold, "RSI Sobrevendido", color=color.green)
plot(rsi, title="RSI", color=color.orange, linewidth=2)
hline(stoch_overbought, "Estocástico Sobrecomprado", color=color.red)
hline(stoch_oversold, "Estocástico Sobrevendido", color=color.green)
plot(stoch_k, title="Estocástico K", color=color.purple, linewidth=2)
plot(stoch_d, title="Estocástico D", color=color.purple, linewidth=1, style=plot.style_stepline)
相关推荐