概述
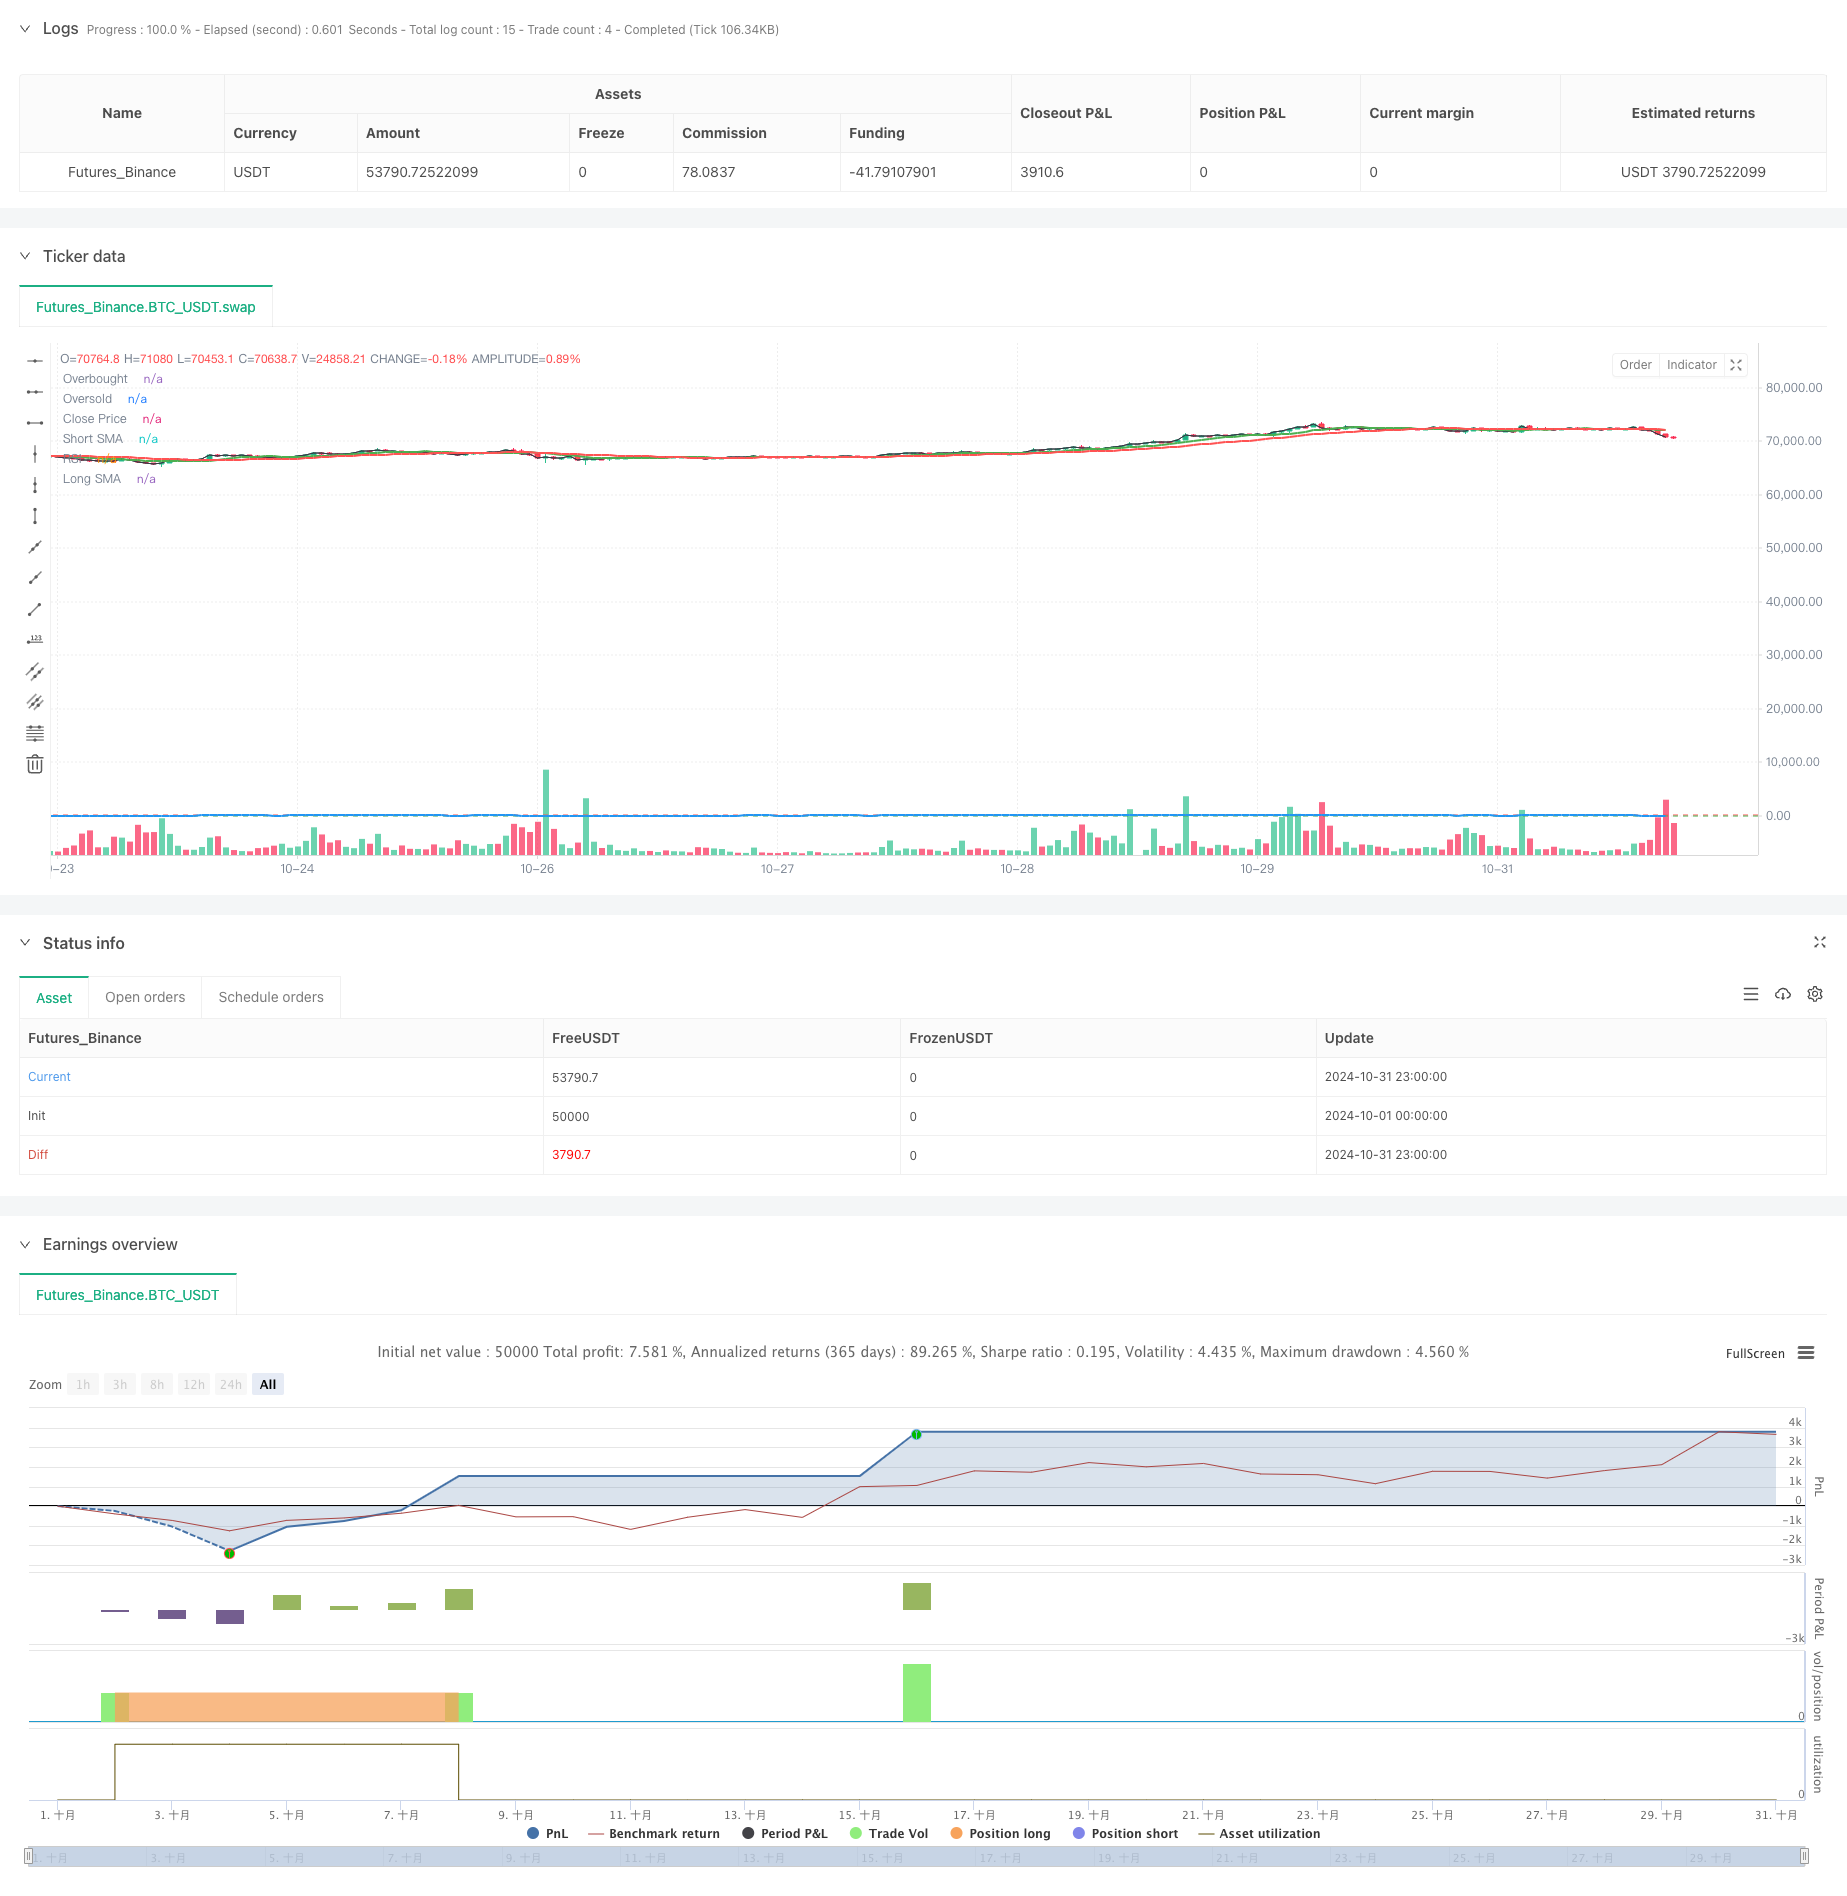
这是一个结合双均线交叉、RSI超买超卖以及风险收益比的量化交易策略。该策略通过短期和长期移动平均线的交叉来确定市场趋势方向,同时利用RSI指标识别超买超卖区域,实现更精准的交易信号过滤。策略还集成了基于ATR的动态止损设置和固定风险收益比的获利目标管理系统。
策略原理
策略采用9日和21日两条移动平均线作为趋势判断的基础,通过RSI指标的超买超卖区域(35⁄65)进行信号确认。在多头入场条件下,要求短期均线位于长期均线之上且RSI处于超卖区域(低于35);空头入场则需要短期均线位于长期均线之下且RSI处于超买区域(高于65)。策略使用1.5倍ATR值设置止损距离,并基于2:1的风险收益比自动计算获利目标。为防止过度持仓,策略设置了最短3小时的持仓时间限制。
策略优势
- 多重信号确认机制显著提升了交易的可靠性
- 动态止损设置能够根据市场波动性自适应调整
- 固定风险收益比有助于长期稳定获利
- 最短持仓时间限制有效避免了过度交易
- 可视化标记系统便于策略监控和回测分析
- 背景颜色变化直观显示当前持仓状态
策略风险
- 双均线系统在震荡市可能产生假信号
- RSI指标在强势趋势中可能错过部分交易机会
- 固定的风险收益比可能在某些市场环境下不够灵活
- ATR止损在波动性突变时可能不够及时
- 最短持仓时间可能导致错过及时止损机会
策略优化方向
- 引入自适应的均线周期选择机制,根据市场状态动态调整
- 增加趋势强度过滤器,提高信号质量
- 开发动态风险收益比调整系统,适应不同市场环境
- 整合成交量指标,提升信号可靠性
- 添加市场波动性分析模块,优化交易时机选择
- 引入机器学习算法优化参数选择
总结
本策略通过多重技术指标的协同配合,构建了一个相对完整的交易系统。它不仅关注入场信号的质量,还注重风险管理和利润目标的设定。虽然存在一些需要优化的地方,但整体框架设计合理,具有良好的实用价值和扩展空间。策略的模块化设计也为后续优化提供了便利条件。
策略源码
/*backtest
start: 2024-10-01 00:00:00
end: 2024-10-31 23:59:59
period: 1h
basePeriod: 1h
exchanges: [{"eid":"Futures_Binance","currency":"BTC_USDT"}]
*/

//@version=5
strategy("JakeJohn", overlay=true)

// Input parameters
smaShortLength = input(9, title="Short SMA Length")
smaLongLength = input(21, title="Long SMA Length")
lengthRSI = input(14, title="RSI Length")
rsiOverbought = input(65, title="RSI Overbought Level")
rsiOversold = input(35, title="RSI Oversold Level")
riskRewardRatio = input(2, title="Risk/Reward Ratio") // 2:1
atrMultiplier = input(1.5, title="ATR Multiplier") // Multiplier for ATR to set stop loss

// Calculate indicators
smaShort = ta.sma(close, smaShortLength)
smaLong = ta.sma(close, smaLongLength)
rsi = ta.rsi(close, lengthRSI)
atr = ta.atr(14)

// Entry conditions
longCondition = (smaShort > smaLong) and (rsi < rsiOversold) // Buy when short SMA is above long SMA and RSI is oversold
shortCondition = (smaShort < smaLong) and (rsi > rsiOverbought) // Sell when short SMA is below long SMA and RSI is overbought

// Variables for trade management
var float entryPrice = na
var float takeProfit = na
var int entryBarIndex = na

// Entry logic for long trades
if (longCondition and (strategy.position_size == 0))
    entryPrice := close
    takeProfit := entryPrice + (entryPrice - (entryPrice - (atr * atrMultiplier))) * riskRewardRatio
    strategy.entry("Buy", strategy.long)
    entryBarIndex := bar_index // Record the entry bar index
    label.new(bar_index, high, "BUY", style=label.style_label_up, color=color.green, textcolor=color.white, size=size.small)

// Entry logic for short trades
if (shortCondition and (strategy.position_size == 0))
    entryPrice := close
    takeProfit := entryPrice - (entryPrice - (entryPrice + (atr * atrMultiplier))) * riskRewardRatio
    strategy.entry("Sell", strategy.short)
    entryBarIndex := bar_index // Record the entry bar index
    label.new(bar_index, low, "SELL", style=label.style_label_down, color=color.red, textcolor=color.white, size=size.small)

// Manage trade duration and exit after a minimum of 3 hours
if (strategy.position_size != 0)
    // Check if the trade has been open for at least 3 hours (180 minutes)
    if (bar_index - entryBarIndex >= 180) // 3 hours in 1-minute bars
        if (strategy.position_size > 0)
            strategy.exit("Take Profit Long", from_entry="Buy", limit=takeProfit)
        else
            strategy.exit("Take Profit Short", from_entry="Sell", limit=takeProfit)

// Background colors for active trades
var color tradeColor = na
if (strategy.position_size > 0)
    tradeColor := color.new(color.green, 90) // Light green for long trades
else if (strategy.position_size < 0)
    tradeColor := color.new(color.red, 90) // Light red for short trades
else
    tradeColor := na // No color when no trade is active

bgcolor(tradeColor, title="Trade Background")

// Plotting position tools
if (strategy.position_size > 0)
    // Plot long position tool
    strategy.exit("TP Long", limit=takeProfit)

if (strategy.position_size < 0)
    // Plot short position tool
    strategy.exit("TP Short", limit=takeProfit)

// Plotting indicators
plot(smaShort, color=color.green, title="Short SMA", linewidth=2)
plot(smaLong, color=color.red, title="Long SMA", linewidth=2)

// Visual enhancements for RSI
hline(rsiOverbought, "Overbought", color=color.red)
hline(rsiOversold, "Oversold", color=color.green)
plot(rsi, color=color.blue, title="RSI", linewidth=2)

// Ensure there's at least one plot function
plot(close, color=color.black, title="Close Price", display=display.none) // Hidden plot for compliance
相关推荐