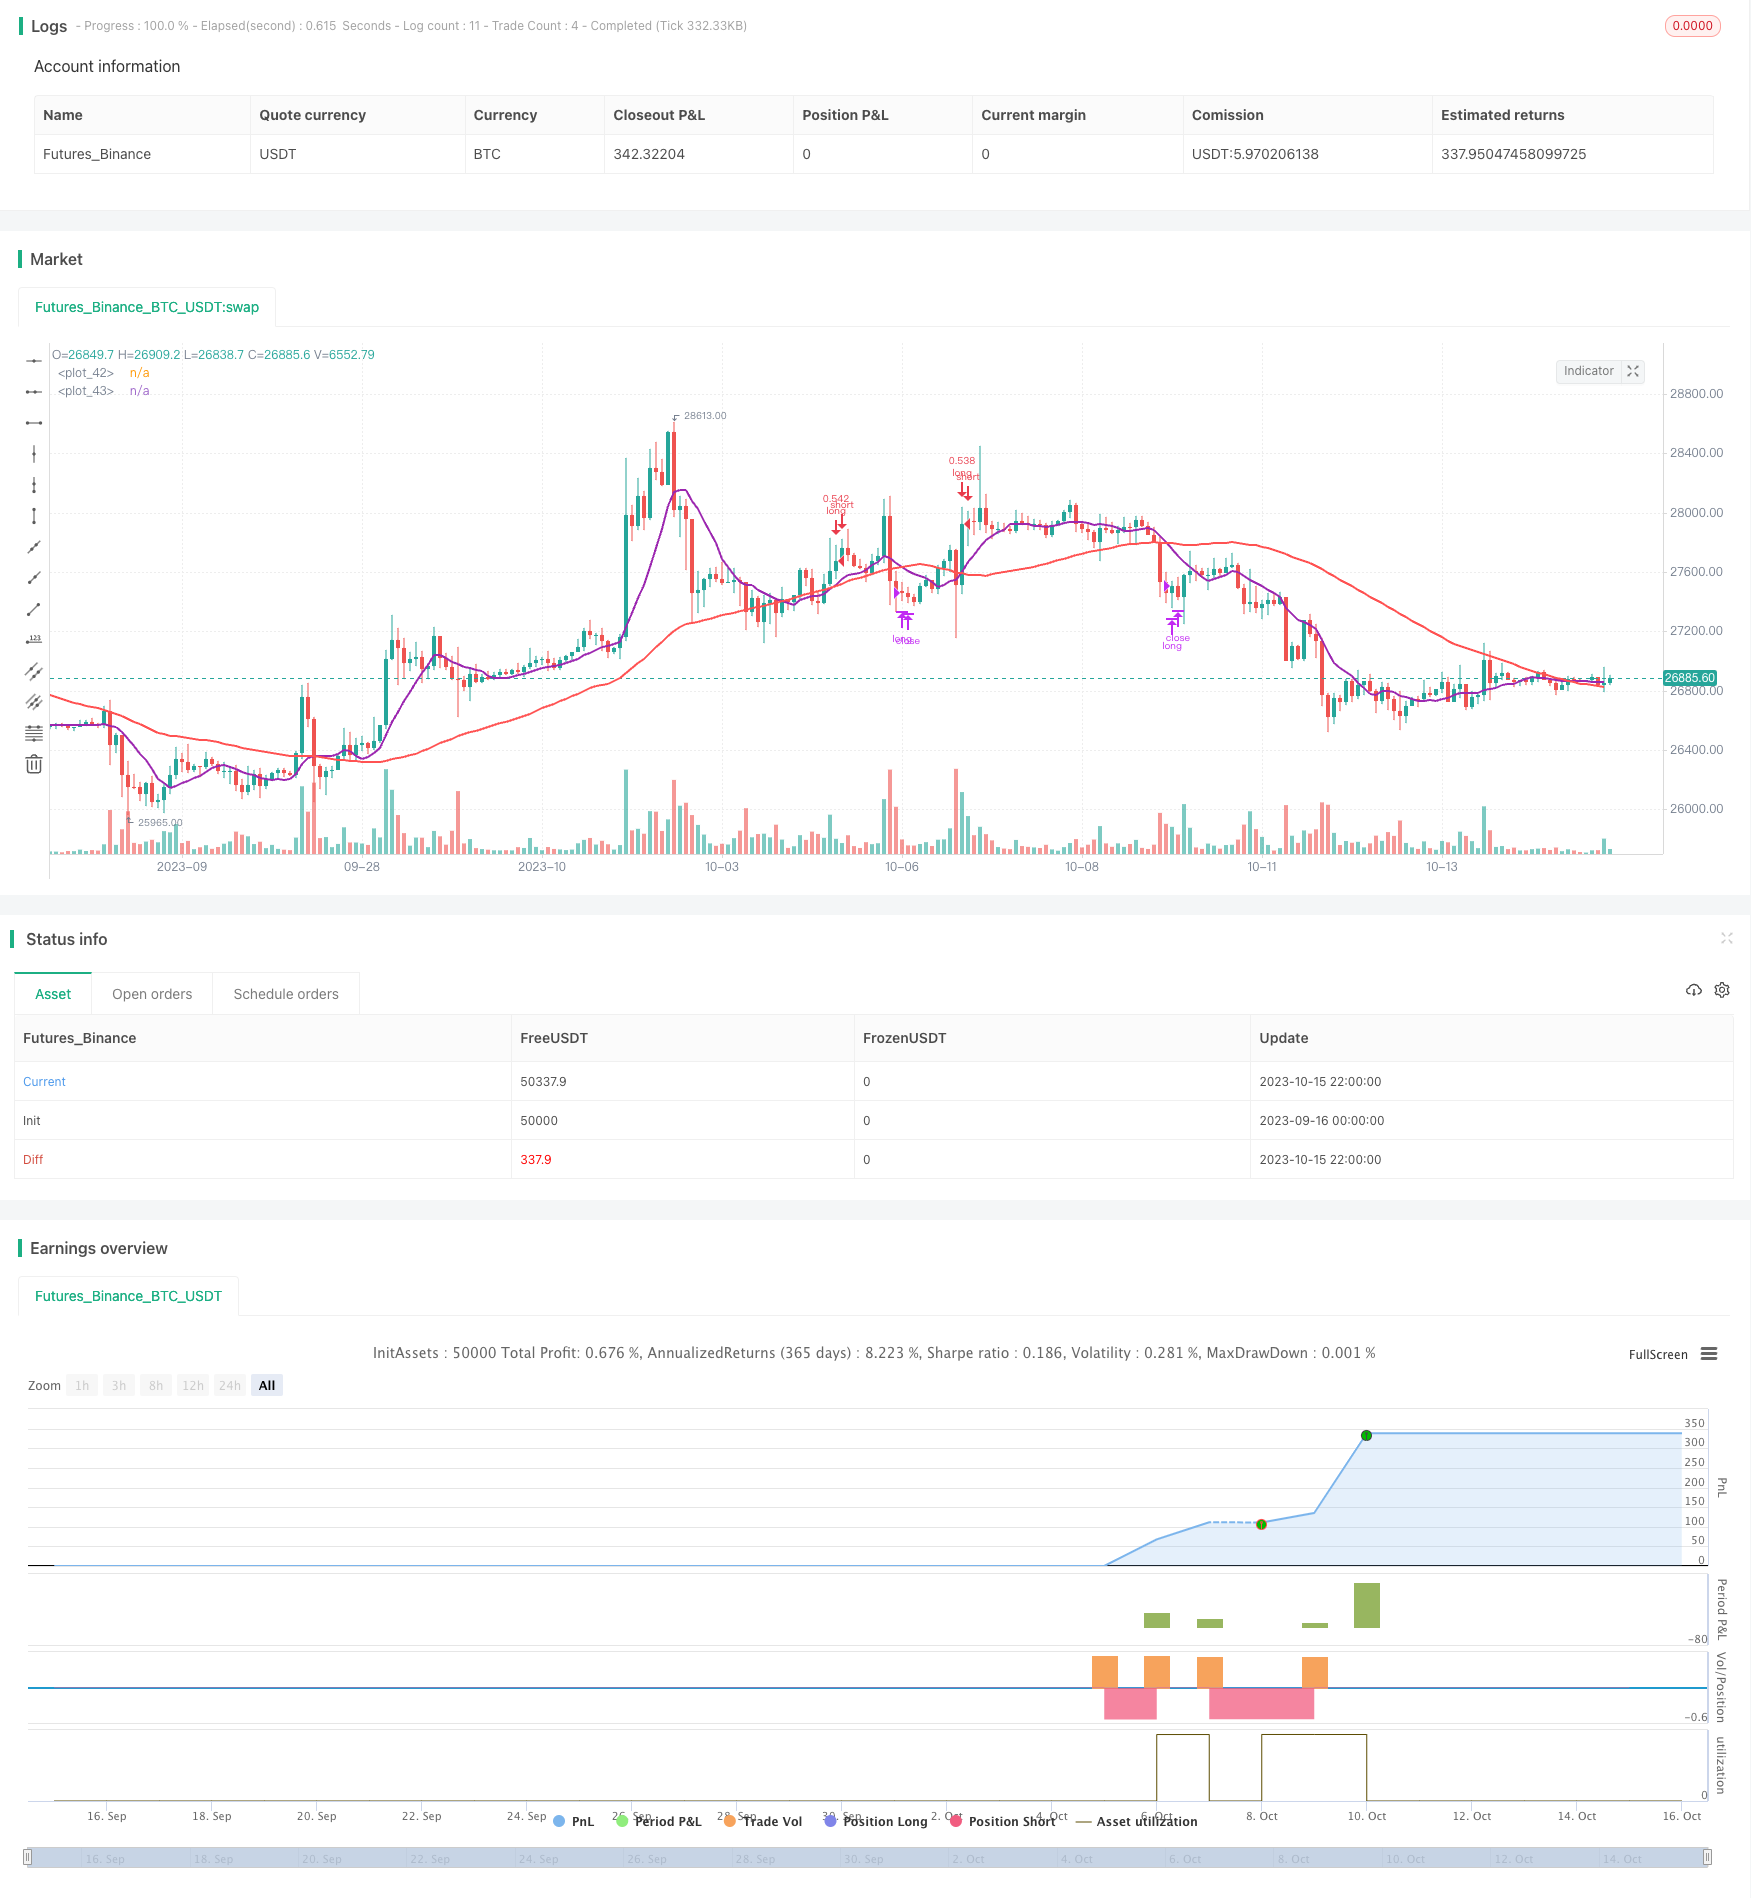
Tendência na sequência da estratégia de cruzamento da média móvel maximizada
Autora:ChaoZhang, Data: 2023-10-17 13:05:29Tags:

Resumo
Esta estratégia usa o cruzamento de duas médias móveis com períodos diferentes para gerar sinais de negociação.
Estratégia lógica
A estratégia usa um MA de curto prazo de 9 períodos (SMA) e um MA de longo prazo de 50 períodos (LMA). Quando o SMA cruza acima do LMA, um sinal de compra é gerado. Quando o SMA cruza abaixo do LMA, um sinal de venda é gerado.
A estratégia também incorpora o indicador RSI para medir a força da tendência. Os sinais de negociação são gerados apenas quando o RSI está acima de um limiar (padrão 55).
A estratégia negocia 30% do capital total de cada vez, com apenas uma posição aberta de cada vez.
Análise das vantagens
- Captura as oportunidades de tendência de forma eficaz utilizando os sinais de tendência cruzados da MA.
- Incorporar o RSI evita sinais incorretos quando a tendência para.
- Os parâmetros por defeito são otimizados e produzem retornos constantes em vários mercados.
- Uma gestão razoável do capital evita o dimensionamento excessivo das posições.
Análise de riscos
- São propensos a falhas e sinais incorretos durante os mercados de intervalo sem tendência.
- Nenhum lucro sem uma tendência significativa como uma estratégia de tendência.
- Negociação excessiva e comissões se os parâmetros não forem ajustados adequadamente.
- A ausência de stop loss expõe a estratégia ao risco de eventos.
Os riscos podem ser reduzidos através da otimização de parâmetros, da utilização de outros indicadores, da gestão rigorosa do capital e do stop loss.
Oportunidades de melhoria
- Teste diferentes combinações de MA para encontrar parâmetros ótimos.
- Incorporar outros indicadores como o MACD para confirmar a tendência.
- Implementar stop loss dinâmico para controlar a perda por transação.
- Ajustar o tamanho das posições com base em diferentes mercados.
- Usar indicadores de volume para medir a força da tendência.
Conclusão
A estratégia capta oportunidades de tendência usando um sistema de cruzamento MA simples. Os parâmetros padrão são otimizados com retornos constantes, adequados para negociação algorítmica. Melhorias adicionais podem ser feitas adicionando outros indicadores, otimizando parâmetros e implementando stop loss.
/*backtest
start: 2023-09-16 00:00:00
end: 2023-10-16 00:00:00
period: 2h
basePeriod: 15m
exchanges: [{"eid":"Futures_Binance","currency":"BTC_USDT"}]
*/

// This source code is subject to the terms of the Mozilla Public License 2.0 at https://mozilla.org/MPL/2.0/
// © relevantLeader16058

//@version=4
strategy(shorttitle='Maximized Moving Average Crossing ',title='Maximized Moving Average Crossing (by Coinrule)', overlay=true, initial_capital=1000,  default_qty_type = strategy.percent_of_equity, default_qty_value = 30, commission_type=strategy.commission.percent, commission_value=0.1)

//Backtest dates
fromMonth = input(defval = 1,    title = "From Month",      type = input.integer, minval = 1, maxval = 12)
fromDay   = input(defval = 1,    title = "From Day",        type = input.integer, minval = 1, maxval = 31)
fromYear  = input(defval = 2020, title = "From Year",       type = input.integer, minval = 1970)
thruMonth = input(defval = 1,    title = "Thru Month",      type = input.integer, minval = 1, maxval = 12)
thruDay   = input(defval = 1,    title = "Thru Day",        type = input.integer, minval = 1, maxval = 31)
thruYear  = input(defval = 2112, title = "Thru Year",       type = input.integer, minval = 1970)

showDate  = input(defval = true, title = "Show Date Range", type = input.bool)

start     = timestamp(fromYear, fromMonth, fromDay, 00, 00)        // backtest start window
finish    = timestamp(thruYear, thruMonth, thruDay, 23, 59)        // backtest finish window
window()  => time >= start and time <= finish ? true : false       // create function "within window of time"

//MA inputs and calculations
inlong=input(50, title='MA long period')
inshort=input(9, title='MA short period')

MAlong = sma(close, inlong)
MAshort= sma(close, inshort)

// RSI inputs and calculations
lengthRSI = (14)

RSI = rsi(close, lengthRSI)
RSI_Signal = input(55, title = 'RSI Trigger', minval=1)

//Entry and Exit
bullish = crossover(MAshort, MAlong)
bearish = crossunder(MAshort, MAlong)

strategy.entry(id="long", long = true, when = bullish and RSI > RSI_Signal and window())
strategy.close(id="long", when = bearish and window())


plot(MAshort, color=color.purple, linewidth=2)
plot(MAlong, color=color.red, linewidth=2)
- STC MA ATR Estratégia integrada de negociação de tendências
- Estratégia Bull Trend Riding Baseada no RSI Estocástico com Regras Especiais para Bias Bullish Pesados
- Tendência a curto e médio prazo na sequência de uma estratégia baseada em indicadores SMA
- Tendência de ouro/prata de 30 milhões de euros na sequência da estratégia de ruptura
- Estratégia de rastreamento da tendência adaptativa para parar perdas
- Estratégia de baixa de curto prazo baseada nos indicadores de crossover da EMA e da força de baixa
- Estratégia de negociação dupla da EMA
- Estratégia de cruzamento de média móvel dupla
- Williams 9 dias estratégia de fuga
- Estratégia de tendência de notação de média móvel múltipla
- Tendência de seguir a estratégia de compra e venda
- A estratégia de Brin para impedir o ataque e Martinho da Gama
- RSI e Média Móvel Crossover Multi Timeframe Trading Strategy
- Estratégia combinada de 123 Reversão e RSI suavizado
- Estratégia de negociação dupla da EMA
- Estratégia dinâmica de linha central de perda de paragem ATR
- Estratégia dupla de cruzamento da EMA
- Estratégia de negociação de dia de nuvem de Ichimoku
- Sistema dinâmico de negociação de alavancagem ajustado ao risco
- Estratégia de Impulso do MACD