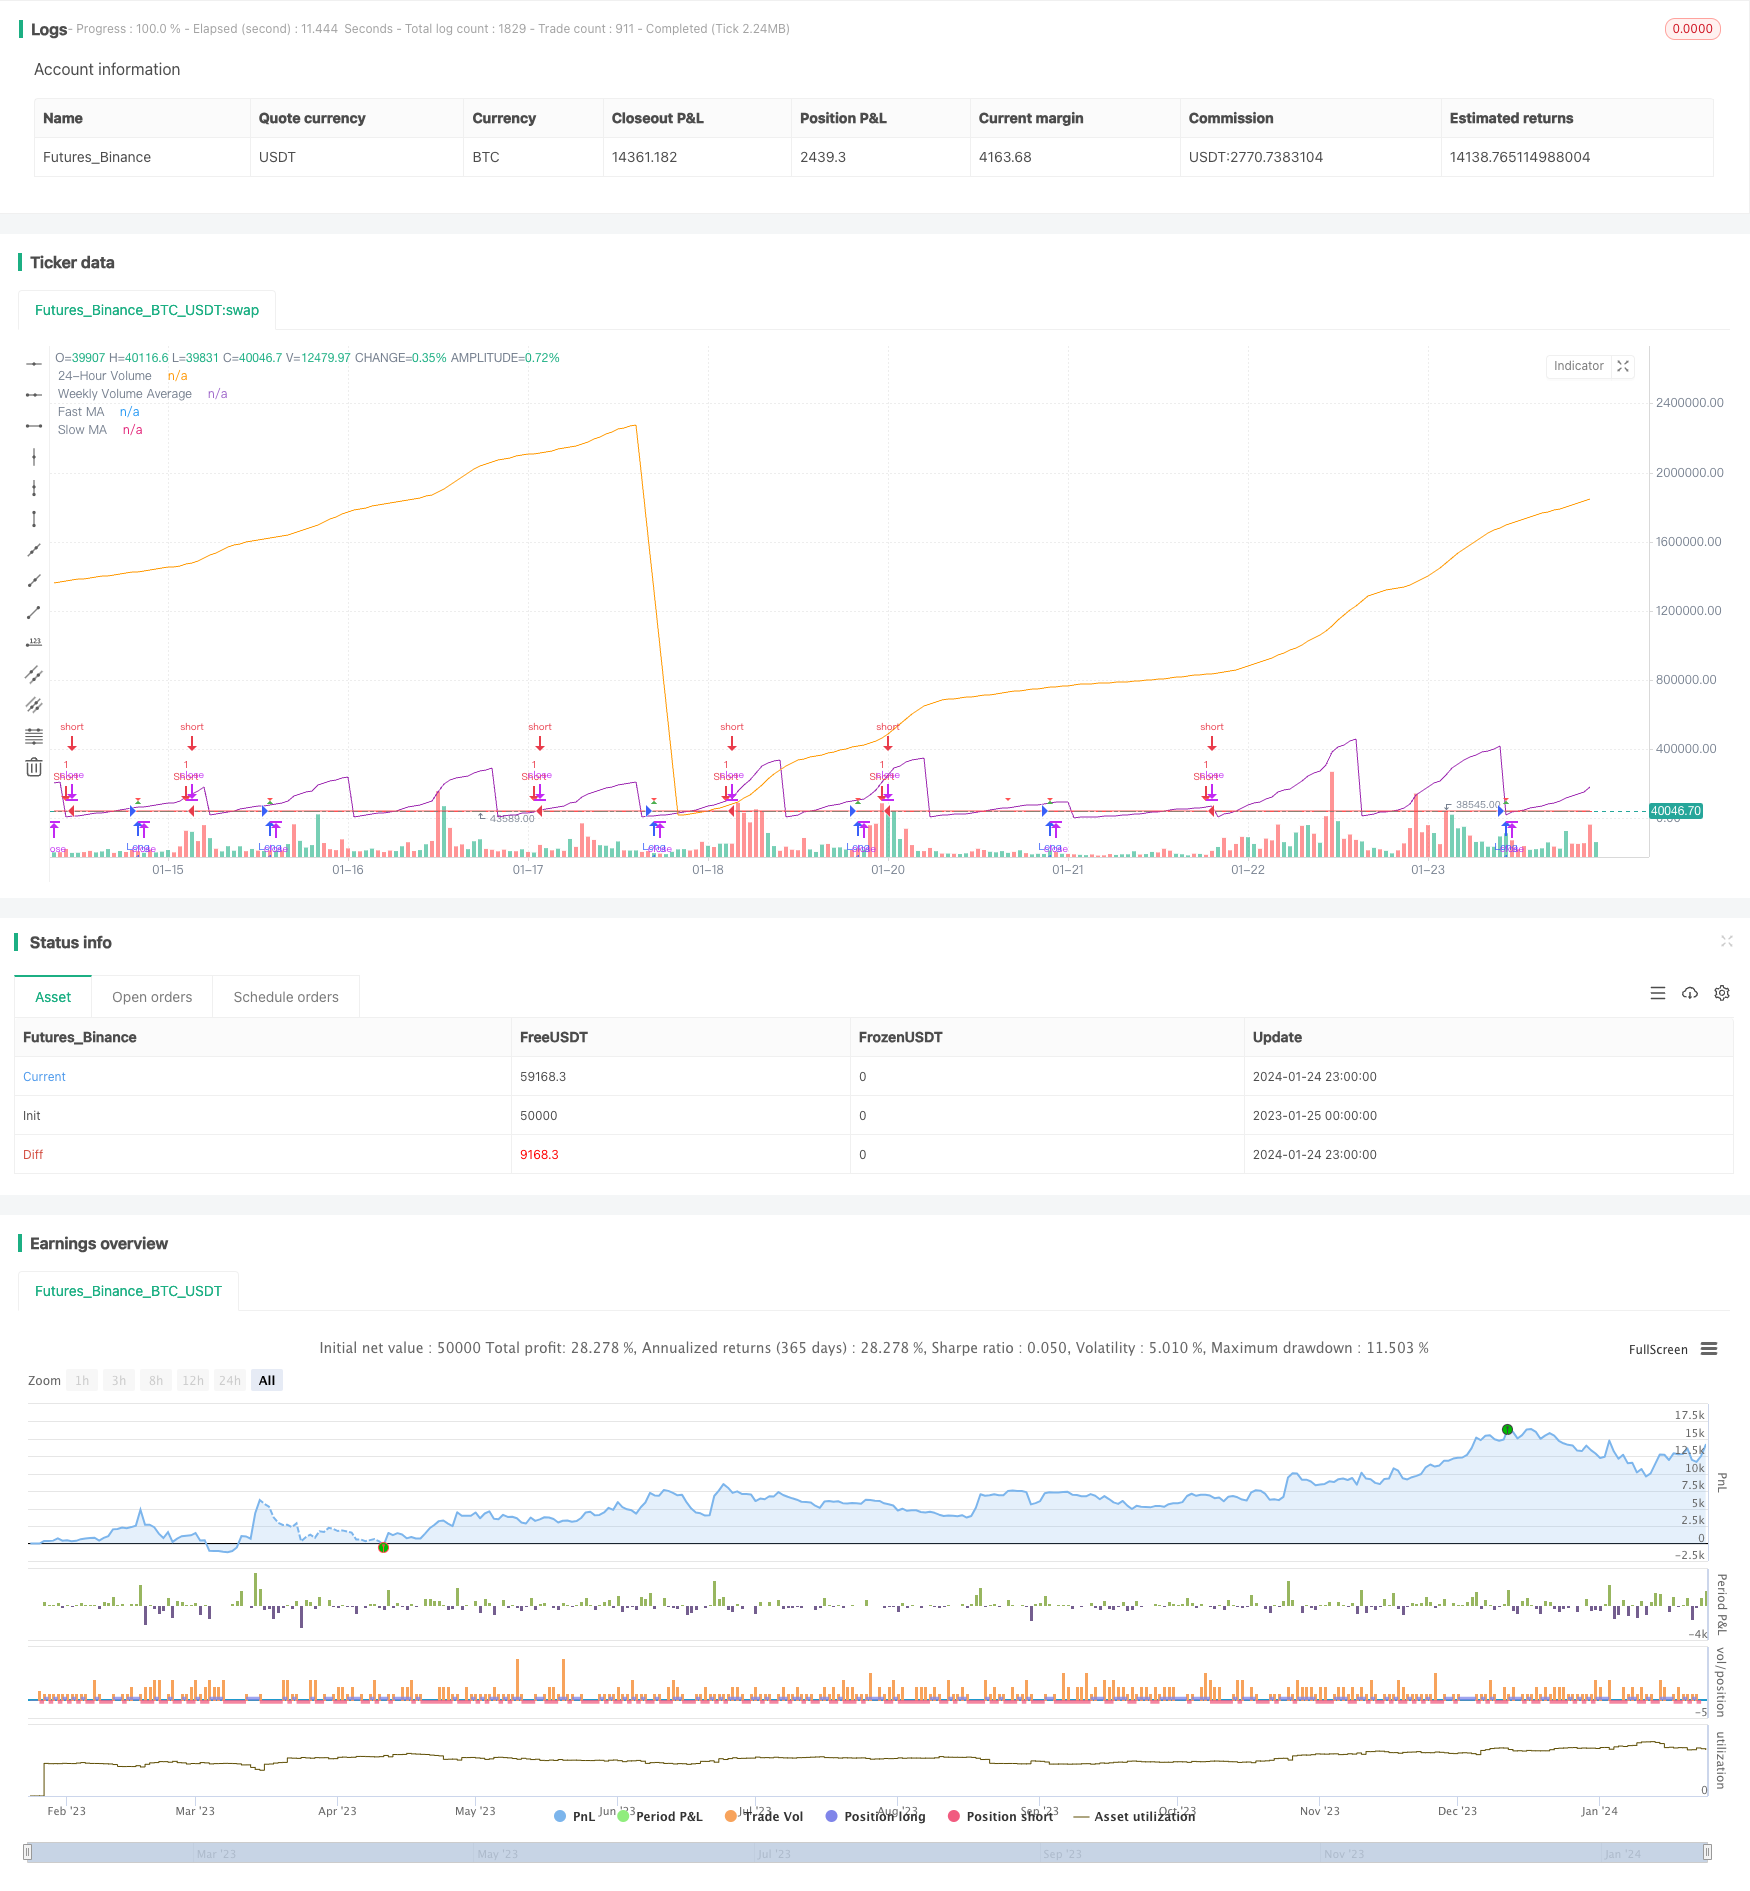
Estratégia de quantidade de cruzamento da média móvel de impulso
Autora:ChaoZhang, Data: 2024-01-26Tags:

Resumo
Esta estratégia combina os indicadores da média móvel e do volume de negociação para conceber as regras de entrada e saída longas e curtas, formando uma estratégia quantitativa de negociação completa.
Princípio da estratégia
Indicadores-chave
- Média móvel: MMA rápida (linha azul) e MMA lenta (linha vermelha)
- Volume: volume de 24 horas (Purple) e volume médio de 7 dias (Orange)
Condições da estratégia
Condições de entrada prolongadas:
- A MA rápida cruza a MA lenta
- Volume de 24 horas inferior a 50% do volume médio de 7 dias
Condições de entrada:
A MA rápida cruza abaixo da MA lenta
Entradas e saídas
Entrada longa:Vai longo quando as condições longas são cumpridas
Breve Introdução:Faça curto quando as condições curtas forem cumpridas
Faça lucro e pare de perder:Exibidos níveis de tomada de lucro e de stop loss para posição longa
Análise das vantagens
- Combinando preço e volume evitar falsos breakouts
- Regras claras de entrada e saída
- Obtenção de lucro e stop loss para controlar o risco
Análise de riscos
- Negociação frequente com estratégia de média móvel
- Qualidade dos dados de volume pouco fiável
- Super otimização no ajuste de parâmetros
Melhorias:
- Ajustar os parâmetros de MA para reduzir a frequência de negociação
- Verificar sinais com mais fontes de dados
- Testes de retrospectiva rigorosos para evitar a otimização excessiva
Orientações de otimização
- Adicionar outros indicadores aos sinais filtrados
- Dinâmica de tomada de lucro e stop loss
- Análise de quadros de tempo múltiplos para melhorar a estabilidade
Resumo
Esta estratégia integra indicadores de MA e volume para projetar uma estratégia de quantidade completa com condições de entrada claras, obter lucro / parar de perda, fácil de operar. É necessário evitar problemas comerciais frequentes, monitorar a qualidade dos dados de volume e a otimização excessiva.
/*backtest
start: 2023-01-25 00:00:00
end: 2024-01-25 00:00:00
period: 1h
basePeriod: 15m
exchanges: [{"eid":"Futures_Binance","currency":"BTC_USDT"}]
*/

//@version=5
strategy("MA and Volume Strategy", overlay=true)

// Input parameters
fastLength = input(9, title="Fast MA Length")
slowLength = input(21, title="Slow MA Length")
volumePercentageThreshold = input(50, title="Volume Percentage Threshold")

// Calculate moving averages
fastMA = ta.sma(close, fastLength)
slowMA = ta.sma(close, slowLength)

// Calculate 24-hour volume and weekly volume average
dailyVolume = request.security(syminfo.tickerid, "D", volume)
weeklyVolumeAvg = ta.sma(request.security(syminfo.tickerid, "W", volume), 7)

// Strategy conditions
longCondition = ta.crossover(fastMA, slowMA) and dailyVolume < (weeklyVolumeAvg * volumePercentageThreshold / 100)
shortCondition = ta.crossunder(fastMA, slowMA)

// Set take profit and stop loss levels
takeProfitLong = close * 1.50
stopLossLong = close * 0.90

// Strategy orders
strategy.entry("Long", strategy.long, when=longCondition)
strategy.entry("Short", strategy.short, when=shortCondition)

// Plot moving averages
plot(fastMA, color=color.blue, title="Fast MA")
plot(slowMA, color=color.red, title="Slow MA")

// Plot 24-hour volume and weekly volume average
plot(dailyVolume, color=color.purple, title="24-Hour Volume", transp=0)
plot(weeklyVolumeAvg, color=color.orange, title="Weekly Volume Average")

// Plot entry signals
plotshape(series=longCondition, title="Buy Signal", color=color.green, style=shape.triangleup, size=size.small)
plotshape(series=shortCondition, title="Sell Signal", color=color.red, style=shape.triangledown, size=size.small)

// Plot take profit and stop loss levels only when a valid trade is active
plotshape(series=longCondition, title="Take Profit Long", color=color.green, style=shape.triangleup, size=size.small)
plotshape(series=longCondition, title="Stop Loss Long", color=color.red, style=shape.triangledown, size=size.small)
- Estratégia de média móvel de retracement de dois anos
- Estratégia de negociação de média móvel dupla
- Sistema de rastreamento de tendências de reequilíbrio de posição dinâmico
- Estratégia de inversão aberta diária
- Estratégia de negociação da SMA Golden Cross
- Estratégia de média móvel Golden Cross
- Estratégia de negociação de criptomoedas do MACD
- Estratégia de curto prazo de regressão linear e média móvel dupla
- Estratégia de Impulso Estocástico Tripla Superposição
- Estratégia de tendência de impulso
- Estratégia de combinação de reversão de média móvel dupla e ATR trailing stop
- Estratégia de negociação de futuros de martingale alavancada
- Estratégia de recuperação de impulso
- Dual Candlestick Predicção Estratégia de fechamento
- Estratégia de oscilação quantitativa de suporte e resistência
- Estratégia de seguimento da tendência com 3 EMAs, DMI e MACD