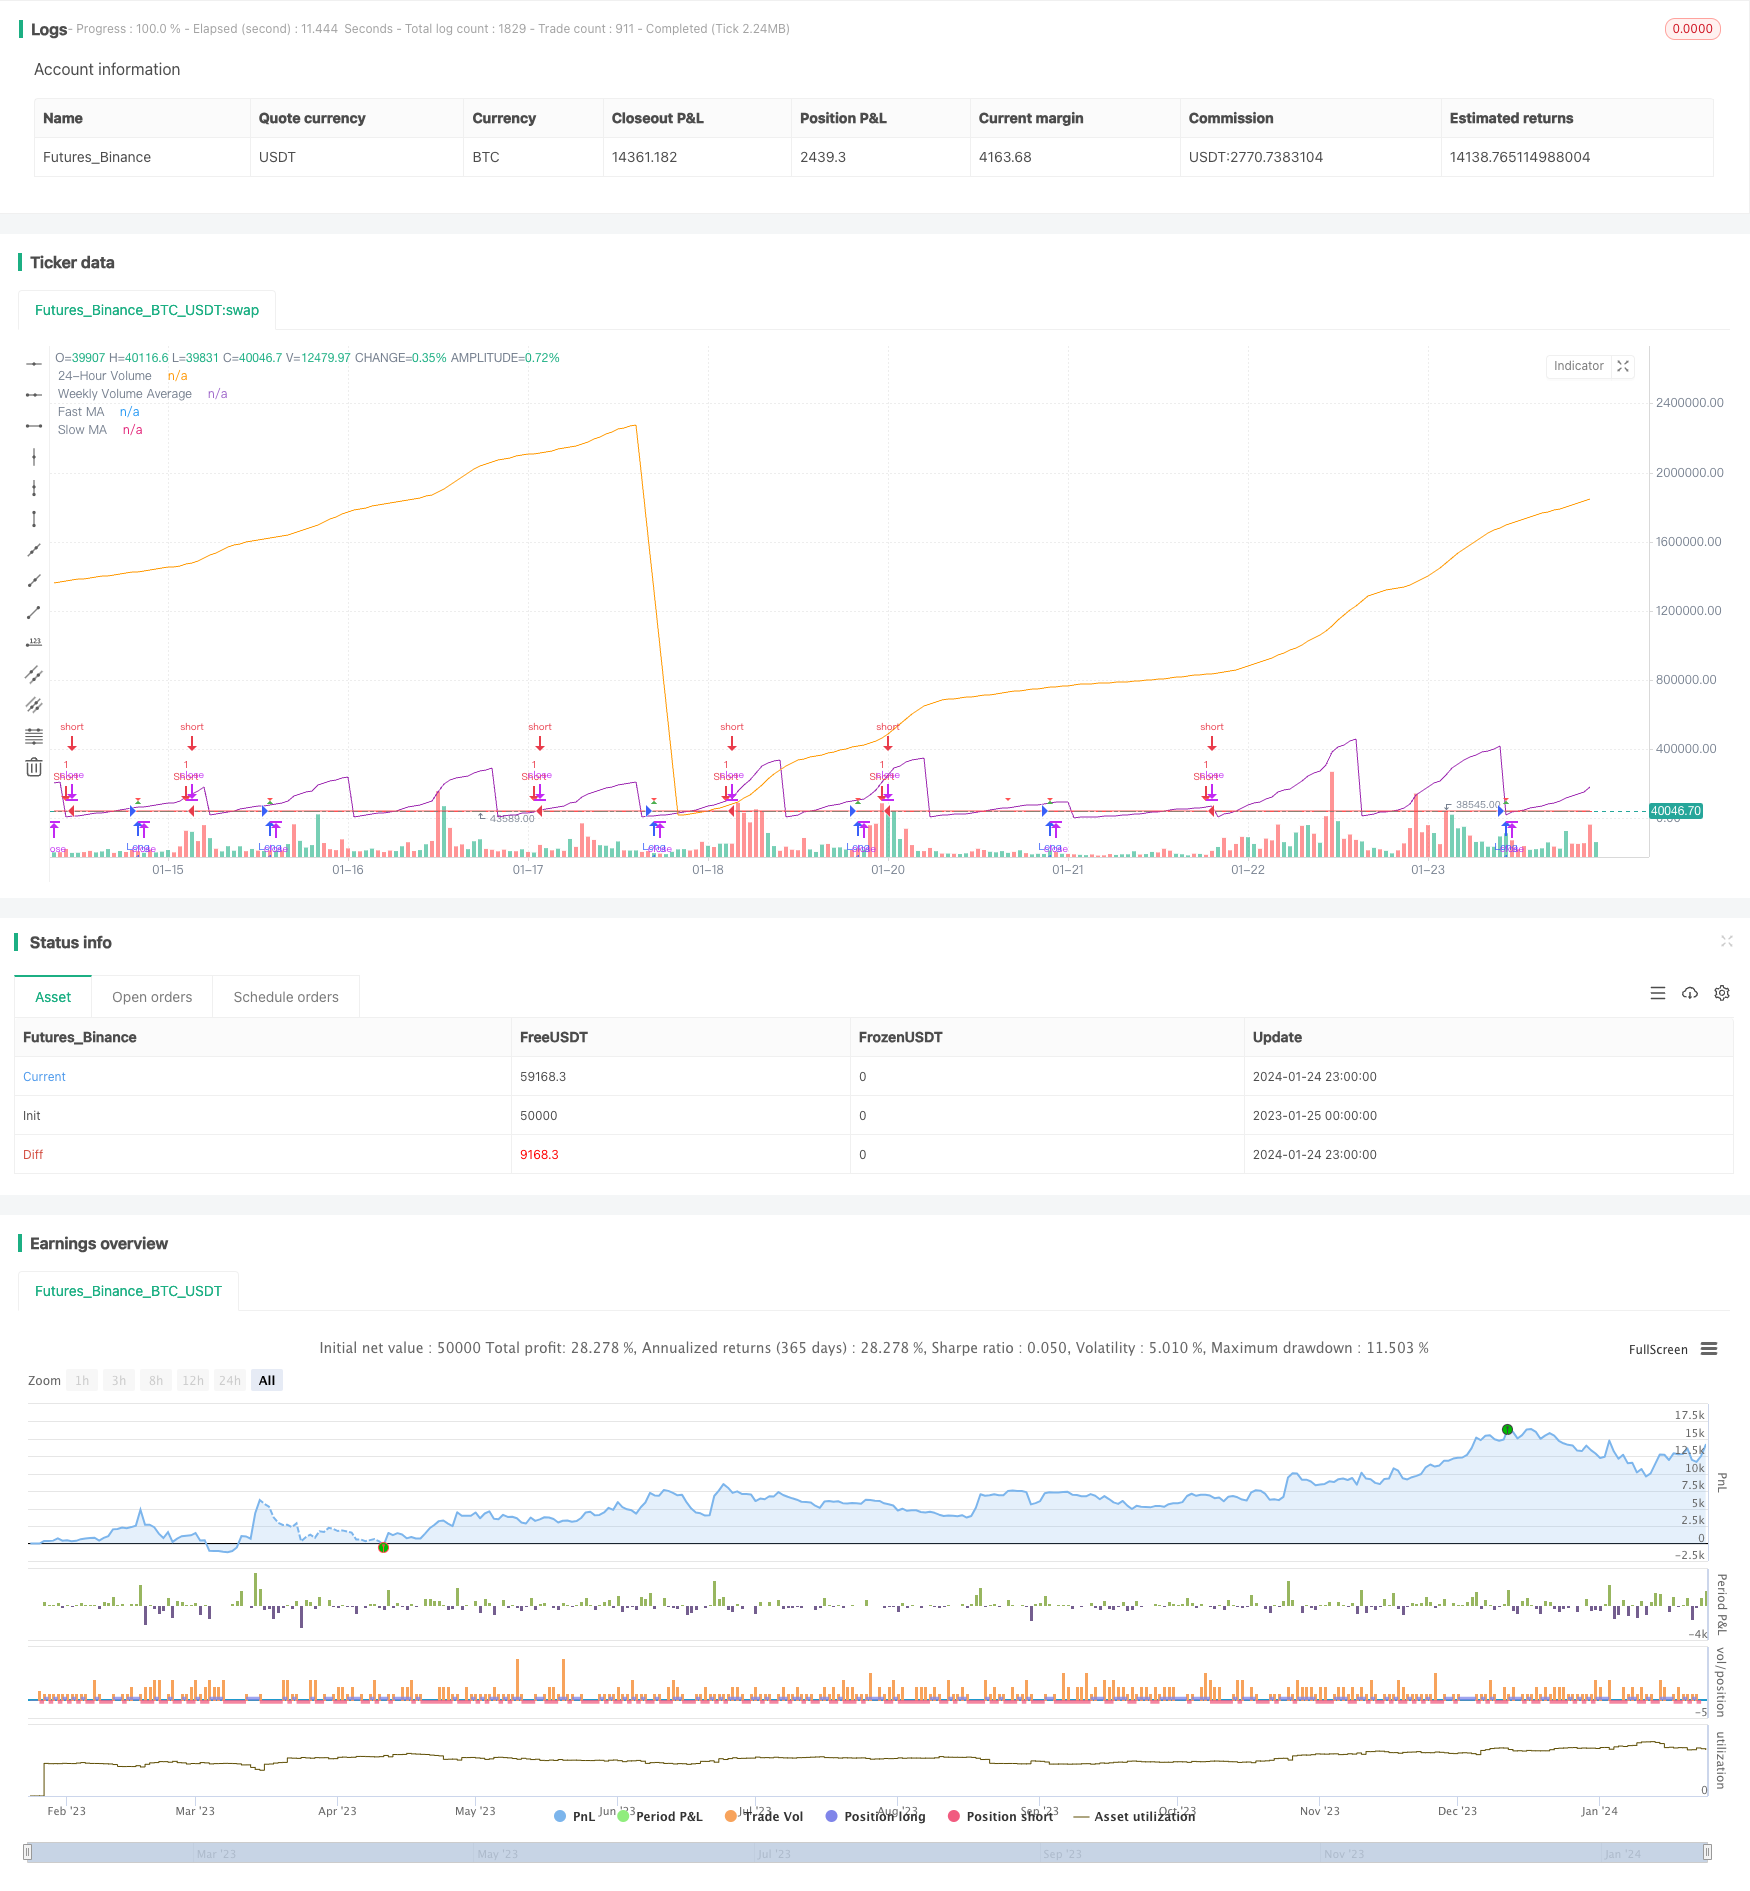
Chiến lược số lượng chuyển động trung bình
Tác giả:ChaoZhang, Ngày: 2024-01-26 11:39:26Tags:

Tổng quan
Chiến lược này kết hợp các chỉ số trung bình động và khối lượng giao dịch để thiết kế các quy tắc nhập và thoát dài và ngắn, tạo thành một chiến lược giao dịch định lượng hoàn chỉnh.
Nguyên tắc chiến lược
Các chỉ số chính
- Đường trung bình động: MA nhanh (dòng xanh) và MA chậm (dòng đỏ)
- Khối lượng: Khối lượng 24 giờ (Vàng) và Khối lượng trung bình 7 ngày (Mà cam)
Điều kiện chiến lược
Điều kiện nhập cảnh dài hạn:
- MA nhanh vượt qua MA chậm
- Số lượng 24 giờ dưới 50% số lượng trung bình 7 ngày
Điều kiện nhập cảnh ngắn:
MA nhanh vượt dưới MA chậm
Nhập và ra
Long Entry:Đi dài khi các điều kiện dài được đáp ứng
Bài viết ngắn:Đi ngắn khi các điều kiện ngắn được đáp ứng
Lấy lợi nhuận và dừng lỗ:Hiển thị mức lợi nhuận và dừng lỗ cho vị trí dài
Phân tích lợi thế
- Kết hợp giá và khối lượng tránh phá vỡ sai
- Các quy tắc nhập cảnh và xuất cảnh rõ ràng
- Lấy lợi nhuận và dừng lỗ để kiểm soát rủi ro
Phân tích rủi ro
- Giao dịch thường xuyên với chiến lược trung bình động
- Chất lượng dữ liệu không đáng tin cậy
- Tối ưu hóa quá mức trong điều chỉnh tham số
Cải tiến:
- Điều chỉnh các thông số MA để giảm tần suất giao dịch
- Xác minh tín hiệu với nhiều nguồn dữ liệu
- Kiểm tra hậu quả nghiêm ngặt để ngăn ngừa tối ưu hóa quá mức
Hướng dẫn tối ưu hóa
- Thêm các chỉ số khác vào các tín hiệu lọc
- Động thái lấy lợi nhuận và dừng lỗ
- Phân tích nhiều khung thời gian để cải thiện sự ổn định
Tóm lại
Chiến lược này tích hợp các chỉ số MA và khối lượng để thiết kế một chiến lược lượng đầy đủ với các điều kiện nhập cảnh rõ ràng, lấy lợi nhuận / dừng lỗ, dễ vận hành. Cần ngăn chặn các vấn đề giao dịch thường xuyên, theo dõi chất lượng dữ liệu khối lượng và tối ưu hóa quá mức.
/*backtest
start: 2023-01-25 00:00:00
end: 2024-01-25 00:00:00
period: 1h
basePeriod: 15m
exchanges: [{"eid":"Futures_Binance","currency":"BTC_USDT"}]
*/

//@version=5
strategy("MA and Volume Strategy", overlay=true)

// Input parameters
fastLength = input(9, title="Fast MA Length")
slowLength = input(21, title="Slow MA Length")
volumePercentageThreshold = input(50, title="Volume Percentage Threshold")

// Calculate moving averages
fastMA = ta.sma(close, fastLength)
slowMA = ta.sma(close, slowLength)

// Calculate 24-hour volume and weekly volume average
dailyVolume = request.security(syminfo.tickerid, "D", volume)
weeklyVolumeAvg = ta.sma(request.security(syminfo.tickerid, "W", volume), 7)

// Strategy conditions
longCondition = ta.crossover(fastMA, slowMA) and dailyVolume < (weeklyVolumeAvg * volumePercentageThreshold / 100)
shortCondition = ta.crossunder(fastMA, slowMA)

// Set take profit and stop loss levels
takeProfitLong = close * 1.50
stopLossLong = close * 0.90

// Strategy orders
strategy.entry("Long", strategy.long, when=longCondition)
strategy.entry("Short", strategy.short, when=shortCondition)

// Plot moving averages
plot(fastMA, color=color.blue, title="Fast MA")
plot(slowMA, color=color.red, title="Slow MA")

// Plot 24-hour volume and weekly volume average
plot(dailyVolume, color=color.purple, title="24-Hour Volume", transp=0)
plot(weeklyVolumeAvg, color=color.orange, title="Weekly Volume Average")

// Plot entry signals
plotshape(series=longCondition, title="Buy Signal", color=color.green, style=shape.triangleup, size=size.small)
plotshape(series=shortCondition, title="Sell Signal", color=color.red, style=shape.triangledown, size=size.small)

// Plot take profit and stop loss levels only when a valid trade is active
plotshape(series=longCondition, title="Take Profit Long", color=color.green, style=shape.triangleup, size=size.small)
plotshape(series=longCondition, title="Stop Loss Long", color=color.red, style=shape.triangledown, size=size.small)
Thêm nữa
- Chiến lược trung bình di chuyển cao mới hai năm
- Chiến lược giao dịch trung bình động kép
- Hệ thống theo dõi xu hướng tái cân bằng vị trí động
- Chiến lược đảo ngược mở hàng ngày
- Chiến lược giao dịch SMA Golden Cross
- Chiến lược trung bình chuyển động Golden Cross
- Chiến lược giao dịch tiền điện tử MACD
- Chiến lược ngắn hạn hồi quy tuyến tính và trung bình di chuyển kép
- Chiến lược động lượng Stochastic gấp ba lần
- Chiến lược Xu hướng Động lực
- Chiến lược kết hợp của sự đảo ngược trung bình di chuyển kép và ATR Trailing Stop
- Chiến lược giao dịch tương lai đòn bẩy Martingale
- Chiến lược đẩy lùi động lực
- Chiến lược đóng cửa dự đoán hai ngọn nến
- Chiến lược dao động hỗ trợ và kháng cự định lượng
- Chiến lược theo xu hướng với 3 EMA, DMI và MACD