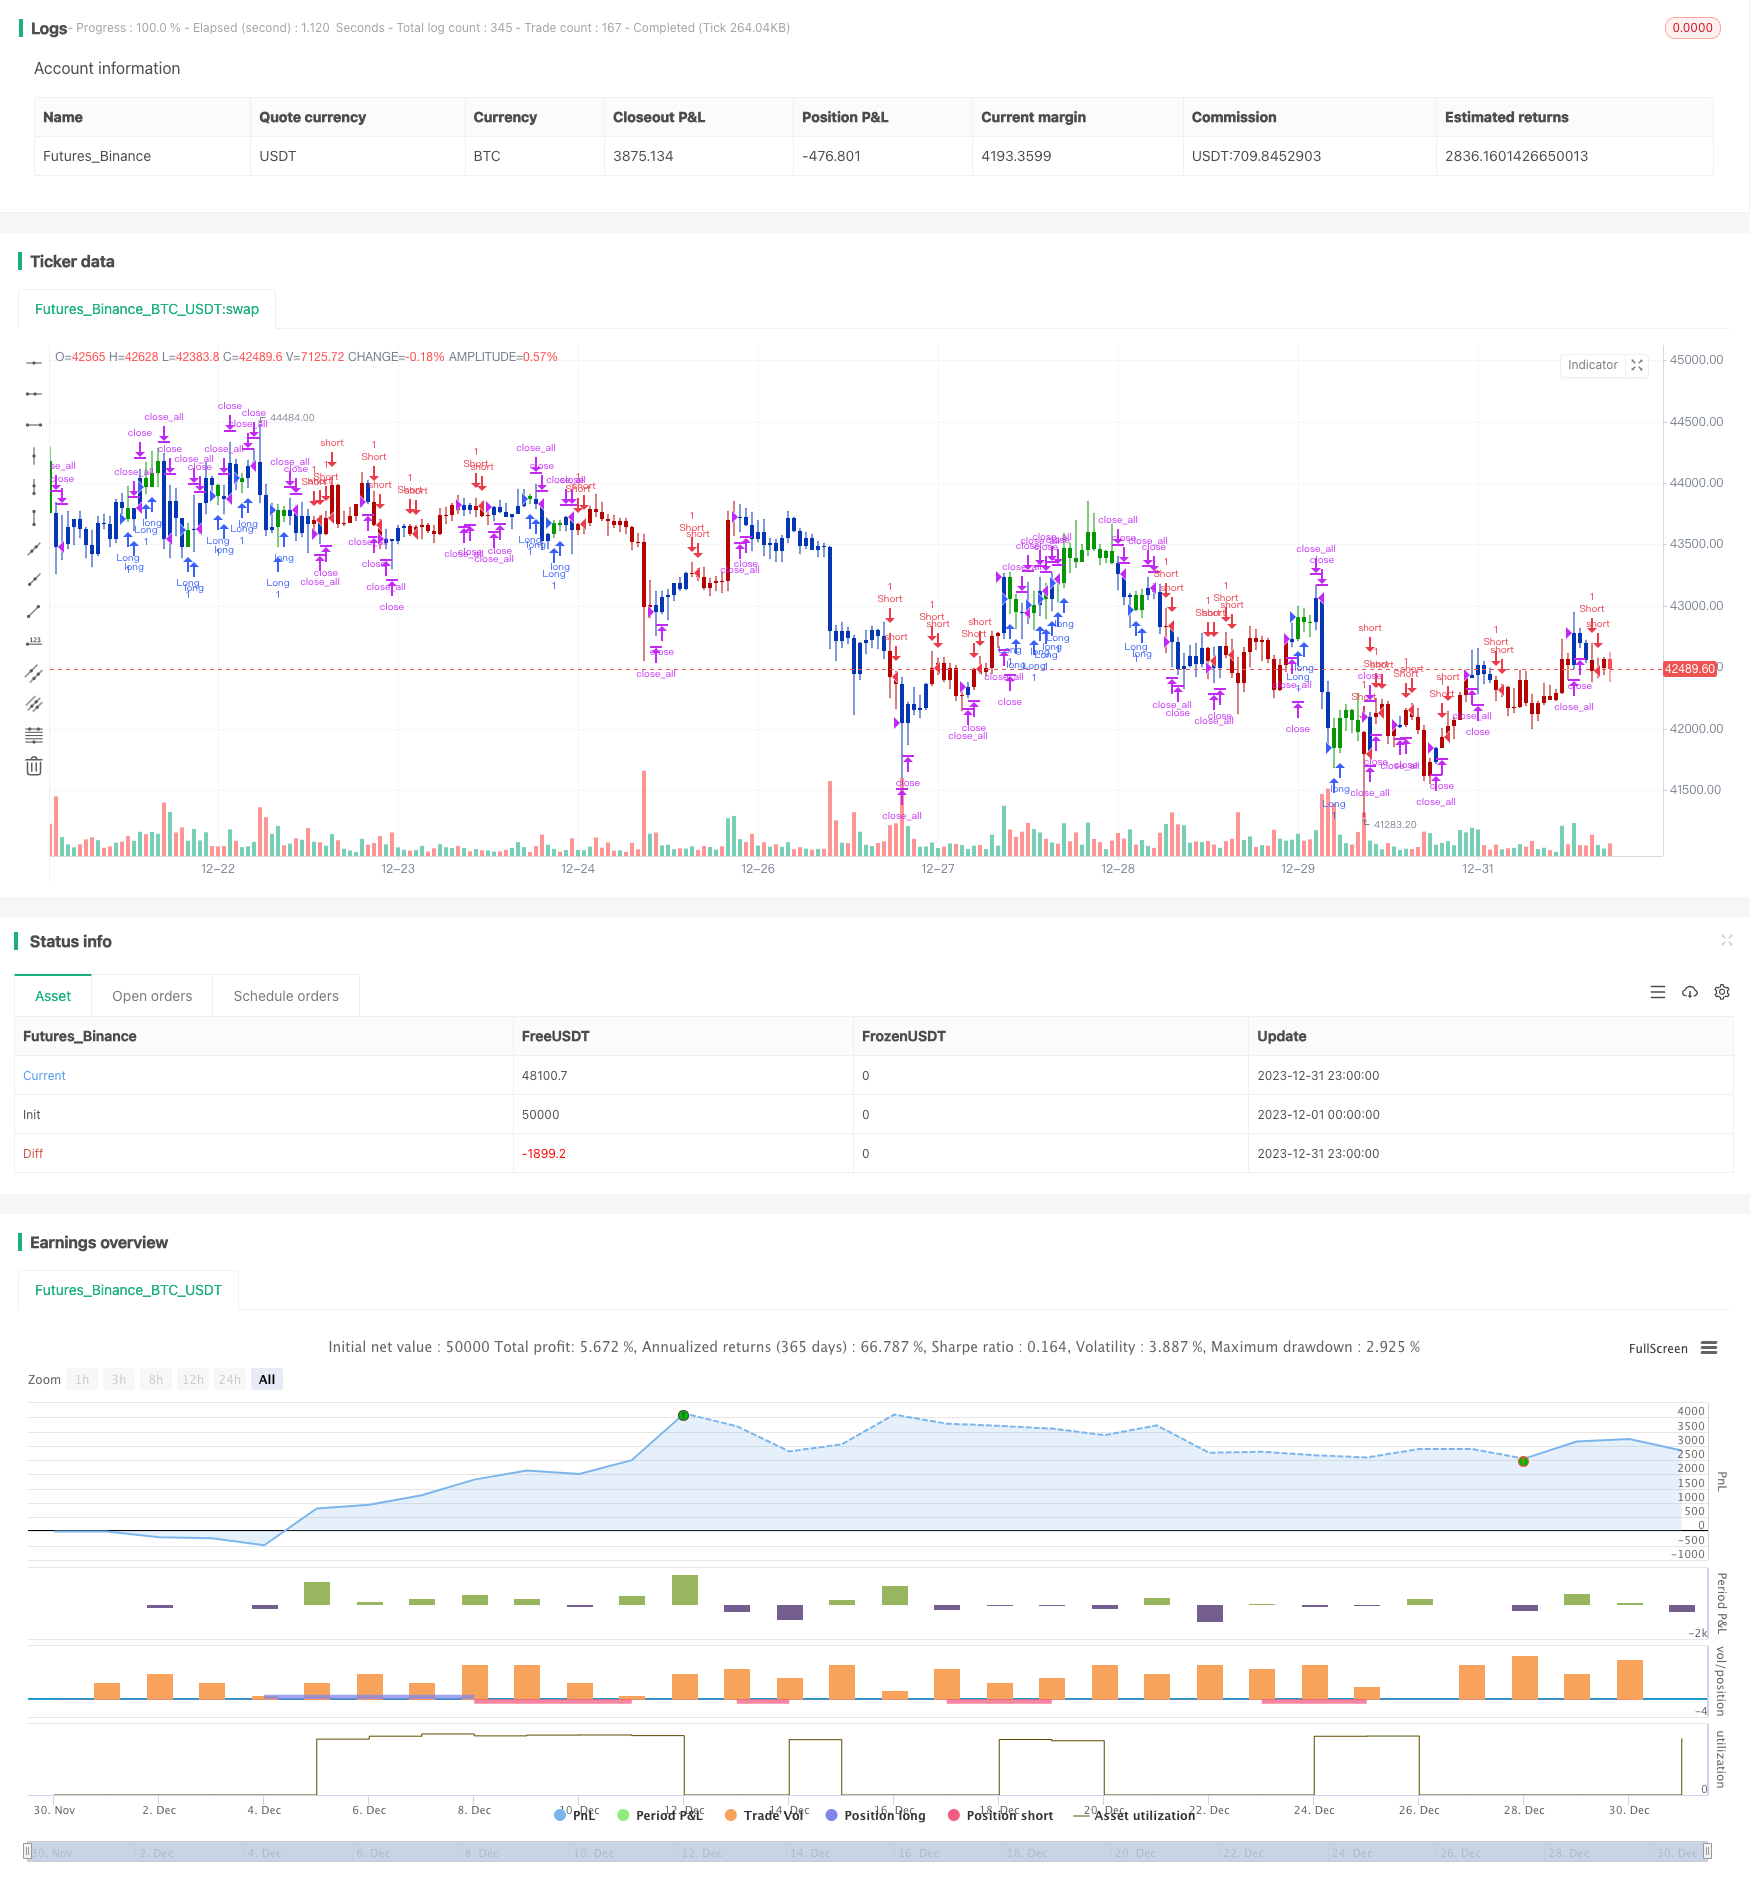
Chiến lược kết hợp hai đường trung bình động và đường trung bình Williams
Tác giả:ChaoZhangTags:

Tổng quan
Chiến lược logic
Chiến lược này bao gồm hai tiểu chiến lược:
Phân tích lợi thế
Phân tích rủi ro
Hướng dẫn tối ưu hóa
-
Điều chỉnh các thông số của các đường trung bình động kép để thích nghi với các loại và chu kỳ khác nhau.
-
Đưa ra các thuật toán học máy để tự động tối ưu hóa các thông số.
Kết luận
/*backtest
start: 2023-12-01 00:00:00
end: 2023-12-31 23:59:59
period: 1h
basePeriod: 15m
exchanges: [{"eid":"Futures_Binance","currency":"BTC_USDT"}]
*/

//@version=5
////////////////////////////////////////////////////////////
//  Copyright by HPotter v1.0 21/04/2022
// This is combo strategies for get a cumulative signal.
//
// First strategy
// This indicator plots 2/20 exponential moving average. For the Mov
// Avg X 2/20 Indicator, the EMA bar will be painted when the Alert criteria is met.
//
// Second strategy
// This indicator calculates 3 Moving Averages for default values of
// 13, 8 and 5 days, with displacement 8, 5 and 3 days: Median Price (High+Low/2).
// The most popular method of interpreting a moving average is to compare
// the relationship between a moving average of the security's price with
// the security's price itself (or between several moving averages).
//
//
// WARNING:
// - For purpose educate only
// - This script to change bars colors.
////////////////////////////////////////////////////////////
EMA20(Length) =>
    pos = 0.0
    xPrice = close
    xXA = ta.ema(xPrice, Length)
    nHH = math.max(high, high[1])
    nLL = math.min(low, low[1])
    nXS = nLL > xXA or nHH < xXA ? nLL : nHH
    iff_1 = nXS < close[1] ? 1 : nz(pos[1], 0)
    pos := nXS > close[1] ? -1 : iff_1
    pos


BWA3Lines(LLength,MLength,SLength,LOffset,MOffset,SOffset) =>
    pos = 0.0
    xLSma = ta.sma(hl2, LLength)[LOffset]
    xMSma = ta.sma(hl2, MLength)[MOffset]
    xSSma = ta.sma(hl2, SLength)[SOffset]
    pos := close < xSSma and xSSma < xMSma and xMSma < xLSma ? -1 :
    	     close > xSSma and xSSma > xMSma and xMSma > xLSma ? 1 : nz(pos[1], 0)
    pos

strategy(title='Combo 2/20 EMA & Bill Williams Averages. 3Lines', shorttitle='Combo', overlay=true)
var I1 = '●═════ 2/20 EMA ═════●'
Length = input.int(14, minval=1, group=I1)
var I2 = '●═════ 3Lines ═════●'
LLength = input.int(13, minval=1, group=I2)
MLength = input.int(8,minval=1, group=I2)
SLength = input.int(5,minval=1, group=I2)
LOffset = input.int(8,minval=1, group=I2)
MOffset = input.int(5,minval=1, group=I2)
SOffset = input.int(3,minval=1, group=I2)
var misc = '●═════ MISC ═════●'
reverse = input.bool(false, title='Trade reverse', group=misc)
var timePeriodHeader = '●═════ Time Start ═════●'
d = input.int(1, title='From Day', minval=1, maxval=31, group=timePeriodHeader)
m = input.int(1, title='From Month', minval=1, maxval=12, group=timePeriodHeader)
y = input.int(2005, title='From Year', minval=0, group=timePeriodHeader)
StartTrade = time > timestamp(y, m, d, 00, 00) ? true : false
posEMA20 = EMA20(Length)
prePosBWA3Lines = BWA3Lines(LLength,MLength,SLength,LOffset,MOffset,SOffset)
iff_1 = posEMA20 == -1 and prePosBWA3Lines == -1 and StartTrade ? -1 : 0
pos = posEMA20 == 1 and prePosBWA3Lines == 1 and StartTrade ? 1 : iff_1
iff_2 = reverse and pos == -1 ? 1 : pos
possig = reverse and pos == 1 ? -1 : iff_2
if possig == 1
    strategy.entry('Long', strategy.long)
if possig == -1
    strategy.entry('Short', strategy.short)
if possig == 0
    strategy.close_all()
barcolor(possig == -1 ? #b50404 : possig == 1 ? #079605 : #0536b3)
Thêm nữa
- Chiến lược đột phá kênh trung bình di chuyển
- Chiến lược thử nghiệm phân hủy thời gian cố định
- Chiến lược MACD đa khung thời gian tối ưu hóa thời gian và không gian
- Chiến lược giao dịch định lượng dựa trên Stock RSI và MFI
- Chiến lược giao dịch tổng hợp đa chỉ số
- Chiến lược giao dịch ngắn hạn giữa EMA
- Xu hướng theo chiến lược dựa trên lệnh dừng lỗ động của giao dịch chéo EMA kép
- Thị trường tăng đột phá Darvas Box mua chiến lược
- Chiến lược động lực tương đối
- Xu hướng sóng và xu hướng dựa trên VWMA sau chiến lược lượng
- Chiến lược siêu xu hướng ba lần thích nghi
- Chiến lược chéo trung bình di chuyển
- Market Cypher Wave B Chiến lược giao dịch tự động
- Chiến lược kiểm tra ngược chính
- Chiến lược kiểm tra ngược nến
- Chiến lược RSI Stochastic được làm mịn bởi Ehlers
- Chiến lược giao dịch đảo ngược động lực