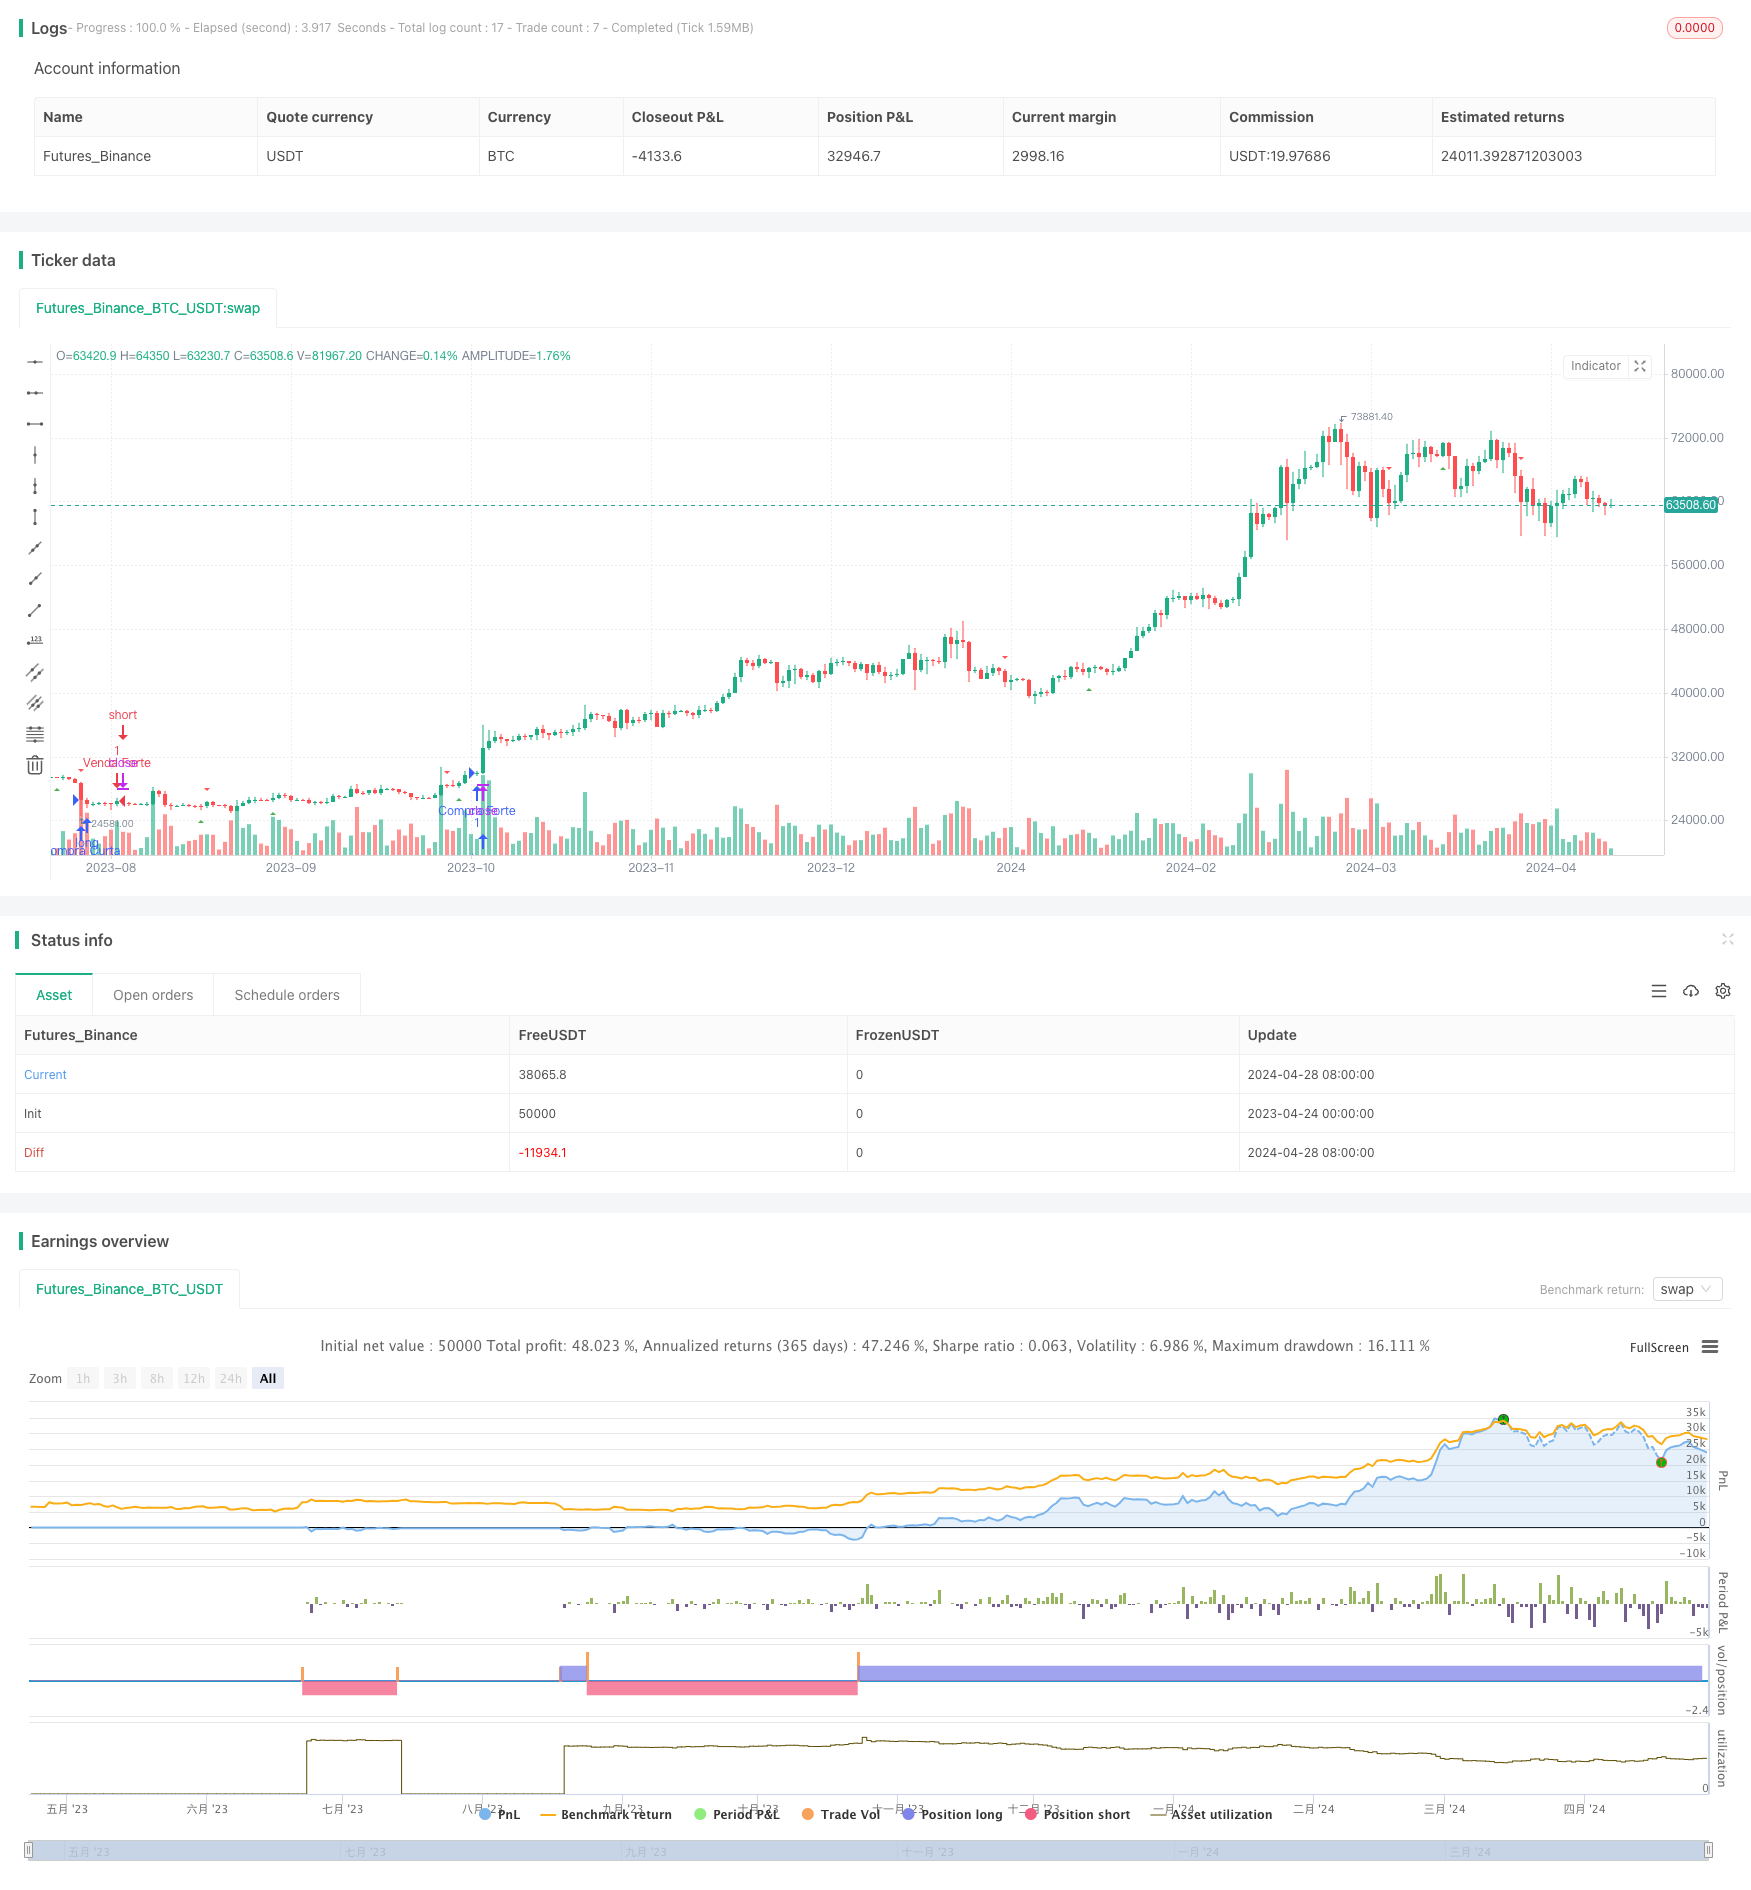
概述
该策略结合了多个移动平均线和相对强弱指数(RSI)来生成交易信号。它使用了9日、21日、25日和99日四个不同周期的移动平均线,通过它们之间的交叉来判断趋势的方向。同时,该策略还引入了RSI指标作为辅助判断,在市场超买或超卖时提供额外的交易信号。
该策略的主要思路是利用不同周期移动平均线的趋势特性,通过它们的多头排列和空头排列来判断市场的主要趋势。短期均线向上穿越长期均线被视为看涨信号,反之则被视为看跌信号。RSI指标则用于判断市场情绪,在市场超买或超卖时提供反转信号。
策略原理
- 计算9日、21日、25日和99日四个不同周期的简单移动平均线。
- 判断9日均线和21日均线的交叉情况,当9日均线向上穿越21日均线时,产生做多信号;当9日均线向下穿越21日均线时,产生做空信号。
- 判断25日均线和99日均线的交叉情况,当25日均线向上穿越99日均线时,产生做多信号;当25日均线向下穿越99日均线时,产生做空信号。
- 计算14日RSI指标,当RSI大于70时,市场处于超买状态;当RSI小于30时,市场处于超卖状态。
- 综合移动平均线交叉信号和RSI信号,产生最终的交易信号:
- 当9日均线向上穿越21日均线,且RSI大于70时,开空仓;
- 当9日均线向下穿越21日均线,且RSI小于30时,开多仓;
- 当25日均线向上穿越99日均线,且RSI大于70时,开多仓;
- 当25日均线向下穿越99日均线,且RSI小于30时,开空仓。
- 移动平均线交叉信号还用于平仓,当相应的均线交叉出现时,平掉之前的仓位。
优势分析
- 趋势跟踪:该策略利用了不同周期移动平均线的趋势特性,通过它们的多头排列和空头排列来判断市场的主要趋势,有助于把握市场的大方向。
- 过滤噪音:相比于使用单一移动平均线,该策略采用了多个不同周期的移动平均线,有助于过滤短期噪音,提高信号的可靠性。
- 情绪判断:引入RSI指标作为辅助判断,在市场情绪过于乐观或悲观时提供反转信号,可以一定程度上防止策略在市场极端状态下出现较大回撤。
- 逻辑清晰:策略的交易逻辑简单明了,易于理解和实现。
- 适应性强:该策略可以通过调整移动平均线的周期和RSI的参数,适应不同的市场环境和交易品种。
风险分析
- 参数敏感:策略的表现可能对移动平均线的周期选择和RSI的参数设置比较敏感,不同的参数可能导致策略表现差异较大。
- 趋势识别滞后:移动平均线本质上是一个滞后指标,在市场转折点上可能出现一定的滞后,导致错失交易机会或产生错误信号。
- 震荡市中表现欠佳:在震荡市场中,频繁的均线交叉可能导致策略产生较多的交易信号,表现可能不太理想。
- 黑天鹅事件:该策略主要基于历史数据进行判断,对于一些突发的黑天鹅事件可能反应不足。
优化方向
- 参数优化:对移动平均线的周期和RSI的参数进行优化,找到在特定市场中表现最佳的参数组合。可以使用遗传算法等优化方法来自动寻找最优参数。
- 信号过滤:在均线交叉和RSI信号的基础上,引入其他技术指标或价格行为模式进行二次过滤,提高信号的准确性。例如,可以结合布林带、MACD等指标。
- 仓位管理:在当前策略的基础上,引入仓位管理的概念,根据市场趋势的强度和确定性动态调整仓位大小,以更好地控制风险和提高收益。
- 止损止盈:引入止损和止盈机制,特别是波动性止损或跟踪止损,以控制单次交易的最大风险敞口。
- 多市场适应:将策略拓展至多个市场和品种,通过适当的参数调整和风险控制,捕捉不同市场的交易机会。
总结
该策略通过结合不同周期的移动平均线和RSI指标,形成了一个趋势跟踪和情绪判断的交易策略。它的优势在于逻辑清晰、适应性强,通过多均线的配合能较好地把握市场趋势。但同时也存在参数敏感、趋势识别滞后、震荡市表现欠佳等风险。未来可以通过参数优化、信号过滤、仓位管理、止损止盈等方面的改进,进一步提升策略的性能和稳健性。
策略源码
/*backtest
start: 2023-04-24 00:00:00
end: 2024-04-29 00:00:00
period: 1d
basePeriod: 1h
exchanges: [{"eid":"Futures_Binance","currency":"BTC_USDT"}]
*/

//@version=5
strategy("Estratégia de Médias Móveis e RSI (por Svitorino_trade)", shorttitle="Estratégia-Médias Móveis", overlay=true)

len1 = input.int(9, minval=1, title="Length 1")
len2 = input.int(21, minval=1, title="Length 2")
len3 = input.int(25, minval=1, title="Length 3")
len4 = input.int(99, minval=1, title="Length 4")
rsi_length = input.int(14, minval=1, title="RSI Length")
rsi_oversold = input.float(30, minval=0, maxval=100, title="RSI Oversold Level")
rsi_overbought = input.float(70, minval=0, maxval=100, title="RSI Overbought Level")

src = input(close, title="Source")

ama(src, length) =>
    sum = 0.0
    for i = 0 to length - 1
        sum := sum + src[i]
    sum / length

avg1 = ama(src, len1)
avg2 = ama(src, len2)
avg3 = ama(src, len3)
avg4 = ama(src, len4)

rsi_value = ta.rsi(src, rsi_length)

// Condições de entrada e saída para períodos de 9 e 21
cruzamento_9_21_acima = avg1 > avg2 and avg1[1] <= avg2[1]
cruzamento_9_21_abaixo = avg1 < avg2 and avg1[1] >= avg2[1]

// Condições de entrada e saída para períodos de 25 e 99
cruzamento_25_99_acima = avg3 > avg4 and avg3[1] <= avg4[1]
cruzamento_25_99_abaixo = avg3 < avg4 and avg3[1] >= avg4[1]

// Plotando os sinais de entrada e saída
plotshape(series=cruzamento_9_21_acima, style=shape.triangleup, color=color.green, size=size.small, location=location.belowbar)
plotshape(series=cruzamento_9_21_abaixo, style=shape.triangledown, color=color.red, size=size.small, location=location.abovebar)
plotshape(series=cruzamento_25_99_acima, style=shape.triangleup, color=color.green, size=size.small, location=location.belowbar)
plotshape(series=cruzamento_25_99_abaixo, style=shape.triangledown, color=color.red, size=size.small, location=location.abovebar)

// Entradas e saídas para períodos de 9 e 21
if cruzamento_9_21_acima and rsi_value > rsi_overbought
    strategy.entry("Venda Curta", strategy.short)
if cruzamento_9_21_abaixo and rsi_value < rsi_oversold
    strategy.entry("Compra Curta", strategy.long)
if cruzamento_9_21_acima
    strategy.close("Compra Curta")
if cruzamento_9_21_abaixo
    strategy.close("Venda Curta")

// Entradas e saídas para períodos de 25 e 99
if cruzamento_25_99_acima and rsi_value > rsi_overbought
    strategy.entry("Compra Forte", strategy.long)
if cruzamento_25_99_abaixo and rsi_value < rsi_oversold
    strategy.entry("Venda Forte", strategy.short)
if cruzamento_25_99_acima
    strategy.close("Venda Forte")
if cruzamento_25_99_abaixo
    strategy.close("Compra Forte")
相关推荐