概述
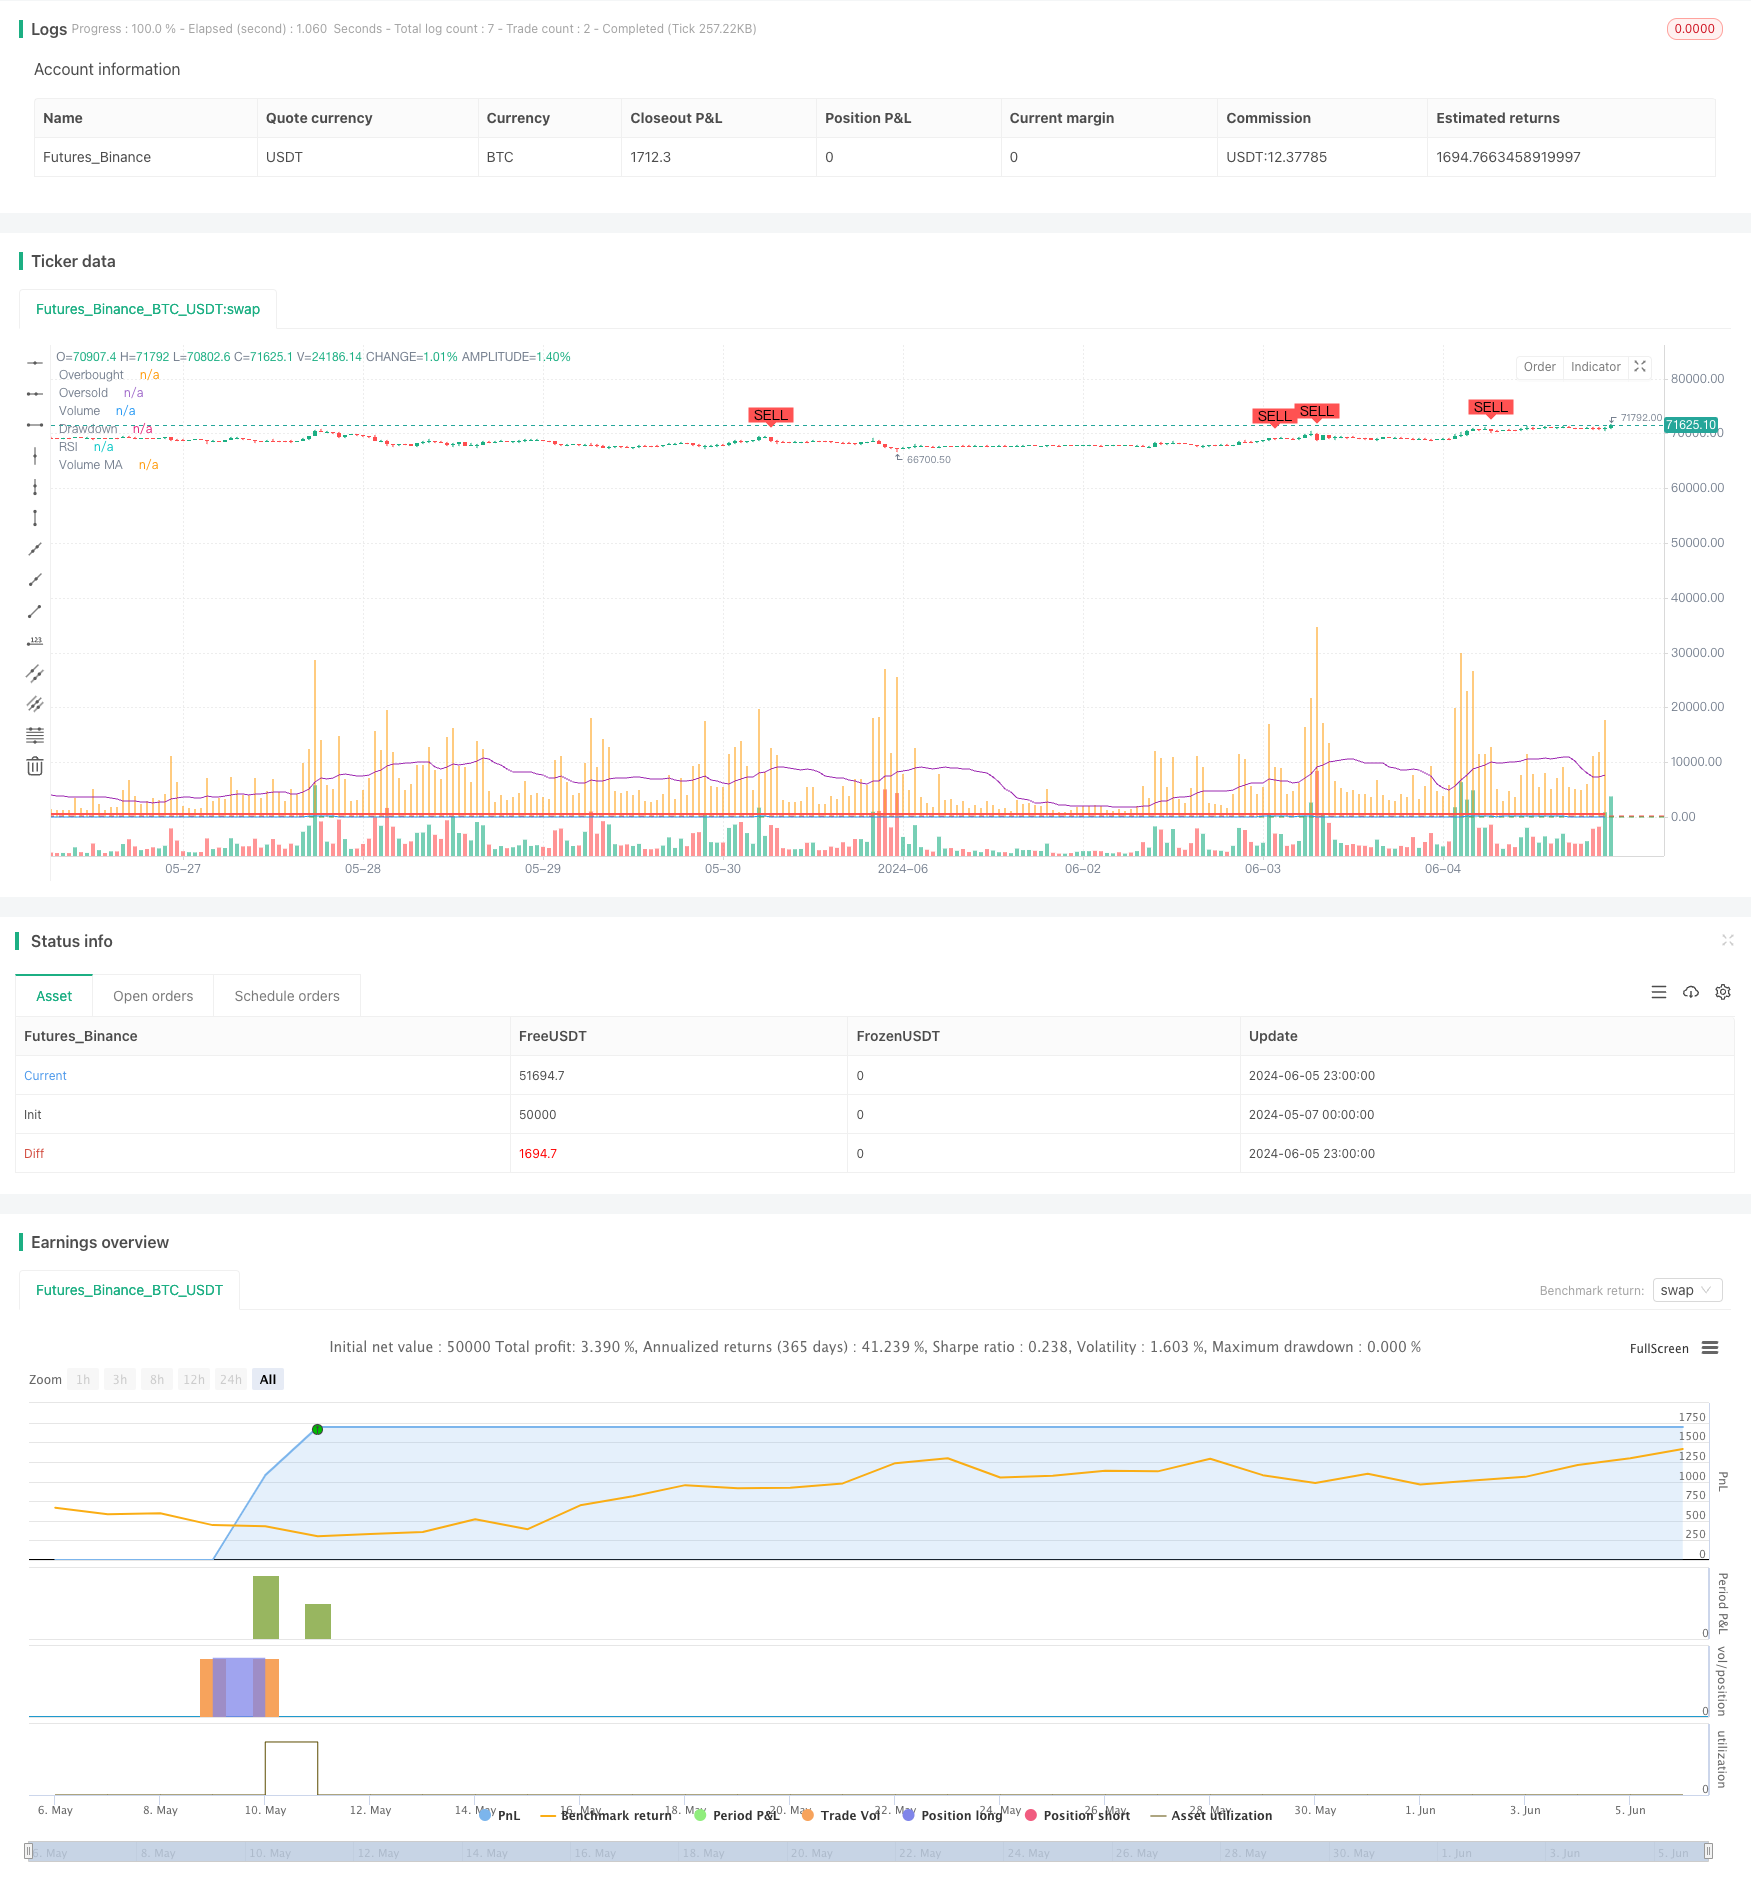
该策略基于Wyckoff方法论,结合相对强弱指数(RSI)和成交量移动平均线(Volume MA)来识别市场的累积和分配阶段,从而产生买卖信号。同时,该策略采用动态回撤止损机制,通过设置最大回撤阈值来控制风险。
策略原理
- 计算RSI指标和成交量移动平均线。
- 当RSI从超卖区域向上穿越,且成交量大于成交量移动平均线时,识别为市场accumulation阶段,产生买入信号。
- 当RSI从超买区域向下穿越,且成交量大于成交量移动平均线时,识别为市场distribution阶段,产生卖出信号。
- 策略同时跟踪账户的最大净值和当前回撤。如果当前回撤超过设定的最大回撤阈值,策略将平仓所有头寸。
- 买入头寸在distribution阶段或回撤超过最大回撤时平仓,卖出头寸在accumulation阶段或回撤超过最大回撤时平仓。
策略优势
- 结合RSI和成交量指标,能够更准确地捕捉市场的accumulation和distribution阶段。
- 采用动态回撤止损机制,可以有效控制策略的最大回撤,降低策略的整体风险。
- 适用于5分钟的高频数据,可以快速响应市场变化,及时调整仓位。
策略风险
- RSI和成交量指标在某些市场情况下可能会产生误导性信号,导致策略产生错误的交易决策。
- 最大回撤阈值的设置需要根据市场特点和个人风险偏好进行调整,不恰当的设置可能导致策略过早平仓或承担过大风险。
- 策略在震荡市场中可能会频繁产生交易信号,增加交易成本。
策略优化方向
- 可以考虑引入其他技术指标,如MACD、布林带等,以提高策略的信号准确性。
- 对RSI和成交量指标的参数进行优化,如调整RSI的长度、超买超卖阈值等,以适应不同的市场状况。
- 在回撤止损之外,可以加入移动止损或利润保护机制,以进一步控制风险和锁定利润。
总结
RSI动态回撤止损策略通过结合RSI和成交量指标,识别市场的累积和分配阶段,同时采用动态回撤止损机制控制风险。该策略在把握市场趋势的同时,也兼顾了风险管理,具有一定的实用性。但是,策略的表现依赖于指标参数的选择和市场特点,需要通过不断的优化和调整来提高其稳定性和盈利能力。
策略源码
/*backtest
start: 2024-05-07 00:00:00
end: 2024-06-06 00:00:00
period: 1h
basePeriod: 15m
exchanges: [{"eid":"Futures_Binance","currency":"BTC_USDT"}]
*/

//@version=5
strategy("Wyckoff Methodology Strategy with Max Drawdown", overlay=true)

// Define input parameters
length = input(14, title="RSI Length")
overbought = input(70, title="RSI Overbought Level")
oversold = input(30, title="RSI Oversold Level")
volume_length = input(20, title="Volume MA Length")
initial_capital = input(10000, title="Initial Capital")
max_drawdown = input(500, title="Max Drawdown")

// Calculate RSI
rsi = ta.rsi(close, length)

// Calculate Volume Moving Average
vol_ma = ta.sma(volume, volume_length)

// Identify Accumulation Phase
accumulation = ta.crossover(rsi, oversold) and volume > vol_ma

// Identify Distribution Phase
distribution = ta.crossunder(rsi, overbought) and volume > vol_ma

// Plot RSI
hline(overbought, "Overbought", color=color.red)
hline(oversold, "Oversold", color=color.green)
plot(rsi, title="RSI", color=color.blue)

// Plot Volume and Volume Moving Average
plot(volume, title="Volume", color=color.orange, style=plot.style_histogram)
plot(vol_ma, title="Volume MA", color=color.purple)

// Variables to track drawdown
var float max_equity = initial_capital
var float drawdown = 0.0

// Update max equity and drawdown
current_equity = strategy.equity
if (current_equity > max_equity)
    max_equity := current_equity
drawdown := max_equity - current_equity

// Generate Buy and Sell Signals
if (accumulation and drawdown < max_drawdown)
    strategy.entry("Buy", strategy.long)
if (distribution and drawdown < max_drawdown)
    strategy.entry("Sell", strategy.short)

// Plot Buy and Sell signals on chart
plotshape(series=accumulation, location=location.belowbar, color=color.green, style=shape.labelup, title="Buy Signal", text="BUY")
plotshape(series=distribution, location=location.abovebar, color=color.red, style=shape.labeldown, title="Sell Signal", text="SELL")

// Close positions if drawdown exceeds max drawdown
if (drawdown >= max_drawdown)
    strategy.close_all("Max Drawdown Exceeded")

// Set strategy exit conditions
strategy.close("Buy", when=distribution or drawdown >= max_drawdown)
strategy.close("Sell", when=accumulation or drawdown >= max_drawdown)

// Display drawdown on chart
plot(drawdown, title="Drawdown", color=color.red, linewidth=2, style=plot.style_stepline)
相关推荐