概述
本文介绍了一个基于多条移动平均线的趋势交易策略——”基于多均线的趋势交易策略”。该策略主要应用于纳斯达克期货市场,通过分析价格相对于长、中、短期移动平均线的位置,捕捉市场的上涨趋势,并在特定的时间点平仓所有头寸。
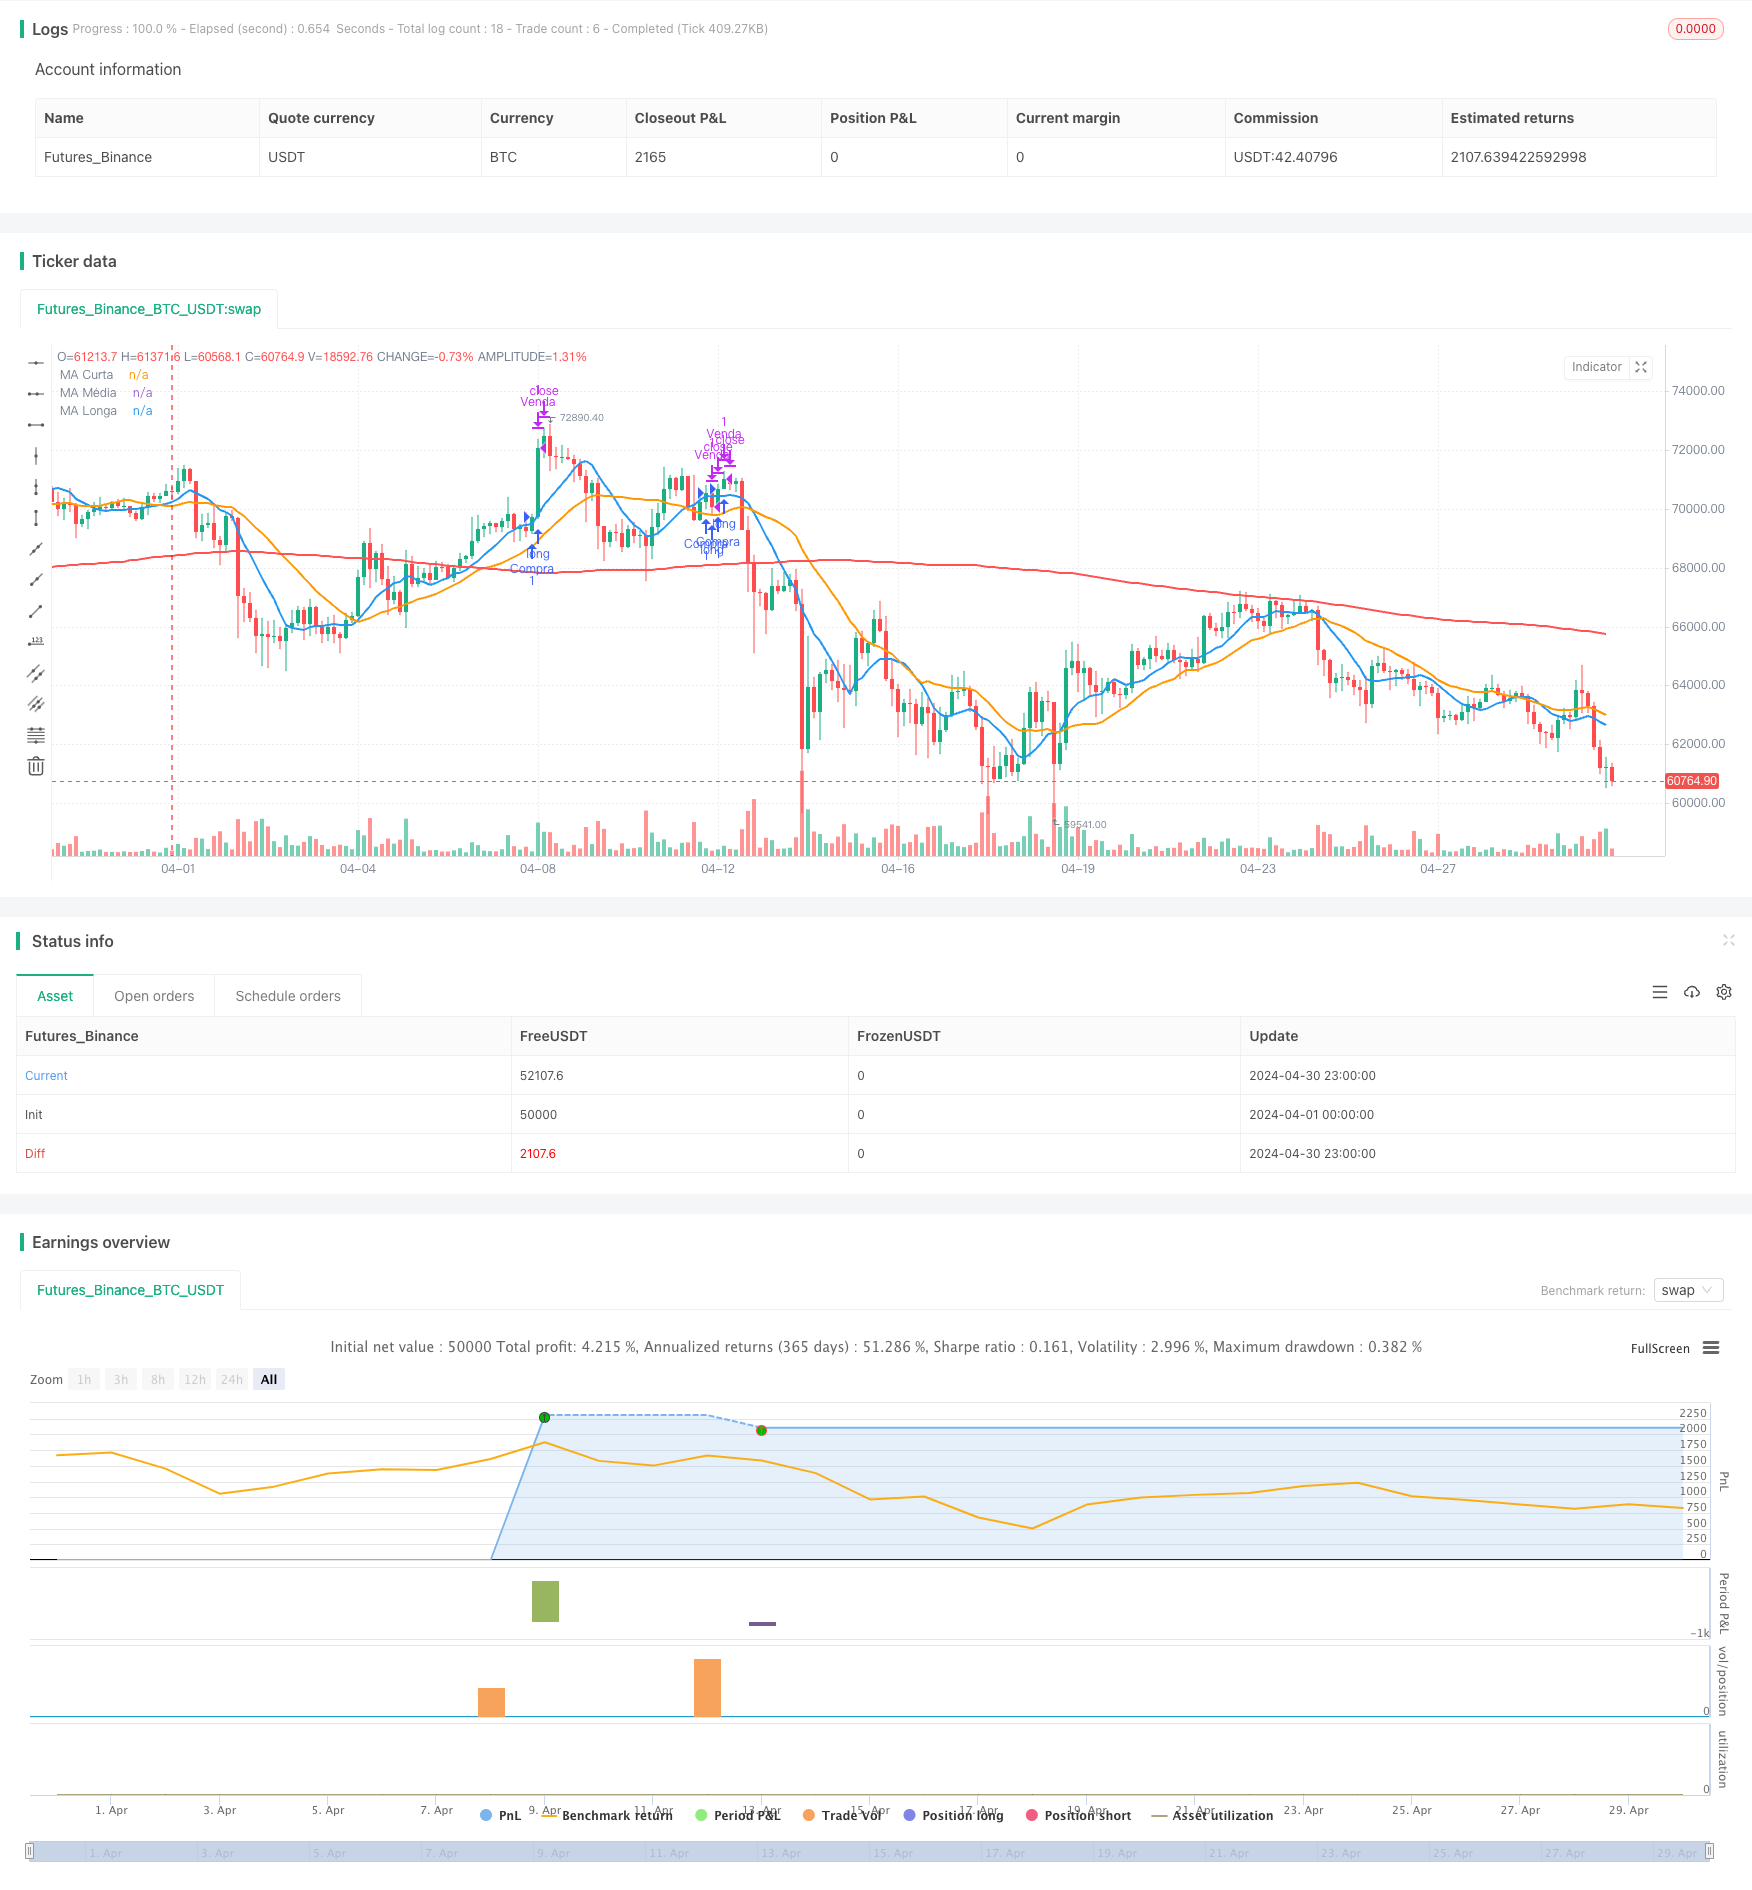
该策略使用了三条简单移动平均线(SMA):长期(默认为200周期)、中期(默认为21周期)和短期(默认为9周期)。当价格高于长期和中期均线,且在短期均线上出现交叉时,策略会触发买入信号。同时,策略还设置了固定点数的止盈和止损,以控制风险。此外,该策略会在每个交易日的17:00平仓所有头寸。
策略原理
计算长期(默认200周期)、中期(默认21周期)和短期(默认9周期)的简单移动平均线。
判断当前价格是否高于长期均线和中期均线。
判断当前价格是否在短期均线上方交叉。
当条件2和条件3同时满足,且当前无持仓时,触发买入信号。
买入后,设置固定点数的止盈和止损位,当价格触及止盈或止损价位时平仓。
在每个交易日的17:00,平仓所有头寸。
策略优势
简单易懂:该策略基于移动平均线,原理简单,易于理解和实现。
趋势跟踪:通过分析价格相对于不同周期均线的位置,策略能够有效捕捉市场的上涨趋势。
风险控制:策略设置了固定点数的止盈和止损,有助于控制单笔交易的风险。
自动平仓:策略会在每个交易日的特定时间自动平仓,避免隔夜风险。
策略风险
参数优化:策略的表现可能对均线周期参数敏感,需要根据不同市场和品种进行优化。
震荡市:在震荡市场环境下,频繁的交叉信号可能导致策略表现欠佳。
滑点风险:在市场波动剧烈时,固定点数的止盈和止损可能无法按预期执行,导致滑点风险。
策略优化方向
动态止盈止损:根据市场波动性或价格走势,动态调整止盈和止损点位,以优化风险收益比。
趋势过滤:引入其他技术指标,如ADX等,以确认趋势强度,过滤震荡市中的虚假信号。
多品种适应:对策略进行改进,以适应不同的期货品种和市场特点。
资金管理:引入更为复杂的资金管理规则,如仓位管理和风险控制,提升策略的稳健性。
总结
“基于多均线的趋势交易策略”是一个简单易懂的趋势跟踪策略,通过分析价格相对于不同周期均线的位置,捕捉市场的上涨趋势。该策略设置了固定点数的止盈止损,并在每日特定时间自动平仓,以控制风险。然而,策略在震荡市中表现可能欠佳,并面临参数优化和滑点风险等问题。未来可以通过引入动态止盈止损、趋势过滤、多品种适应和资金管理等方面的优化,进一步提升策略的稳健性和适应性。
/*backtest
start: 2024-04-01 00:00:00
end: 2024-04-30 23:59:59
period: 3h
basePeriod: 15m
exchanges: [{"eid":"Futures_Binance","currency":"BTC_USDT"}]
*/

//@version=5
strategy("Médias Móveis de MarcosJR", overlay=true)

// Inputs para data inicial e final
start_year = input.int(2020, title="Ano Inicial")
start_month = input.int(1, title="Mês Inicial")
start_day = input.int(1, title="Dia Inicial")

end_year = input.int(2020, title="Ano Final")
end_month = input.int(12, title="Mês Final")
end_day = input.int(31, title="Dia Final")

// Convertendo dia, mês e ano para timestamp
start_date = timestamp(start_year, start_month, start_day, 00, 00)
end_date = timestamp(end_year, end_month, end_day, 23, 59)

// Condição para verificar se a data está dentro do intervalo especificado
date_within_range = true

// Parâmetros para os períodos das médias móveis
ma_short_period = input.int(9, title="MA Curta")
ma_medium_period = input.int(21, title="MA Média")
ma_long_period = input.int(200, title="MA Longa")

// Definindo médias móveis
ma_short = ta.sma(close, ma_short_period)
ma_medium = ta.sma(close, ma_medium_period)
ma_long = ta.sma(close, ma_long_period)

// Plotando as médias móveis no gráfico com espessura aumentada
plot(ma_short, color=color.blue, title="MA Curta", linewidth=2)
plot(ma_medium, color=color.orange, title="MA Média", linewidth=2)
plot(ma_long, color=color.red, title="MA Longa", linewidth=2)

// Verificando se o preço está acima das médias móveis
above_ma_long = close > ma_long
above_ma_medium = close > ma_medium

// Verificando se o preço tocou na média móvel curta
touch_ma_short = ta.crossover(close, ma_short)

// Condições de compra
buy_condition = date_within_range and above_ma_long and above_ma_medium and touch_ma_short

// Sinais de entrada e saída de compra
var float entry_price = na
if (buy_condition and strategy.opentrades == 0) // Verifica se não há operações em andamento
    entry_price := close // Define o preço de entrada ao comprar

// Parâmetros para o tamanho do stop gain e stop loss em pontos
stop_gain_points = input.int(100, title="Stop Gain (pontos)", minval=1)
stop_loss_points = input.int(100, title="Stop Loss (pontos)", minval=1)

// Calcular o preço de saída alvo (Stop Gain) e de stop loss
target_price = entry_price + stop_gain_points * syminfo.mintick
stop_loss_price = entry_price - stop_loss_points * syminfo.mintick

// Sair da operação de compra quando o preço atingir o stop gain ou stop loss
if (strategy.position_size > 0)
    strategy.exit("Venda", "Compra", limit=target_price, stop=stop_loss_price)

// Sinais de entrada de compra
if (buy_condition and strategy.opentrades == 0) // Verifica se não há operações em andamento
    strategy.entry("Compra", strategy.long)

// Plotando setas de compra
plotshape(series=buy_condition, title="Sinal de Compra", location=location.belowbar, color=color.green, style=shape.triangleup, size=size.small)

// Função para verificar se é 17:00 do mesmo dia
is_17_oclock_same_day = hour == 17 and minute == 0 and hour[1] < 17

// Sair de todas as operações às 17:00 do mesmo dia
if (is_17_oclock_same_day)
    strategy.close_all()