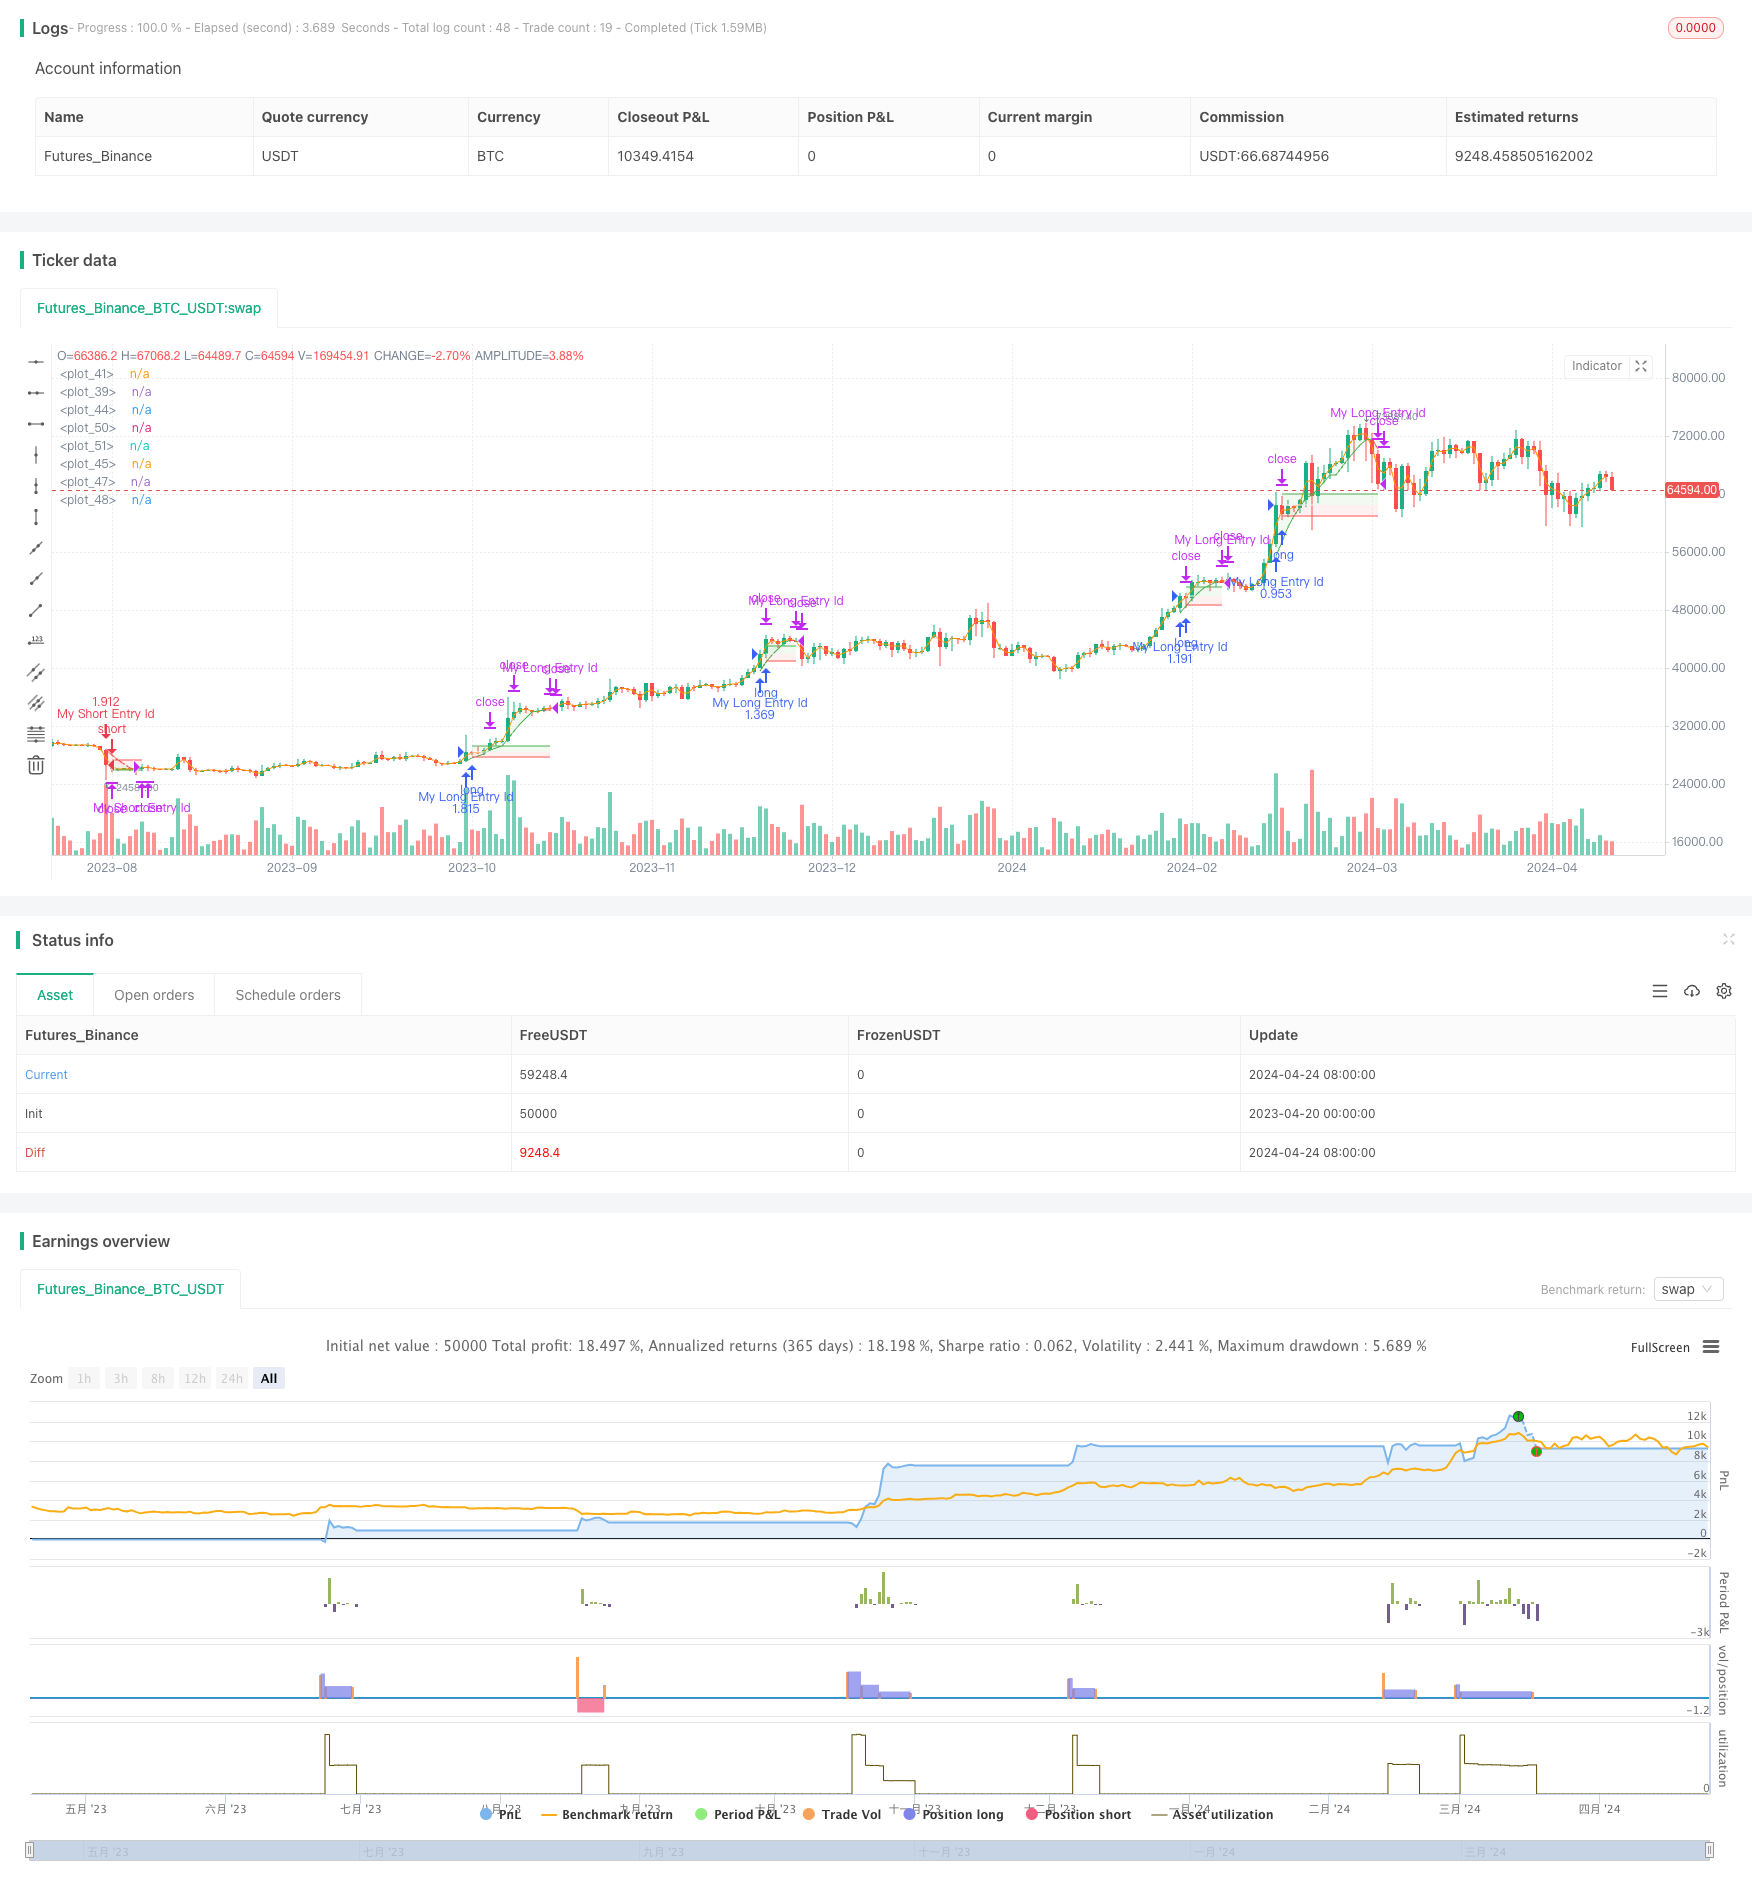
概述
趋势捕捉策略是一种利用独特方法检测趋势形成,并在趋势方向上开仓的策略。它通过计算一定范围内最高价和最低价的差值与该范围内所有K线长度之和的比值,得到一个称为”限度”的百分比值。该值越接近100,表示趋势越强。当该值超过设定的限度,并且移动平均线向上时,策略开多单;当该值超过设定的限度,并且移动平均线向下时,策略开空单。开仓后,策略在价格达到一定水平时平掉部分仓位,并将剩余仓位移动到认为趋势结束的点位。
策略原理
- 计算一定范围内最高价和最低价的差值,以及该范围内所有K线长度之和。
- 将差值除以K线长度之和,再乘以100得到一个百分比值,称为”限度”。
- 当限度超过设定值,并且移动平均线向上时,开多单;当限度超过设定值,并且移动平均线向下时,开空单。
- 开仓后,当价格达到止盈位平掉部分仓位,剩余仓位移动到止损位。
- 当移动平均线向下穿越时,平掉多单;当移动平均线向上穿越时,平掉空单。
策略优势
- 策略使用独特的方法检测趋势形成,通过计算限度值来判断趋势强度,有助于在趋势初期就开仓。
- 策略在开仓后,通过平掉部分仓位和移动剩余仓位的止损位来控制风险。
- 策略使用移动平均线的向上和向下穿越来判断趋势结束,有助于及时平仓。
策略风险
- 策略在趋势初期开仓,如果趋势不能持续,可能会造成损失。
- 策略使用固定的止盈和止损位,在某些情况下可能不够灵活。
- 策略只使用了移动平均线来判断趋势,可能会错过一些趋势机会。
策略优化方向
- 可以考虑使用其他指标来辅助判断趋势,如MACD、RSI等,以提高开仓的准确性。
- 可以根据市场波动性来动态调整止盈和止损位,以更好地控制风险。
- 可以考虑在趋势确认后再开仓,以降低趋势初期的风险。
总结
趋势捕捉策略使用独特的方法来检测趋势形成,并在趋势方向上开仓。它通过计算限度值来判断趋势强度,使用移动平均线的穿越来判断趋势结束。策略在开仓后通过平掉部分仓位和移动止损位来控制风险。但是,策略在趋势初期开仓可能面临一定风险,使用固定的止盈止损位可能不够灵活,只使用移动平均线判断趋势可能会错过一些机会。未来可以考虑引入其他指标、动态调整止盈止损位、在趋势确认后再开仓等方式来优化策略。
策略源码
/*backtest
start: 2023-04-20 00:00:00
end: 2024-04-25 00:00:00
period: 1d
basePeriod: 1h
exchanges: [{"eid":"Futures_Binance","currency":"BTC_USDT"}]
*/

// This source code is subject to the terms of the Mozilla Public License 2.0 at https://mozilla.org/MPL/2.0/
// © faytterro

//@version=5
strategy("Trend Catcher Strategy", overlay=true, default_qty_type = strategy.percent_of_equity, default_qty_value = 100)
len = input.int(10)
tp = input.float(2.5, step = 0.1)
sl = input.float(2.5, step = 0.1)
malen = input.int(5)
limit = input.int(50)
ma = ta.sma(close,malen)
sum = 0.0
for i = 0 to len-1
    sum := sum + high[i]-low[i]
frs = 100*(ta.highest(high,len)-ta.lowest(low,len))/sum
//hline(50)
//plot(frs, color = color.white)
l = ta.crossover(frs,limit) and ma>ma[1]
s = ta.crossover(frs,limit) and ma<ma[1]
cl = ma<ma[1]
cs = ma>ma[1]
qty_balance=input.int(50, maxval = 100)
if (l)
    strategy.entry("My Long Entry Id", strategy.long)
    strategy.exit("exit long", "My Long Entry Id", qty_percent = qty_balance, limit = close*(100+tp)/100, stop = close*(100-sl)/100)

if (s)
    strategy.entry("My Short Entry Id", strategy.short)
    strategy.exit("exit short", "My Short Entry Id", qty_percent = qty_balance, limit = close*(100-tp)/100, stop = close*(100+sl)/100)

if (cl)
    strategy.close("My Long Entry Id")
if (cs)
    strategy.close("My Short Entry Id")

l:= l and strategy.opentrades<1
s:= s and strategy.opentrades<1
transp = strategy.opentrades>0? 0 : 100
pma=plot(ma, color = ma<ma[1]? color.rgb(255, 82, 82, transp) : color.rgb(76, 175, 79, transp))
price = open/2+close/2
pprice = plot(price, display = display.none)
fill(pma,pprice, color = ma<ma[1]? color.rgb(255, 82, 82, transp+90) : color.rgb(76, 175, 79, transp+90))

spm=plot(ta.valuewhen(s,close,0), color = (strategy.opentrades>0 and ma<ma[1] and ma[1]<ma[2])? color.white : color.rgb(1,1,1,100), offset=1)
lpm=plot(ta.valuewhen(l,close,0), color = (strategy.opentrades>0 and ma>ma[1] and ma[1]>ma[2])? color.white : color.rgb(1,1,1,100), offset=1)

ltp=plot(ta.valuewhen(l,close,0)*(100+ta.valuewhen(l,tp,0))/100,  color = (strategy.opentrades>0 and ma>ma[1] and ma[1]>ma[2])? color.green : color.rgb(1,1,1,100), offset=1)
lsl=plot(ta.valuewhen(l,close,0)*(100-ta.valuewhen(l,sl,0))/100,  color = (strategy.opentrades>0 and ma>ma[1] and ma[1]>ma[2])? color.red : color.rgb(1,1,1,100), offset=1)

stp=plot(ta.valuewhen(s,close,0)*(100-ta.valuewhen(s,tp,0))/100, color = (strategy.opentrades>0 and ma<ma[1] and ma[1]<ma[2])? color.green : color.rgb(1,1,1,100), offset=1)
ssl=plot(ta.valuewhen(s,close,0)*(100+ta.valuewhen(s,sl,0))/100, color = (strategy.opentrades>0 and ma<ma[1] and ma[1]<ma[2])? color.red : color.rgb(1,1,1,100), offset=1)
fill(stp,spm, color = (strategy.opentrades>0 and ma<ma[1] and ma[1]<ma[2])? color.rgb(76, 175, 79, 90) : color.rgb(1,1,1,100))
fill(ssl,spm, color = (strategy.opentrades>0 and ma<ma[1] and ma[1]<ma[2])? color.rgb(255, 82, 82, 90) : color.rgb(1,1,1,100))
fill(ltp,lpm, color = (strategy.opentrades>0 and ma>ma[1] and ma[1]>ma[2])? color.rgb(76, 175, 79, 90) : color.rgb(1,1,1,100))
fill(lsl,lpm, color = (strategy.opentrades>0 and ma>ma[1] and ma[1]>ma[2])? color.rgb(255, 82, 82, 90) : color.rgb(1,1,1,100))
相关推荐