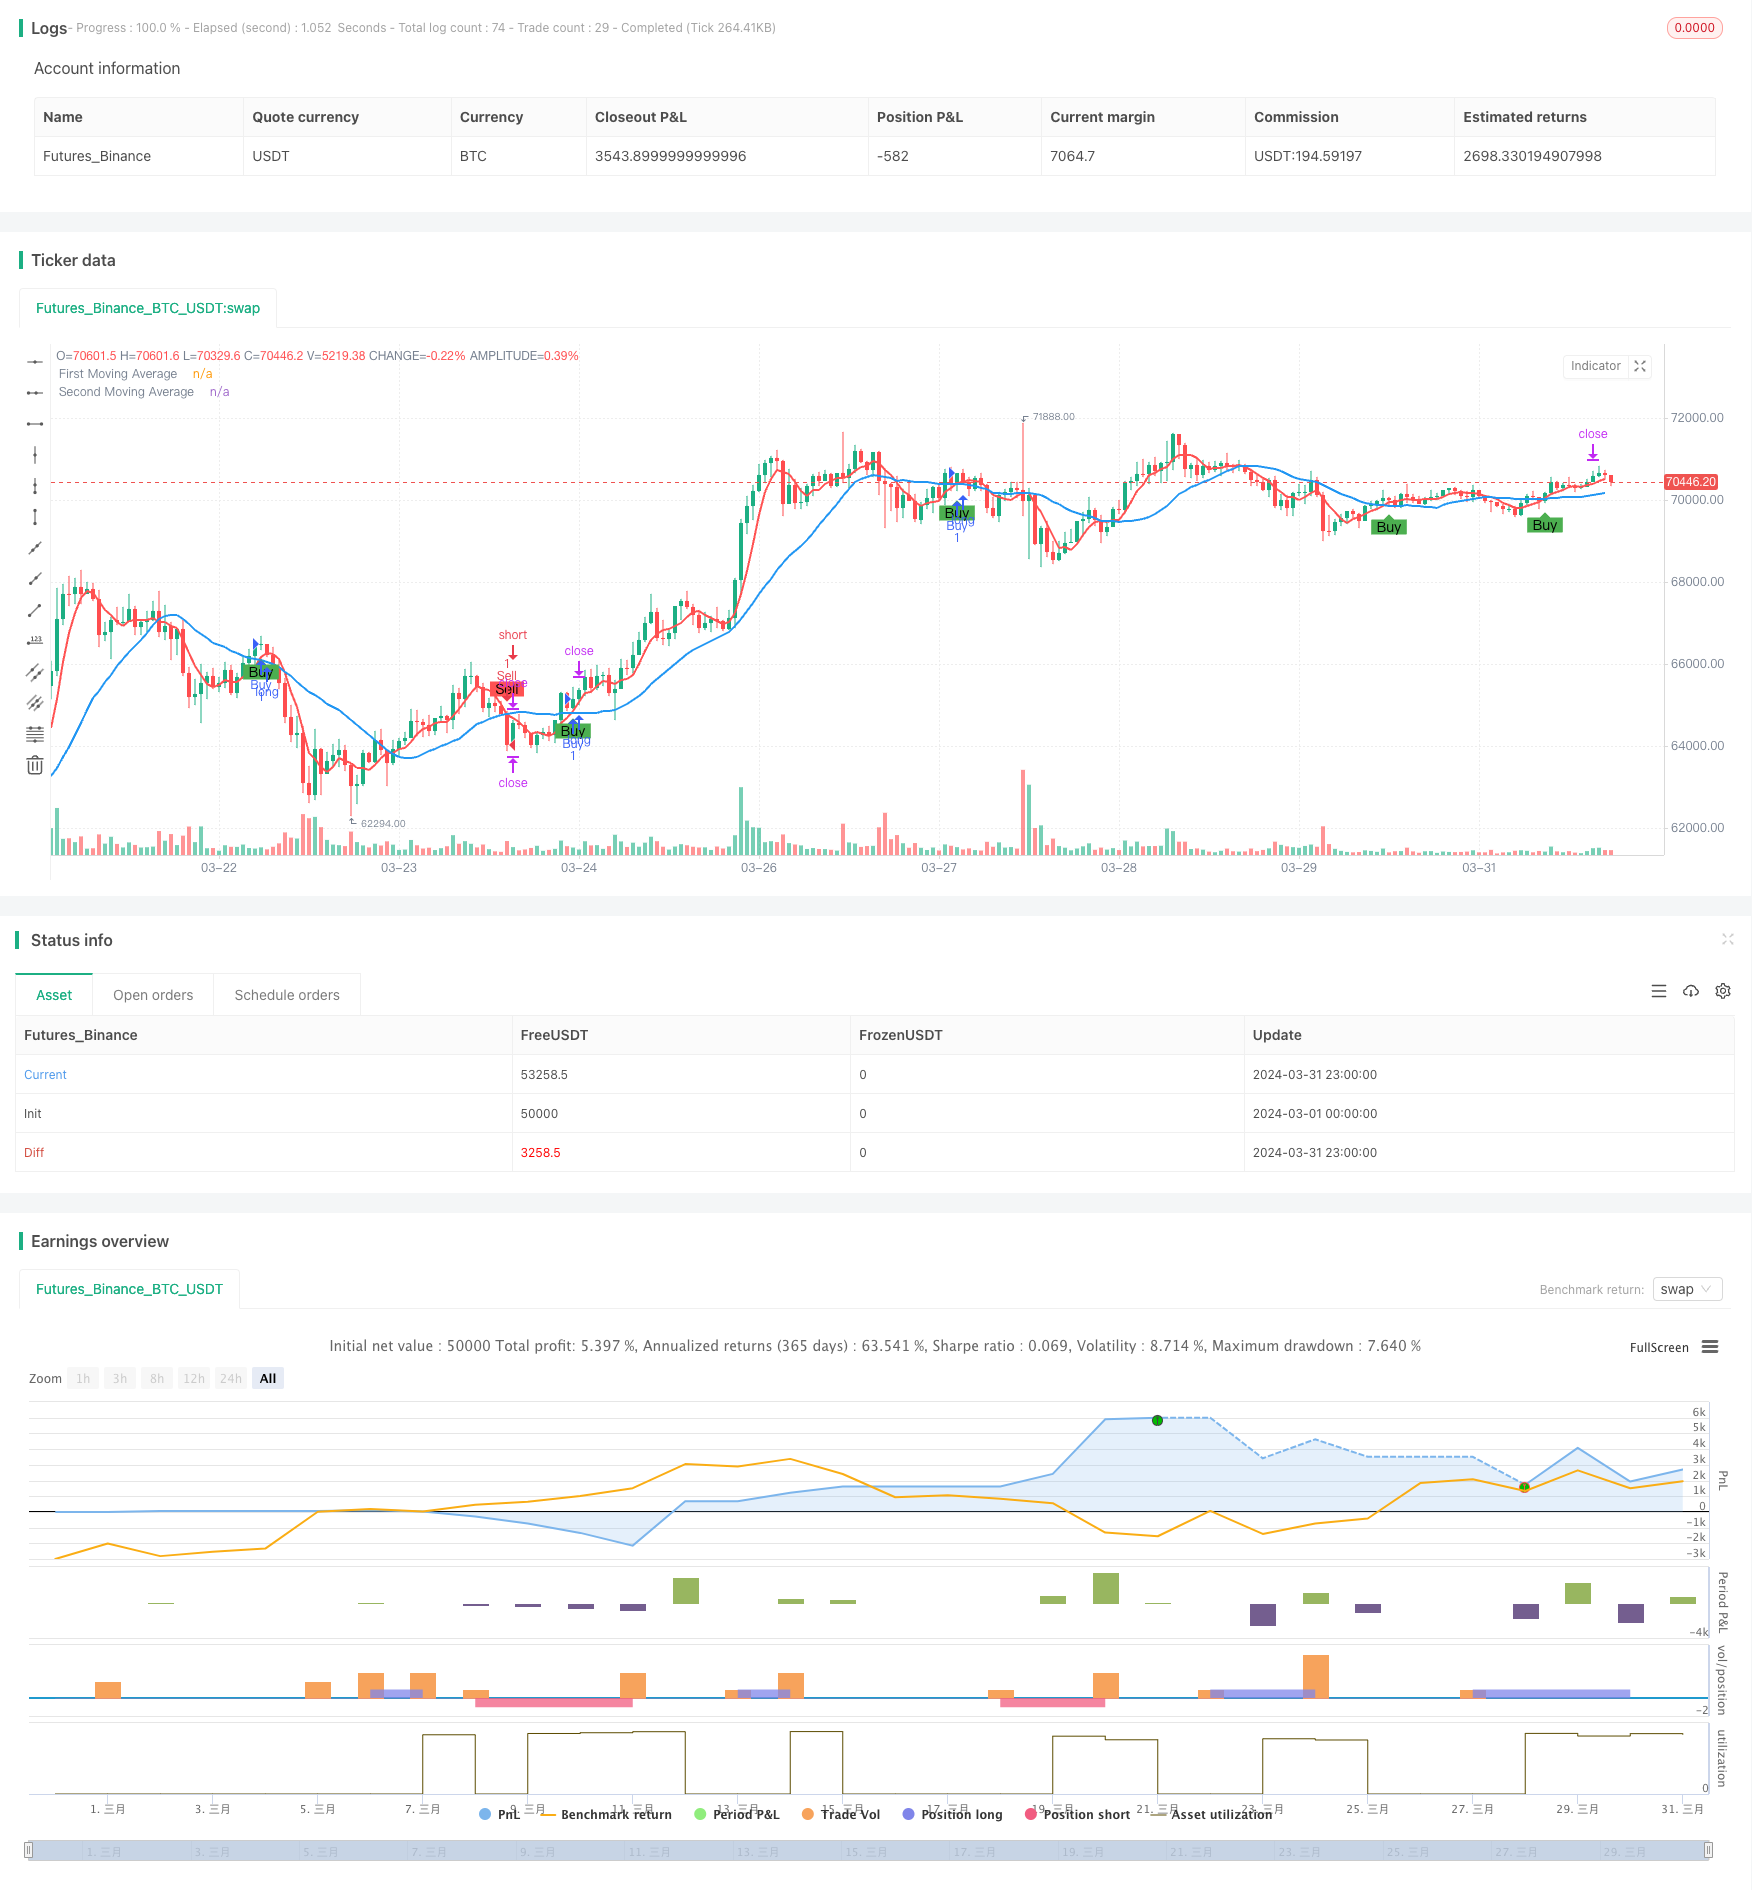
概述
该策略使用两条移动平均线(MA)来生成交易信号。当较短周期的MA从下向上穿过较长周期的MA时,生成买入信号;当较短周期的MA从上向下穿过较长周期的MA时,生成卖出信号。该策略同时设置了交易时间段(UTC时间8点到20点)和止盈点(150个点)。
策略原理
- 计算两条不同周期的移动平均线(默认为5周期和20周期)。
- 判断较短周期MA是否上穿/下穿较长周期MA,以此作为买入/卖出信号。
- 设置交易时间段为UTC时间8点到20点,只在该时间段内进行交易。
- 判断最近4根K线是否收在MA上方/下方,以此确认趋势。
- 如果满足买入/卖出条件,则开仓并设置150个点的止盈。
策略优势
- 使用两条不同周期的MA可以有效捕捉趋势,适用于趋势性市场。
- 设置交易时间段可以避免在流动性差的时间交易,降低风险。
- 通过判断最近4根K线是否收在MA上方/下方,可以确认趋势,提高信号可靠性。
- 设置固定的止盈点,可以有效锁定利润,控制风险。
策略风险
- 在震荡市场中,该策略可能会频繁出现错误信号,导致亏损。
- 固定的止盈点可能会限制策略的盈利空间。
- 该策略未设置止损,在行情急速逆转时可能会面临较大风险。
策略优化方向
- 可以考虑引入更多技术指标,如RSI、MACD等,以提高信号可靠性。
- 可以优化止盈止损点的设置,如采用动态止盈止损或者基于ATR的止盈止损。
- 可以结合市场微观结构,如订单流等信息,对交易信号进行二次确认。
- 可以针对不同的市场状态(趋势/震荡)采取不同的参数设置,提高策略的适应性。
总结
该策略基于两条不同周期的移动平均线的交叉来生成交易信号,适用于趋势性市场。通过设置交易时间段和固定止盈点,可以在一定程度上控制风险。但是该策略在震荡市场中表现可能不佳,并且固定止盈点可能会限制策略的盈利空间。未来可以考虑引入更多技术指标、优化止盈止损点设置、结合市场微观结构信息以及针对不同市场状态采取不同参数设置等方式来优化该策略。
策略源码
/*backtest
start: 2024-03-01 00:00:00
end: 2024-03-31 23:59:59
period: 1h
basePeriod: 15m
exchanges: [{"eid":"Futures_Binance","currency":"BTC_USDT"}]
*/

//@version=4
strategy("Moving Average Crossover Strategy", overlay=true)

// User-defined moving average periods
ma1Periods = input(5, title="First Moving Average Periods")
ma2Periods = input(20, title="Second Moving Average Periods")

// Calculate moving averages
ma1 = sma(close, ma1Periods)
ma2 = sma(close, ma2Periods)

// Plot moving averages
plot(ma1, color=color.red, linewidth=2, title="First Moving Average")
plot(ma2, color=color.blue, linewidth=2, title="Second Moving Average")

// Detect crossovers and crossunders
bullishCross = crossover(ma1, ma2)
bearishCross = crossunder(ma1, ma2)

// Define trading hours (8 AM to 2 PM UTC)
startHour = 8
endHour = 20
utcHour = hour(time, "UTC")
isMarketOpen = true

// Define profit target
profitTarget = 150

// Check if the price has closed above/below the MA for the past 4 bars
aboveMa = close[4] > ma1[4] and close[3] > ma1[3] and close[2] > ma1[2] and close[1] > ma1[1]
belowMa = close[4] < ma1[4] and close[3] < ma1[3] and close[2] < ma1[2] and close[1] < ma1[1]

// Create buy and sell signals
if (bullishCross and isMarketOpen and aboveMa)
    strategy.entry("Buy", strategy.long)
    strategy.exit("Sell", "Buy", profit=profitTarget)
if (bearishCross and isMarketOpen and belowMa)
    strategy.entry("Sell", strategy.short)
    strategy.exit("Cover", "Sell", profit=profitTarget)

// Plot shapes on crossovers
plotshape(series=bullishCross and isMarketOpen and aboveMa, location=location.belowbar, color=color.green, style=shape.labelup, text="Buy")
plotshape(series=bearishCross and isMarketOpen and belowMa, location=location.abovebar, color=color.red, style=shape.labeldown, text="Sell")
相关推荐