概述
这个策略是一个基于简单移动平均线(SMA)交叉的自动交易系统,结合了动态止盈和止损机制。它使用两条不同周期的SMA,通过它们的交叉来产生买入和卖出信号。同时,策略还设置了基于百分比的止盈和止损水平,以控制风险和锁定利润。
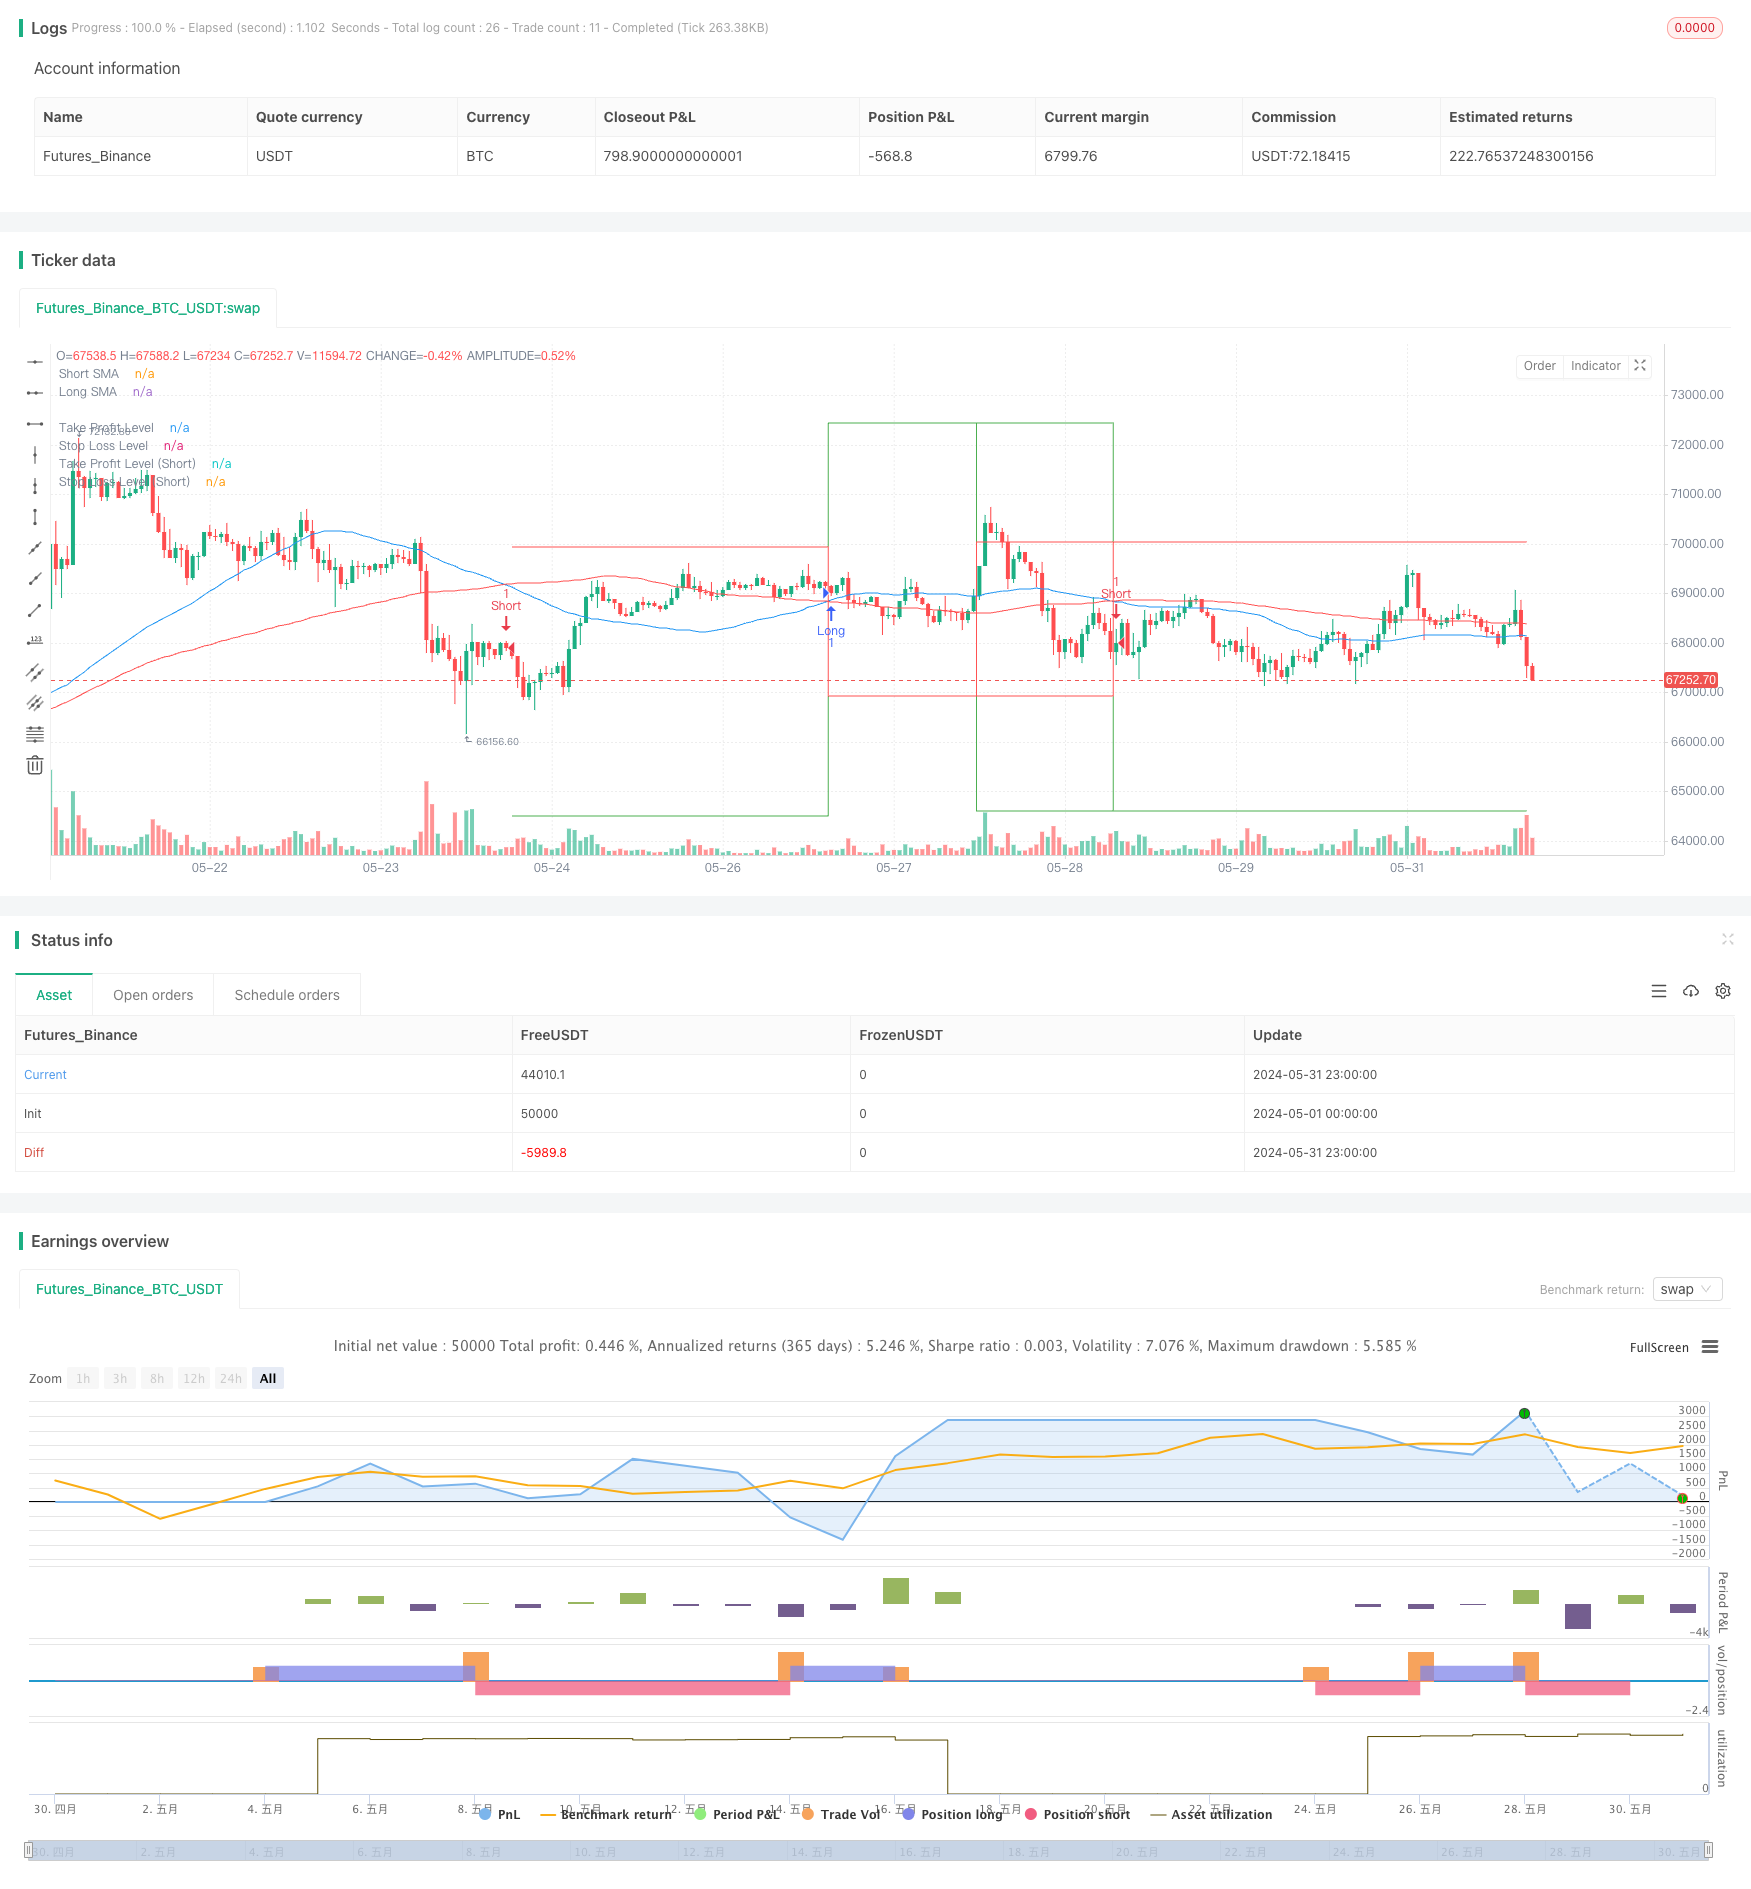
策略原理
- 使用两条SMA:一条短期(50周期)和一条长期(100周期)。
- 当短期SMA上穿长期SMA时,产生买入信号;当短期SMA下穿长期SMA时,产生卖出信号。
- 每次开仓时,根据当前价格和预设的百分比计算止盈和止损水平。
- 当价格达到止盈或止损水平时,自动平仓。
- 策略在图表上标注了买卖信号,并绘制了止盈和止损水平线。
策略优势
- 简单易懂:双均线交叉是一种经典的技术分析方法,容易理解和实施。
- 趋势跟踪:能够捕捉中长期趋势,有利于获得大行情带来的收益。
- 风险管理:通过动态设置止盈止损,有效控制每笔交易的风险。
- 自动化:全程由程序执行,减少人为干预和情绪影响。
- 可视化:在图表上清晰标注交易信号和关键价位,便于分析和回测。
策略风险
- 震荡市不适用:在横盘震荡市场中可能频繁产生假信号,导致连续亏损。
- 滞后性:SMA本身具有滞后性,可能错过最佳入场点或延迟退出。
- 固定百分比风险:使用固定百分比的止盈止损可能不适合所有市场条件。
- 缺乏其他确认指标:仅依赖均线交叉可能忽视其他重要的市场信息。
- 未考虑交易成本:频繁交易可能产生大量交易成本,影响最终收益。
策略优化方向
- 引入过滤器:可以添加成交量、波动率或其他技术指标作为过滤条件,减少假信号。
- 动态调整SMA周期:根据市场波动性自动调整SMA的长度,以适应不同的市场环境。
- 优化止盈止损:考虑使用ATR(平均真实范围)来设置动态的止盈止损水平,更好地适应市场波动。
- 增加趋势确认:结合其他趋势指标如MACD或ADX,提高交易信号的可靠性。
- 加入仓位管理:根据账户规模和市场波动性动态调整每次交易的仓位大小。
- 时间过滤:增加交易时间窗口限制,避开波动较大或流动性不足的时段。
- 回撤控制:添加最大回撤限制,在连续亏损达到一定程度时暂停交易。
总结
这个基于双均线交叉的交易策略提供了一个简单而有效的框架,适合初学者入门自动化交易。它结合了趋势跟踪和风险管理的元素,通过动态设置止盈止损来保护资金。然而,为了在实际交易中取得更好的效果,还需要进一步优化和完善。可以考虑添加更多的技术指标作为过滤器,优化止盈止损的设置方法,并引入更复杂的仓位管理策略。同时,在不同的市场环境和时间框架下进行充分的回测和验证也是必不可少的。通过不断改进和适应市场变化,这个策略有潜力成为一个可靠的交易系统。
策略源码
/*backtest
start: 2024-05-01 00:00:00
end: 2024-05-31 23:59:59
period: 1h
basePeriod: 15m
exchanges: [{"eid":"Futures_Binance","currency":"BTC_USDT"}]
*/

// This Pine Script™ code is subject to the terms of the Mozilla Public License 2.0 at https://mozilla.org/MPL/2.0/
// © Pubgentleman

//@version=5
//@version=5
strategy("TSLA 1-Hour SMA Crossover Strategy with Buy/Sell Signals", overlay=true)

// Parameters
shortSmaLength = input.int(50, title="Short SMA Length")
longSmaLength = input.int(100, title="Long SMA Length")
takeProfitPerc = input.float(5.0, title="Take Profit Percentage", step=0.1) // 5.0% take profit
stopLossPerc = input.float(3.0, title="Stop Loss Percentage", step=0.1) // 3.0% stop loss

// Calculate SMAs
shortSma = ta.sma(close, shortSmaLength)
longSma = ta.sma(close, longSmaLength)

// Plot SMAs
plot(shortSma, color=color.blue, title="Short SMA")
plot(longSma, color=color.red, title="Long SMA")

// Entry Conditions
longCondition = ta.crossover(shortSma, longSma)
shortCondition = ta.crossunder(shortSma, longSma)

// Trade Management
var float entryPrice = na
var float takeProfitLevel = na
var float stopLossLevel = na

if (longCondition)
    entryPrice := close
    takeProfitLevel := entryPrice * (1 + takeProfitPerc / 100)
    stopLossLevel := entryPrice * (1 - stopLossPerc / 100)
    strategy.entry("Long", strategy.long)
    label.new(x=bar_index, y=low, text="Buy", style=label.style_label_up, color=color.green, textcolor=color.white)

if (shortCondition)
    entryPrice := close
    takeProfitLevel := entryPrice * (1 - takeProfitPerc / 100)
    stopLossLevel := entryPrice * (1 + stopLossPerc / 100)
    strategy.entry("Short", strategy.short)
    label.new(x=bar_index, y=high, text="Sell", style=label.style_label_down, color=color.red, textcolor=color.white)

// Exit Conditions
if (strategy.position_size > 0)
    if (close >= takeProfitLevel or close <= stopLossLevel)
        strategy.close("Long")

if (strategy.position_size < 0)
    if (close <= takeProfitLevel or close >= stopLossLevel)
        strategy.close("Short")

// Plot Take Profit and Stop Loss Levels
plot(strategy.position_size > 0 ? takeProfitLevel : na, title="Take Profit Level", color=color.green, style=plot.style_stepline)
plot(strategy.position_size > 0 ? stopLossLevel : na, title="Stop Loss Level", color=color.red, style=plot.style_stepline)
plot(strategy.position_size < 0 ? takeProfitLevel : na, title="Take Profit Level (Short)", color=color.green, style=plot.style_stepline)
plot(strategy.position_size < 0 ? stopLossLevel : na, title="Stop Loss Level (Short)", color=color.red, style=plot.style_stepline)
相关推荐