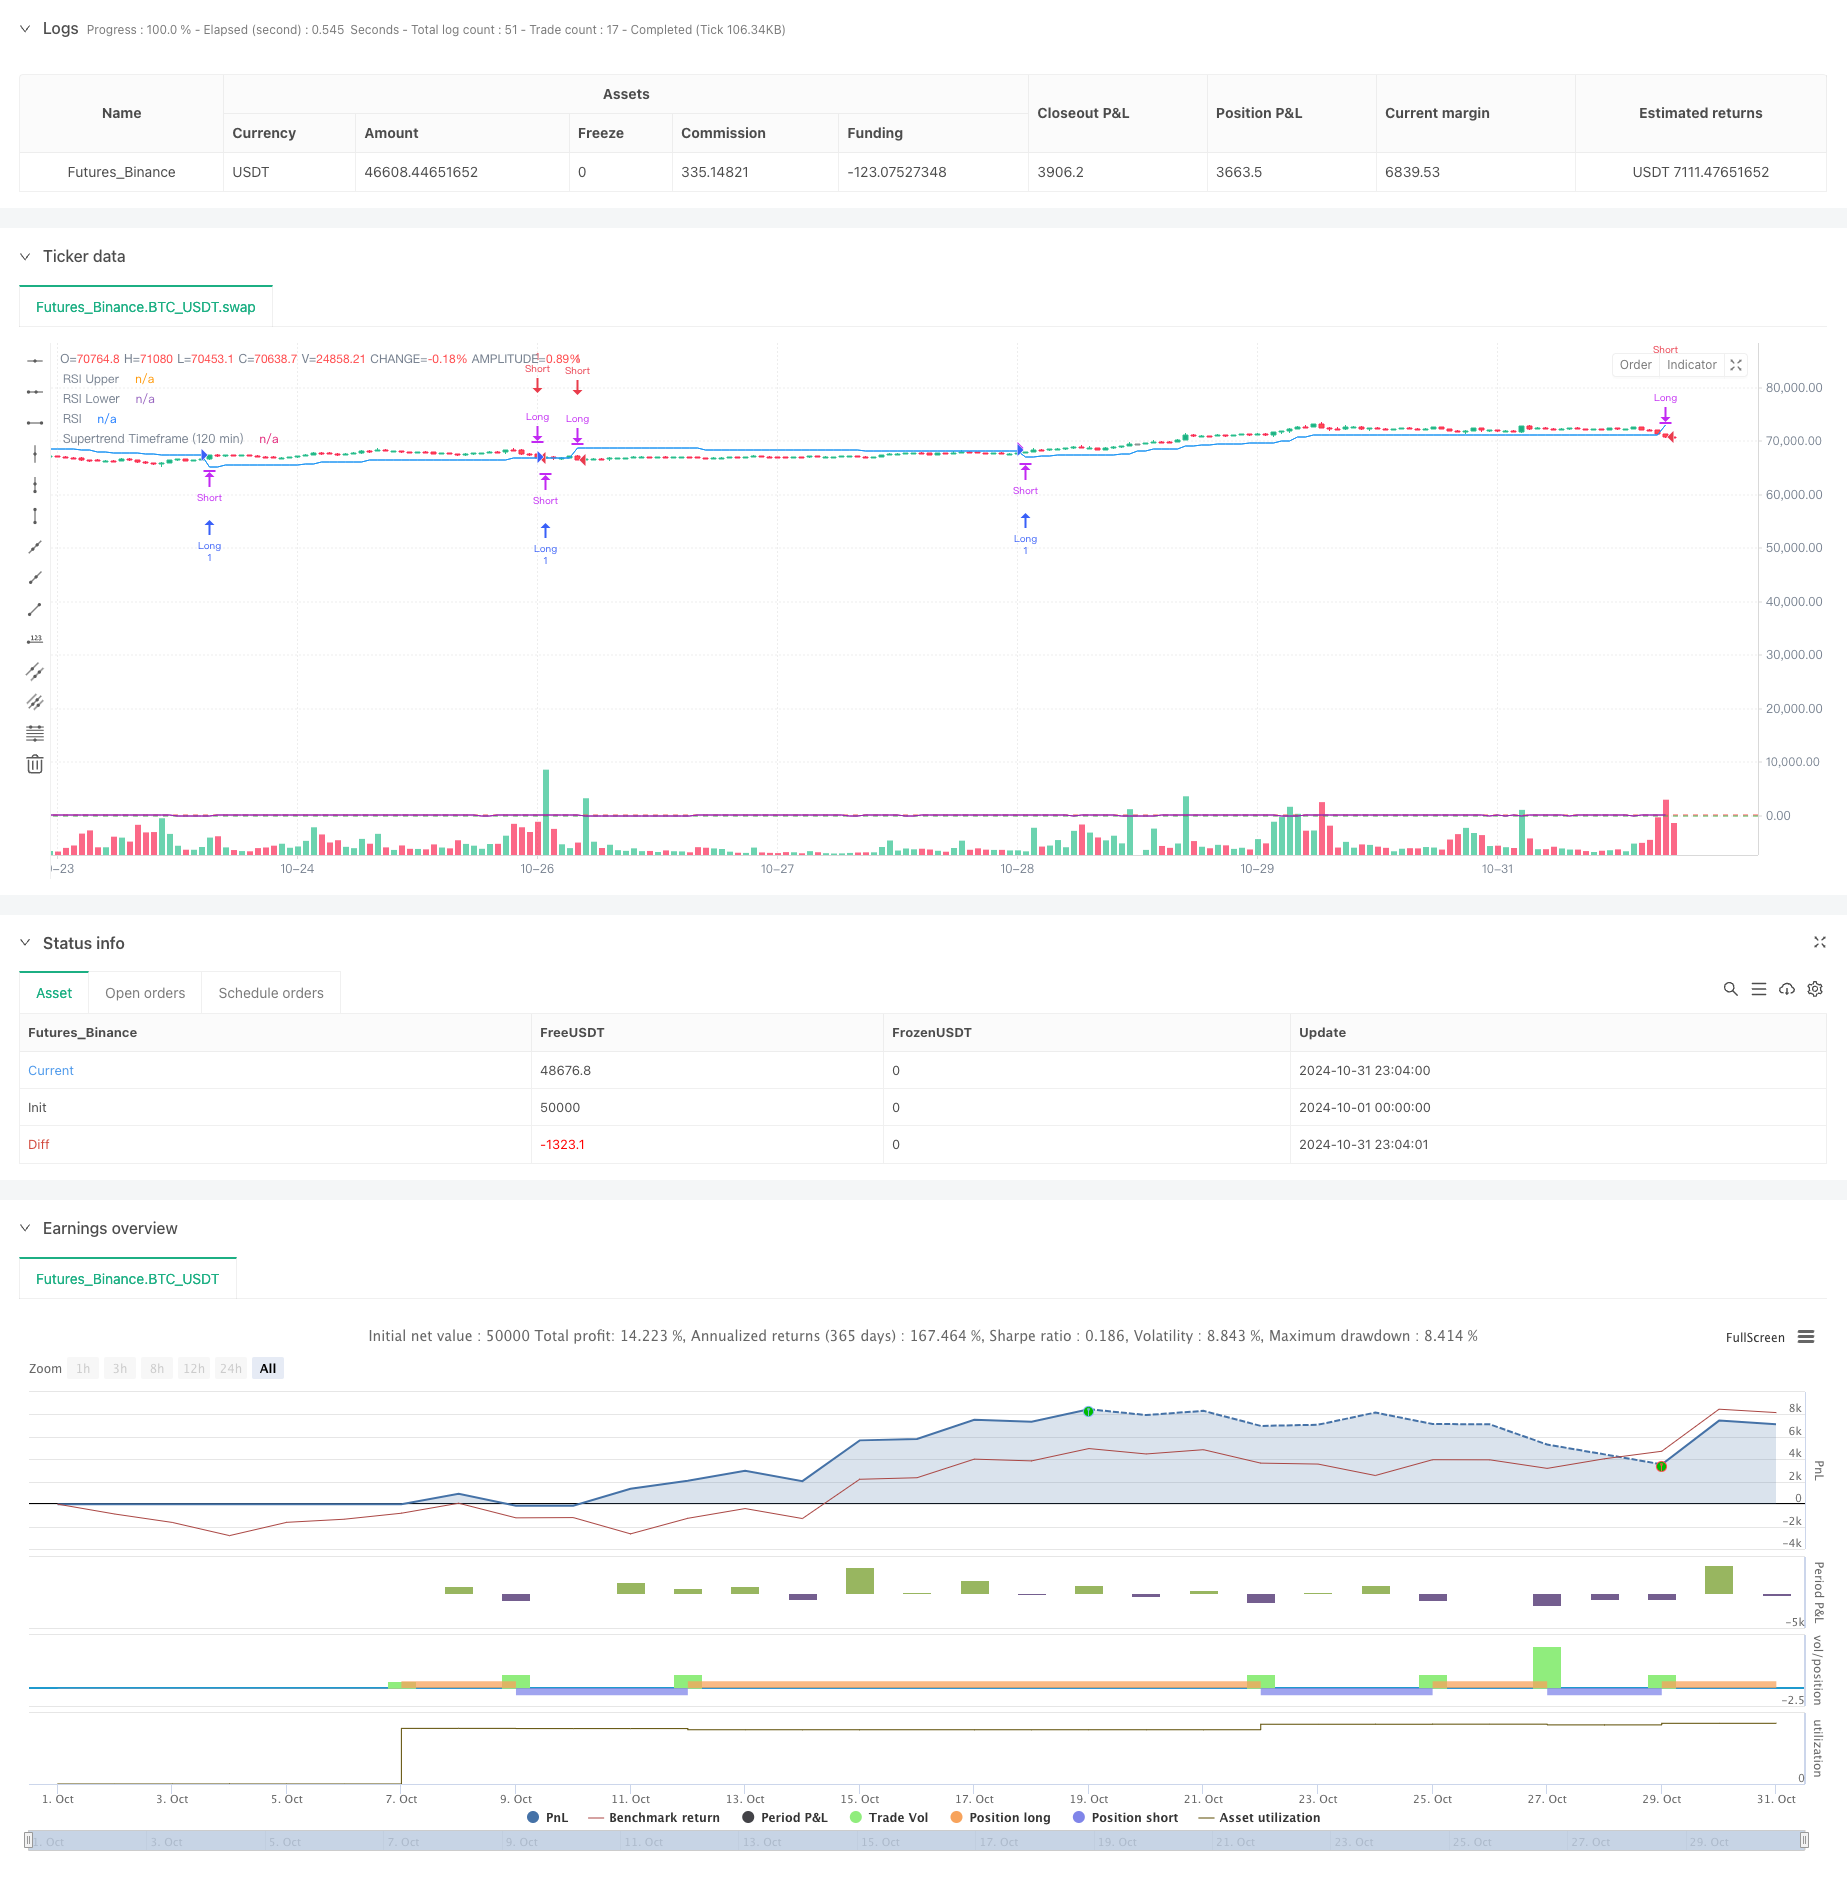
概述
该策略是一个基于SuperTrend指标和RSI指标的双时间周期交易系统。它结合了120分钟和15分钟两个时间周期的技术分析指标,通过SuperTrend指标捕捉中期趋势方向,同时利用RSI指标进行获利了结。策略采用资金管理机制,通过百分比分配仓位,并设置了基于百分比的止盈条件。
策略原理
策略的核心逻辑建立在以下几个关键要素上: 1. 使用120分钟周期的SuperTrend指标作为主要趋势判断工具,该指标基于ATR周期为14,因子设置为3.42 2. 通过价格与SuperTrend线的交叉来确定交易信号,向上穿越产生做多信号,向下穿越产生做空信号 3. 采用15分钟周期的RSI指标作为辅助工具,RSI周期设为5,用于市场过热或过冷的判断 4. 在RSI达到超买区(95)时平掉多头仓位,在达到超卖区(5)时平掉空头仓位 5. 设置30%的百分比止盈点,相对于开仓均价计算
策略优势
- 多时间周期结合提高了信号的可靠性,降低了虚假信号的影响
- SuperTrend指标的参数优化适中,既保证了对趋势的敏感度,又避免了过度灵敏导致的频繁交易
- RSI指标的极值设置非常严格(5和95),确保只在极端行情下触发平仓,避免过早离场
- 资金管理采用账户净值的固定比例(35%),有效控制风险的同时保证了收益空间
- 在开新仓位前会自动平掉反向持仓,避免了同时持有多空仓位的风险
策略风险
- 双时间周期策略在震荡市场可能产生滞后效应,需要注意控制回撤
- RSI指标的极值设置过于严格,可能导致错过一些获利了结的机会
- 30%的止盈点设置较为激进,在波动较大的市场中可能过早获利了结
- 策略未设置止损条件,在趋势突然反转时可能承受较大损失
- 35%的仓位配比相对激进,在市场剧烈波动时风险较大
策略优化方向
- 建议增加动态止损机制,可以考虑基于ATR的跟踪止损
- RSI的超买超卖阈值可以适当放宽,建议调整为10和90,提高策略的适应性
- 可以添加成交量指标作为辅助确认,提高信号的可靠性
- 考虑根据市场波动情况动态调整仓位比例,使用ATR或波动率指标
- 建议增加趋势强度过滤器,例如DMI或ADX指标,过滤弱趋势行情
总结
这是一个结构完整、逻辑清晰的趋势跟踪策略。通过组合不同时间周期的技术指标,在把握趋势的同时也注意风险控制。虽然还存在一些可以优化的空间,但整体设计理念符合量化交易的基本原则。建议交易者在实盘使用前,先通过回测优化各项参数,并根据自己的风险承受能力调整仓位配比。
策略源码
/*backtest
start: 2024-10-01 00:00:00
end: 2024-10-31 23:59:59
period: 1h
basePeriod: 1h
exchanges: [{"eid":"Futures_Binance","currency":"BTC_USDT"}]
*/

// This Pine Script™ code is subject to the terms of the Mozilla Public License 2.0 at https://mozilla.org/MPL/2.0/
// © felipemiransan

//@version=5
strategy("Supertrend Strategy", overlay=true)

// Function for Supertrend
supertrend(_factor, _atrPeriod) =>
    [out, _] = ta.supertrend(_factor, _atrPeriod)
    out

// Supertrend Settings
factor = input.float(3.42, title="Supertrend Factor")
atrPeriod = input.int(14, title="ATR Period")
tf2 = input.timeframe("120", title="Supertrend Timeframe")

// RSI Settings
rsi_tf = input.timeframe("15", title="RSI Timeframe")
rsiLength = input.int(5, title="RSI Length")
rsiUpper = input.int(95, title="RSI Upper Limit")
rsiLower = input.int(5, title="RSI Lower Limit")

// RSI Timeframe
rsi_tf_value = request.security(syminfo.tickerid, rsi_tf, ta.rsi(close, rsiLength), lookahead=barmerge.lookahead_off, gaps=barmerge.gaps_off)

// Supertrend Timeframe
supertrend_tf2 = request.security(syminfo.tickerid, tf2, supertrend(factor, atrPeriod), lookahead=barmerge.lookahead_off, gaps=barmerge.gaps_off)

// Take Profit Settings (Percentage in relation to the average price)
takeProfitPercent = input.float(30, title="Take Profit", step=0.1) / 100

// Entry conditions based on price crossover with Supertrend Timeframe
longCondition = ta.crossover(close, supertrend_tf2) and barstate.isconfirmed
shortCondition = ta.crossunder(close, supertrend_tf2) and barstate.isconfirmed

// Execution of reversal orders with closing of previous position
if (longCondition)
    // Close a short position before opening a long position
    if (strategy.position_size < 0)
        strategy.close("Short", comment="Close Short for Long Entry")
    strategy.entry("Long", strategy.long)

if (shortCondition)
    // Close long position before opening short position
    if (strategy.position_size > 0)
        strategy.close("Long", comment="Close Long for Short Entry")
    strategy.entry("Short", strategy.short)

// Calculate take profit levels relative to the average entry price
if (strategy.position_size > 0)
    takeProfitLong = strategy.position_avg_price * (1 + takeProfitPercent)
    strategy.exit("Take Profit Long", "Long", limit=takeProfitLong)

if (strategy.position_size > 0 and (rsi_tf_value >= rsiUpper))
    strategy.close("Long", comment="RSI Take Profit Long")

if (strategy.position_size < 0)
    takeProfitShort = strategy.position_avg_price * (1 - takeProfitPercent)
    strategy.exit("Take Profit Short", "Short", limit=takeProfitShort)

if (strategy.position_size < 0 and (rsi_tf_value <= rsiLower))
    strategy.close("Short", comment="RSI Take Profit Short")

// Plot Supertrend timeframe with commit check to avoid repainting
plot(barstate.isconfirmed ? supertrend_tf2 : na, color=color.blue, title="Supertrend Timeframe (120 min)", linewidth=1)

// Plot RSI for visualization
plot(rsi_tf_value, "RSI", color=color.purple)
hline(rsiUpper, "RSI Upper", color=color.red)
hline(rsiLower, "RSI Lower", color=color.green)
相关推荐