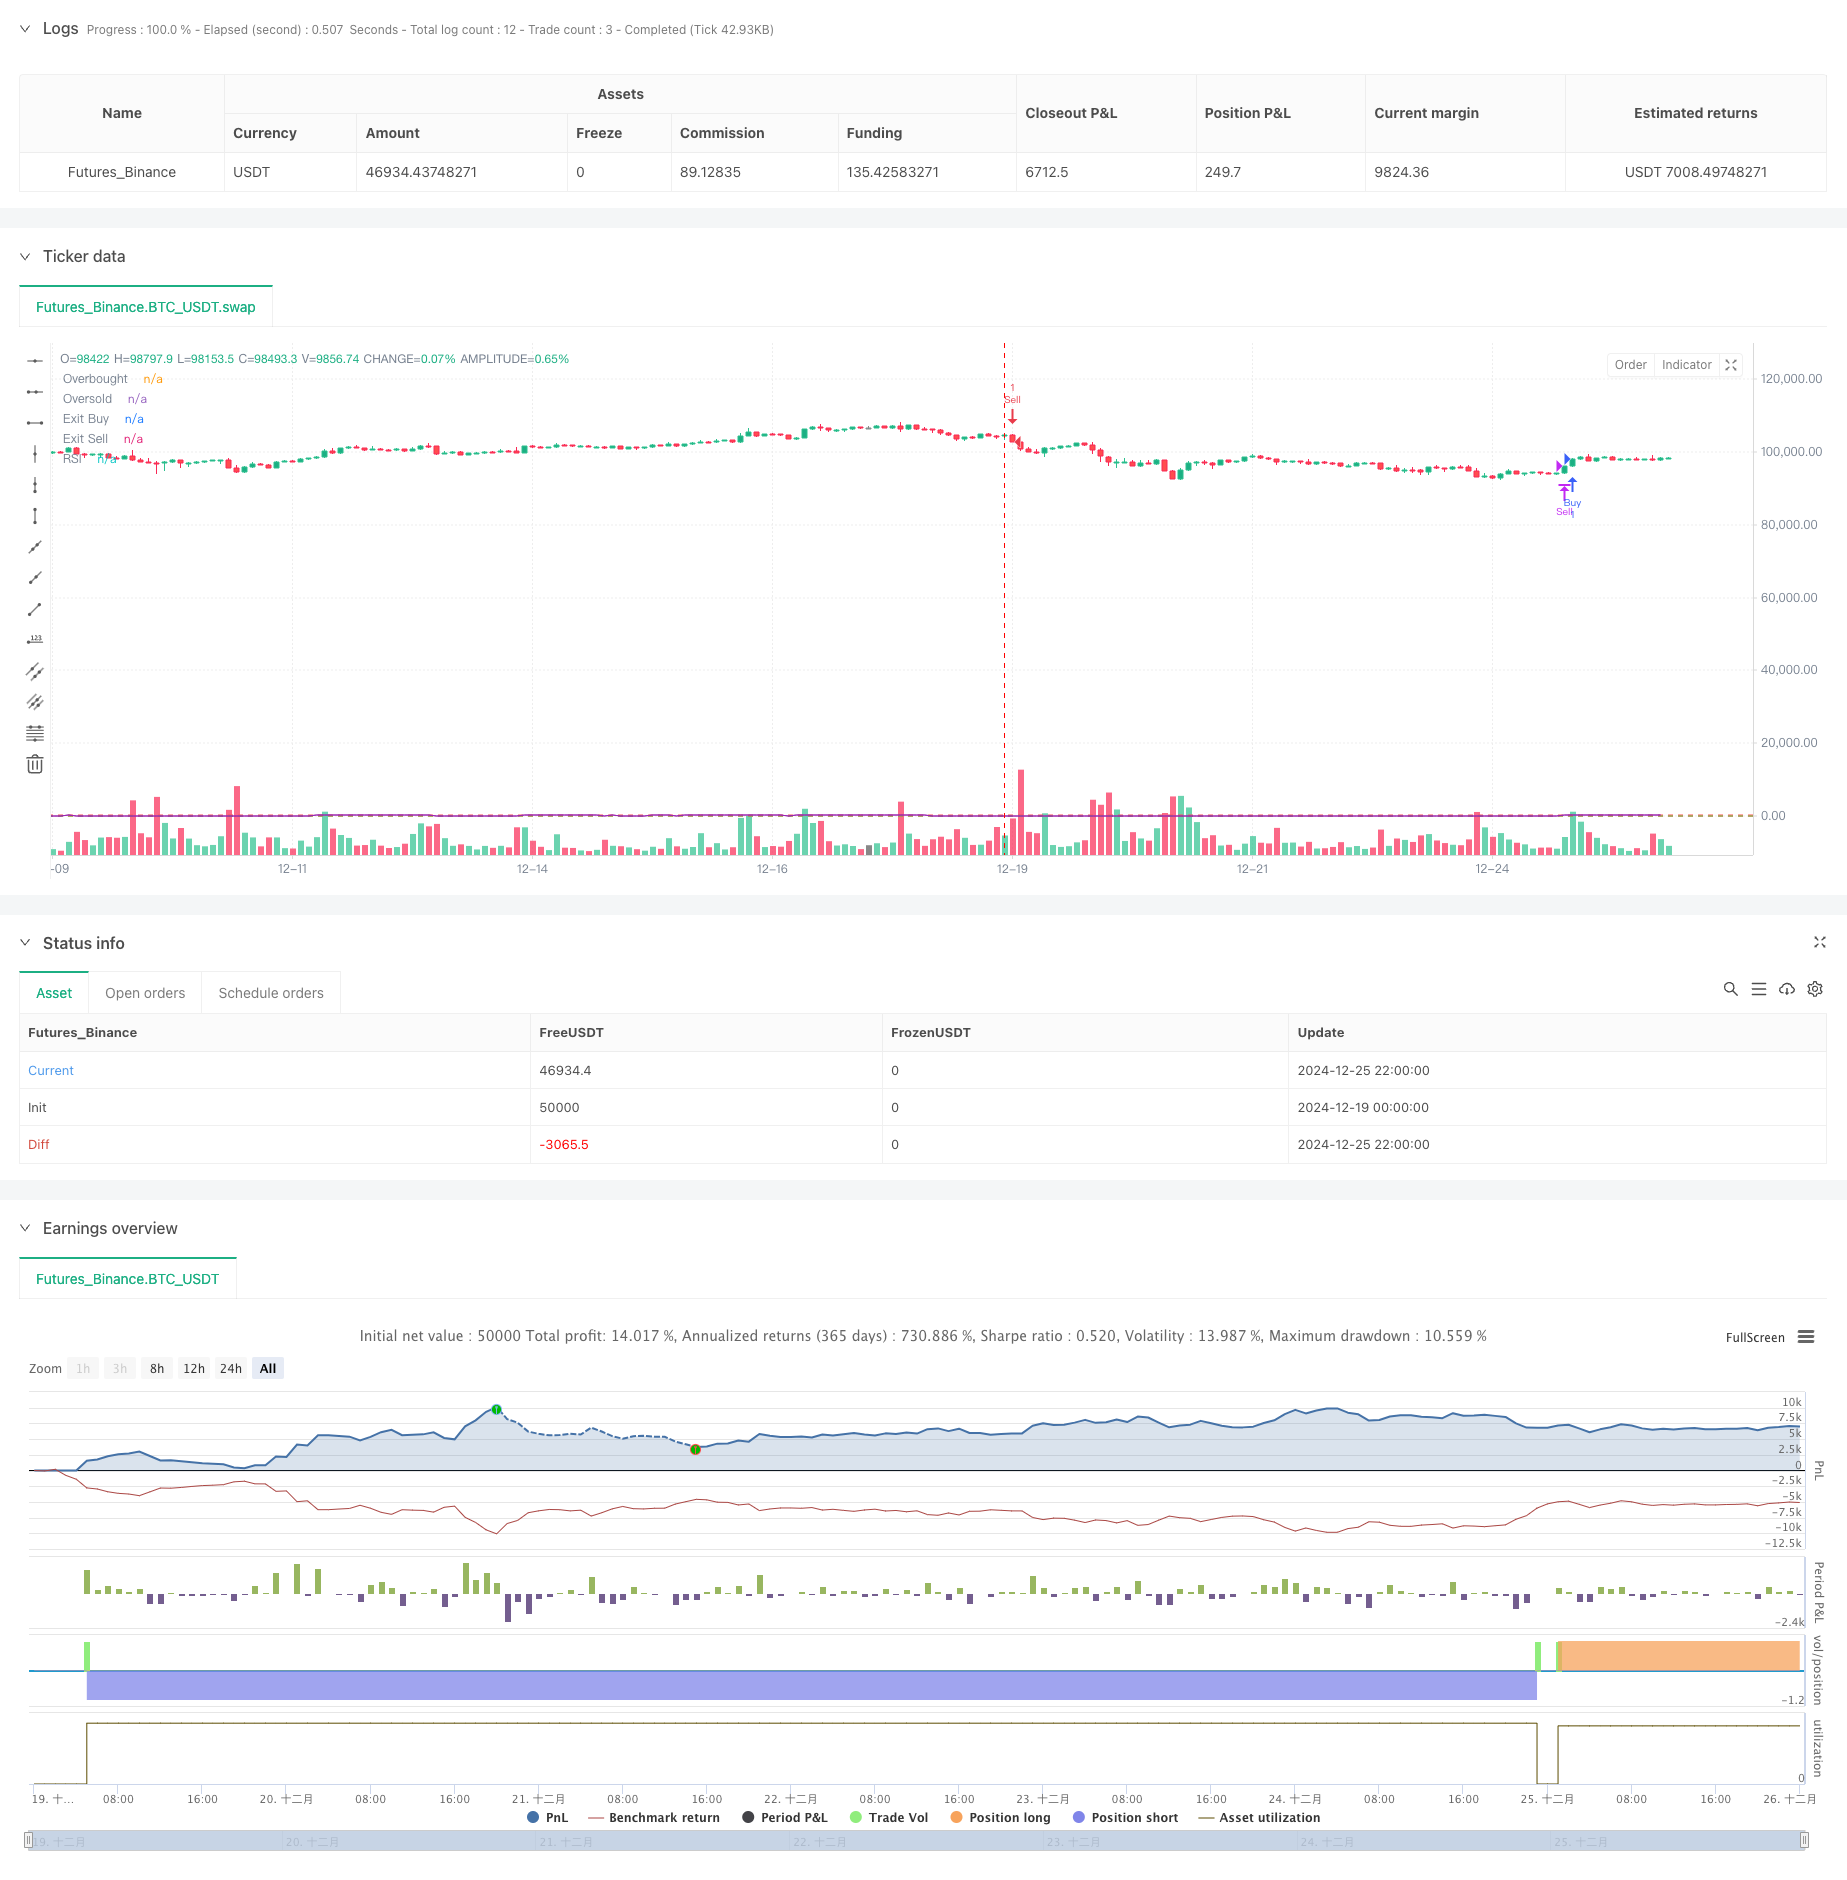
概述
本策略是一个基于相对强弱指标(RSI)的趋势反转交易系统,通过设定超买超卖区间来捕捉市场转折点,并结合ATR动态止损进行风险控制。策略的独特之处在于引入了”禁止交易区间”的概念,有效避免了震荡市中的频繁交易。该策略适用于波动性较大的市场环境,特别是具有明显趋势特征的交易品种。
策略原理
策略主要基于以下核心逻辑实现: 1. 使用14周期RSI指标识别市场超买超卖状态 2. 当RSI突破60水平且收盘价高于前高时,触发做多信号 3. 当RSI跌破40水平且收盘价低于前低时,触发做空信号 4. 在RSI处于45-55区间时设定为禁止交易区,防止在盘整阶段频繁交易 5. 基于1.5倍ATR设置动态止损位,提供风险控制机制 6. 分别在RSI低于45和高于55时平仓多头和空头头寸
策略优势
- 结合趋势反转和动量特征进行交易决策
- 通过禁止交易区间有效避免震荡市中的假信号
- 采用ATR动态止损,根据市场波动性自适应调整止损位置
- 入场和出场条件明确,避免主观判断
- 策略逻辑简单清晰,易于理解和维护
- 具有良好的风险控制机制
策略风险
- 在快速趋势市场中可能错过部分行情
- RSI指标具有滞后性,可能导致入场时机略有延迟
- 禁止交易区间可能错过某些重要的交易机会
- ATR止损在波动剧烈时可能导致止损位过宽
- 需要合理设置参数以适应不同市场环境
策略优化方向
- 引入多周期RSI确认信号,提高交易可靠性
- 增加成交量指标作为辅助判断条件
- 优化禁止交易区间的动态调整机制
- 考虑加入趋势筛选功能,在强趋势中调整策略参数
- 开发自适应参数优化机制,提高策略适应性
- 增加止盈机制,提高资金利用效率
总结
该策略通过RSI反转信号和禁止交易区间的创新组合,较好地解决了趋势交易中的时机把握问题。ATR动态止损的引入为策略提供了可靠的风险控制机制。虽然策略还存在一些潜在风险,但通过建议的优化方向可以进一步提升策略的稳定性和盈利能力。总体而言,这是一个逻辑清晰、实用性强的趋势反转交易策略。
策略源码
/*backtest
start: 2024-12-19 00:00:00
end: 2024-12-26 00:00:00
period: 2h
basePeriod: 2h
exchanges: [{"eid":"Futures_Binance","currency":"BTC_USDT"}]
*/

//@version=5
strategy("RSI-Based Trading Strategy with No Trading Zone and ATR Stop Loss", overlay=true)

// Input parameters
rsiPeriod = input(14, title="RSI Period")
rsiOverbought = input(60, title="RSI Overbought Level")
rsiOversold = input(40, title="RSI Oversold Level")
rsiExitBuy = input(45, title="RSI Exit Buy Level")
rsiExitSell = input(55, title="RSI Exit Sell Level")
atrPeriod = input(14, title="ATR Period")
atrMultiplier = input(1.5, title="ATR Stop Loss Multiplier")

// Calculate RSI and ATR
rsi = ta.rsi(close, rsiPeriod)
atr = ta.atr(atrPeriod)

// Buy conditions
buyCondition = ta.crossover(rsi, rsiOverbought) and close > high[1]
if (buyCondition and not strategy.position_size)
    stopLossLevel = close - atr * atrMultiplier
    strategy.entry("Buy", strategy.long, stop=stopLossLevel)

// Exit conditions for buy
exitBuyCondition = rsi < rsiExitBuy
if (exitBuyCondition and strategy.position_size > 0)
    strategy.close("Buy")

// Sell conditions
sellCondition = ta.crossunder(rsi, rsiOversold) and close < low[1]
if (sellCondition and not strategy.position_size)
    stopLossLevel = close + atr * atrMultiplier
    strategy.entry("Sell", strategy.short, stop=stopLossLevel)

// Exit conditions for sell
exitSellCondition = rsi > rsiExitSell
if (exitSellCondition and strategy.position_size < 0)
    strategy.close("Sell")

// Plotting RSI for visualization
hline(rsiOverbought, "Overbought", color=color.red)
hline(rsiOversold, "Oversold", color=color.green)
hline(rsiExitBuy, "Exit Buy", color=color.blue)
hline(rsiExitSell, "Exit Sell", color=color.orange)
plot(rsi, title="RSI", color=color.purple)

// // No Trading Zone
// var box noTradingZone = na

// // Create a rectangle for the no trading zone
// if (rsi >= rsiExitBuy and rsi <= rsiExitSell)
//     // If the no trading zone box does not exist, create it
//     if (na(noTradingZone))
//         noTradingZone := box.new(bar_index, high, bar_index + 1, low, bgcolor=color.new(color.gray, 90), border_color=color.new(color.gray, 90))
//     else
//         // Update the existing box to cover the current candle
//         box.set_left(noTradingZone, bar_index)
//         box.set_right(noTradingZone, bar_index + 1)
//         box.set_top(noTradingZone, high)
//         box.set_bottom(noTradingZone, low)
// else
//     // If the RSI is outside the no trading zone, delete the box
//     if (not na(noTradingZone))
//         box.delete(noTradingZone)
//         noTradingZone := na
相关推荐