概述
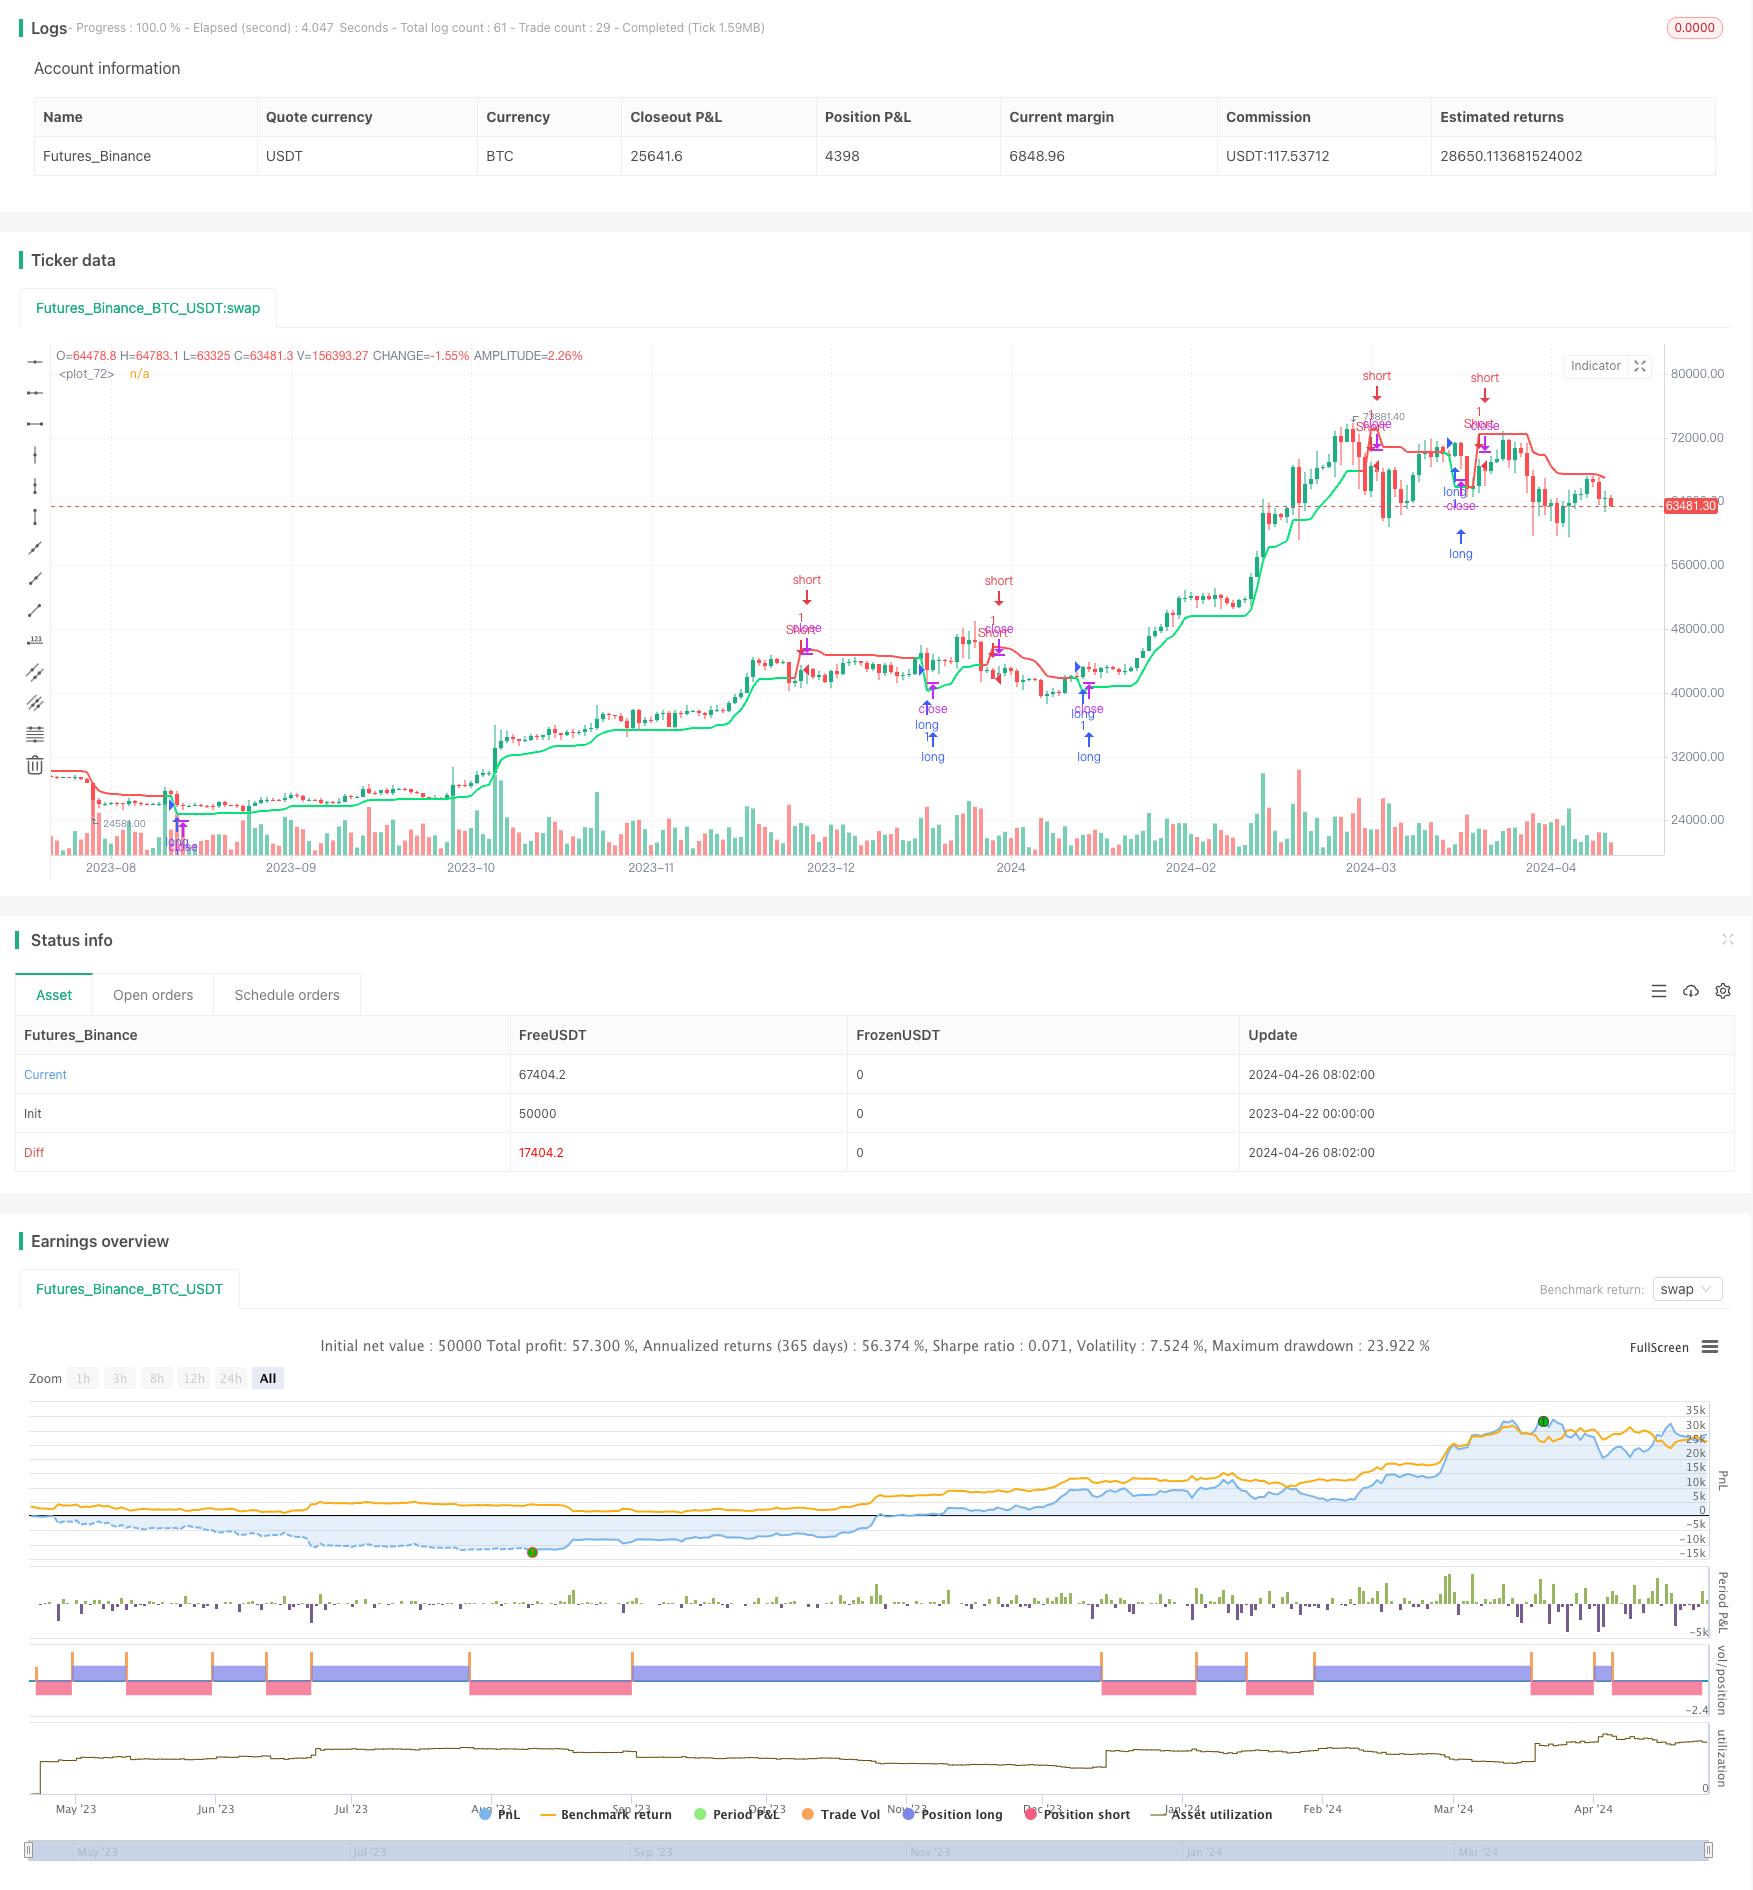
RSI趋势反转策略是一个基于相对强弱指数(RSI)和平均真实波幅(ATR)的量化交易策略。该策略通过动态调整止盈止损(TP/SL)来适应快速的市场波动,捕捉趋势反转机会。策略以RSI为核心,结合ATR衡量波动率,构建上下两条自适应动态波段用作开仓平仓的依据。该策略可以独立使用,也可以作为其他策略的止盈止损模块。经过在特斯拉(TSLA)、苹果(AAPL)、英伟达(NVDA)等股票的15分钟级别数据回测,效果良好。
策略原理
RSI趋势反转策略的核心在于动态止盈止损带的构建。首先利用自定义的highest_custom和lowest_custom函数找到自上次交叉以来的最高价和最低价,形成波段基础。然后分别计算长度为length的RSI和ATR,再进行如下计算: 1. 下轨 = 最高价 × [1 - (ATR/价格 + 1/(RSI下轨 × multiplier))] 2. 上轨 = 最低价 × [1 + (ATR/价格 + 1/(RSI上轨 × multiplier))]
其中multiplier为用户自定义的波段扩大因子。如果价格向上突破上轨则做多,向下跌破下轨则做空。同时这两条带子的颜色也根据价格相对波段的位置变化,便于观察。
策略优势
- 自适应性强,止盈止损带能够根据价格的波动率自动调整,及时应对行情变化。
- 参数可调,通过调整length、multiplier等参数,可以灵活控制策略的敏感度。
- 逻辑清晰,代码结构合理,易于理解和二次开发。
- 适用性广,可以独立做策略使用,也可以为其他策略增加止盈止损功能。
- 计算高效,通过自定义highest_custom等函数,避免了使用series类型导致的大量重复计算。
策略风险
- 参数选择不当可能带来额外风险,例如length太小可能导致频繁交易,multiplier过大可能导致止损过于宽松。
- 特定市场情况下效果可能欠佳,如震荡市中频繁的盘整和假突破可能会产生较多亏损交易。
- 策略本身无趋势判断功能,需要其他信号配合使用。
策略优化方向
- 可以考虑加入趋势判断指标,如移动平均线,只在大趋势方向的反转点进行交易。
- 可以对参数进行优化,找到最佳的length、multiplier等参数组合。
- 可以结合其他技术指标或市场情绪指标,提高开平仓点位的精确度。
- 可以通过加入仓位管理,严格控制每次交易的风险敞口。
总结
RSI趋势反转策略利用RSI和ATR构建自适应波段,能够动态调整止盈止损点,及时应对市场变化。该策略逻辑清晰,适用范围广泛,可以作为量化交易者的有力工具。但在实际使用中仍需注意参数选择和风险控制,并建议与其他指标信号组合使用,提高整体表现。策略还有进一步的优化空间,如加入趋势过滤,参数寻优等。总的来说,RSI趋势反转策略为量化交易提供了一种简单而有效的思路。
策略源码
/*backtest
start: 2023-04-22 00:00:00
end: 2024-04-27 00:00:00
period: 1d
basePeriod: 1h
exchanges: [{"eid":"Futures_Binance","currency":"BTC_USDT"}]
*/

//@version=5
strategy("RSI Trend Reversal", overlay=true, max_bars_back = 4999, calc_on_every_tick = false)


//INPUTS
rsi_length = input.int(title = "Lenght", defval = 8)
rsi_mult = input.float(title = "Multiplier", defval = 1.5, step = .05)
lookback = input.int(title = "Delay to prevent idealization", defval = 1)
sltp = input.float(title = "Minimum Difference", defval = 10)
src = input.source(title = "Source Input", defval = close)

//PARAMETERS INITILIZATION
hclose = request.security(ticker.heikinashi(syminfo.tickerid), timeframe.period, src)
//FUNCTION INITILIZATION
highest_custom(src, length) =>
    x = src
    for i = 0 to length
        if src[i] > x
            x := src[i]
    x
lowest_custom(src, length) =>
    x = src
    for i = 0 to length
        if src[i] < x
            x := src[i]
    x
rsilev(src, length, mult, sltp) =>
    sl = (100 - sltp) / 100
    tp = (100 + sltp) / 100
    var bool crossup = na
    var bool crossdown = na
    var float dir = na
    dir_change = ta.change(dir)
    var float BearGuy = 0
    BullGuy = ta.barssince(crossup or crossdown)
    if na(BullGuy)
        BearGuy += 1
    else
        BearGuy := BullGuy
    var float upper = na
    var float lower = na
    rsilower = ta.rsi(src, length)
    rsiupper = math.abs(ta.rsi(src, length) - 100)
    atr = ta.atr(length) / src
    lower := highest_custom(math.max(highest_custom(highest_custom(src, BearGuy) * (1 - (atr + ((1 / (rsilower) * mult)))), BearGuy), src * sl), BearGuy)
    upper := lowest_custom(math.min(lowest_custom(lowest_custom(src, BearGuy) * (1 + (atr + ((1 / (rsiupper) * mult)))), BearGuy), src * tp), BearGuy)
    var float thresh = na
    if na(thresh)
        thresh := lower
    if na(dir)
        dir := 1
    if crossdown
        dir := -1
    if crossup
        dir := 1
    if dir == 1
        thresh := lower
    if dir == -1
        thresh := upper
    crossup := ta.crossover(src, thresh)
    crossdown := ta.crossunder(src, thresh)
    thresh

rsiclose = rsilev(hclose, rsi_length, rsi_mult, sltp)

//PLOTTING
var color col = color.lime
if hclose > rsiclose
    col := color.lime
if hclose < rsiclose
    col := color.red
plot(rsiclose, linewidth = 2, color = col)

//STRATEGY
buy = ta.crossover(hclose, rsiclose)
sell = ta.crossunder(hclose, rsiclose)

if buy[lookback]
    strategy.entry("long", strategy.long)
if sell[lookback]
    strategy.entry("Short", strategy.short)
相关推荐