概述
本策略是一个结合了多个技术指标的趋势跟踪系统,旨在通过价格和成交量数据的综合分析来捕捉市场中的强劲趋势。该策略主要基于平均趋向指数(ADX)、趋势推力指标(TTI)和成交量价格确认指标(VPCI)这三个核心指标,通过它们的协同作用来识别潜在的趋势机会并进行交易决策。
策略的核心思想是利用ADX来确认趋势的存在和强度,使用TTI来判断趋势的方向和动量,最后通过VPCI来验证价格走势是否得到成交量的支持。只有当这三个指标同时满足特定条件时,策略才会发出入场信号。这种多重确认机制旨在提高交易的准确性和可靠性,减少虚假信号的出现。
策略原理
ADX(平均趋向指数):
- 用于衡量市场趋势的强度,而不考虑趋势方向。
- 当ADX大于30时,被认为存在强劲趋势。
TTI(趋势推力指标):
- 类似于MACD,但incorporates成交量权重。
- 通过比较快速和慢速成交量加权移动平均线(VWMA)来判断趋势方向和强度。
- 当TTI线位于信号线之上时,表示上升趋势。
VPCI(成交量价格确认指标):
- 结合了价格和成交量数据,用于确认价格走势是否得到成交量的支持。
- 当VPCI大于0时,表示价格走势得到成交量的确认。
策略逻辑: - 入场条件:ADX > 30 且 TTI > 信号线 且 VPCI > 0 - 出场条件:VPCI < 0
这种设计确保只有在存在强劲趋势(由ADX确认),趋势方向向上(由TTI确认),且价格走势得到成交量支持(由VPCI确认)的情况下才会入场。当成交量不再支持价格走势时(VPCI < 0),策略会立即平仓,以保护已获得的利润。
策略优势
多重确认机制:通过综合考虑趋势强度、方向和成交量支持,大大降低了误判的风险,提高了交易的可靠性。
动态适应市场:策略能够根据市场条件的变化动态调整,适用于不同的市场环境。
成交量整合:将成交量因素纳入考虑,提供了更全面的市场视角,有助于识别更可靠的交易机会。
风险管理:通过VPCI的实时监控,能够在成交量支持减弱时及时退出,有效控制风险。
灵活性:策略参数可根据不同市场和交易品种进行优化,具有较强的适应性。
趋势捕捉能力:专注于捕捉强劲趋势,有潜力获得较大的利润。
策略风险
滞后性:技术指标本质上具有一定的滞后性,可能导致入场或出场时机不够理想。
过度交易:在剧烈波动的市场中,可能产生频繁的交易信号,增加交易成本。
假突破风险:在横盘整理后的初始突破阶段,可能出现虚假信号。
趋势反转风险:强趋势结束时,策略可能无法及时识别,导致回撤。
参数敏感性:策略性能可能对参数设置较为敏感,不当的参数可能导致表现不佳。
市场适应性:策略可能在某些特定市场环境下表现更好,而在其他环境中效果欠佳。
风险缓解方法: - 引入额外的过滤器,如趋势线分析或支撑/阻力位考虑。 - 实施更严格的风险管理措施,如设置止损和利润目标。 - 进行广泛的回测和参数优化,以找到最佳设置。 - 考虑在不同时间框架上应用策略,以提高信号的可靠性。
策略优化方向
动态参数调整:
- 实现:根据市场波动性自动调整ADX、TTI和VPCI的参数。
- 原因:提高策略对不同市场条件的适应能力,增强性能稳定性。
多时间框架分析:
- 实现:结合更长和更短的时间框架信号。
- 原因:提供更全面的市场视角,减少假信号,增加交易的可靠性。
机器学习整合:
- 实现:使用机器学习算法优化参数选择和信号生成。
- 原因:提高策略的适应性和预测准确性,减少人为偏见。
情绪指标整合:
- 实现:加入市场情绪指标,如VIX或期权隐含波动率。
- 原因:捕捉市场情绪变化,提前预测可能的趋势变化。
自适应过滤器:
- 实现:根据市场条件动态调整信号过滤标准。
- 原因:在不同市场环境下保持策略的有效性,减少过度交易。
风险管理增强:
- 实现:引入动态止损和利润目标设置。
- 原因:更好地控制风险,优化资金管理。
多品种相关性分析:
- 实现:考虑不同交易品种之间的相关性。
- 原因:分散风险,识别更可靠的交易机会。
总结
多指标趋势跟踪与成交量确认策略是一个综合性的交易系统,通过结合ADX、TTI和VPCI这三个强大的技术指标,旨在捕捉市场中的强劲趋势并进行有效的风险管理。该策略的核心优势在于其多重确认机制,通过同时考虑趋势强度、方向和成交量支持,大大提高了交易信号的可靠性。
然而,任何交易策略都存在潜在风险,本策略也不例外。主要风险包括指标的滞后性、过度交易的可能性以及在特定市场环境下的适应性问题。为了缓解这些风险,建议traders进行充分的回测、参数优化,并结合其他分析工具和风险管理技术。
通过提出的优化方向,如动态参数调整、多时间框架分析和机器学习的整合,该策略有潜力进一步提升其性能和适应性。这些优化不仅可以增强策略的稳健性,还可以使其更好地适应不断变化的市场环境。
总的来说,多指标趋势跟踪与成交量确认策略为traders提供了一个强大的工具,用于识别和利用市场趋势。通过持续的优化和谨慎的风险管理,该策略有潜力在各种市场条件下产生稳定的回报。然而,使用者应始终牢记,没有完美的交易策略,持续的学习、适应和风险管理对于长期成功至关重要。
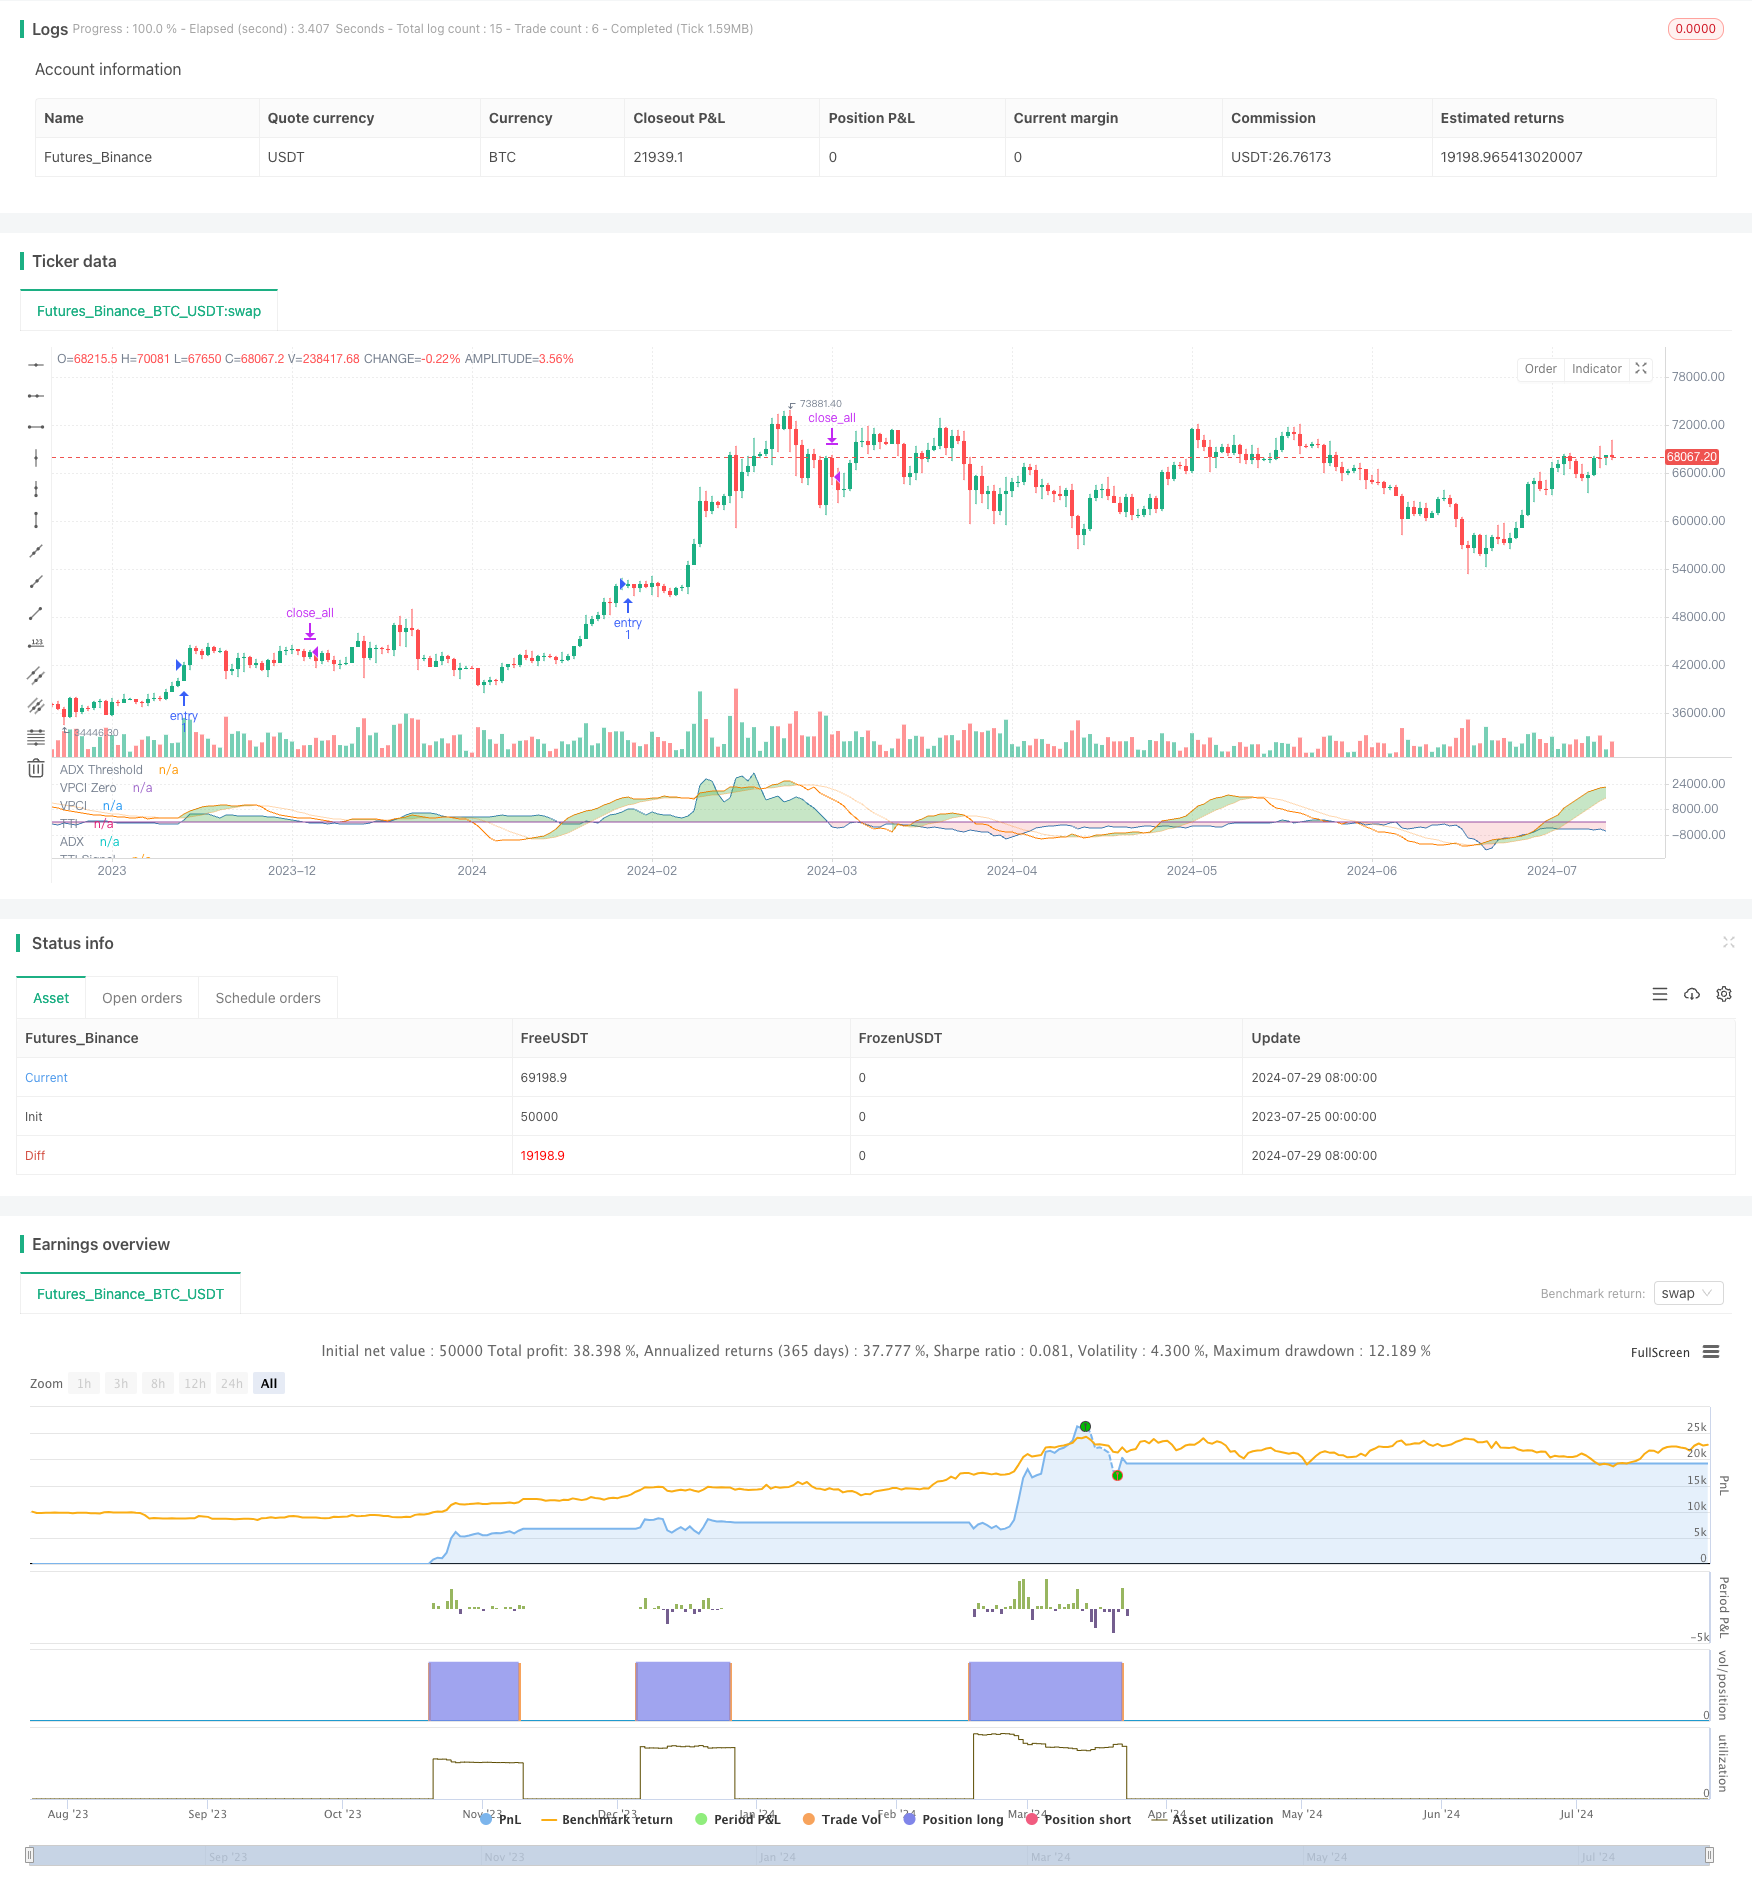
/*backtest
start: 2023-07-25 00:00:00
end: 2024-07-30 00:00:00
period: 1d
basePeriod: 1h
exchanges: [{"eid":"Futures_Binance","currency":"BTC_USDT"}]
*/

// This Pine Script™ code is subject to the terms of the Mozilla Public License 2.0 at https://mozilla.org/MPL/2.0/
// © PineCodersTASC

//  TASC Issue: August 2024 - Vol. 42
//     Article: Volume Confirmation For A Trend System.
//              The Trend Thrust Indicator And
//              Volume Price Confirmation Indicator.
//  Article By: Buff Pelz Dormeier
//    Language: TradingView's Pine Script™ v5
// Provided By: PineCoders, for tradingview.com


//@version=5
string title = "TASC 2024.08 Volume Confirmation For A Trend System"
string stitle = "VCTS"
strategy(title, stitle, false)


// Input
lenADX  = input.int(14, "ADX Length", 1)
smt     = input.int(14, "ADX Smoothing", 1, 50)
fastTTI = input.int(13, "TTI Fast Average", 1)
slowTTI = input.int(26, "TTI Slow Average", 1)
smtTTI  = input.int(9,  "TTI Signal Length", 1)
shortVP = input.int(5,  "VPCI Short-Term Average", 1)
longVP  = input.int(25, "VPCI Long-Term Average", 1)


// Functions
// ADX
adx(lenADX, smt) =>
    upDM   =  ta.change(high)
    dwDM   = -ta.change(low)
    pDM    = na(upDM) ? na : upDM > dwDM and upDM > 0 ? upDM : 0
    mDM    = na(dwDM) ? na : dwDM > upDM and dwDM > 0 ? dwDM : 0
    ATR    = ta.atr(lenADX)
    pDI    = fixnan(100 * ta.rma(pDM, lenADX) / ATR)
    mDI    = fixnan(100 * ta.rma(mDM, lenADX) / ATR)
    ADX    = 100*ta.rma(math.abs((pDI - mDI)  / (pDI + mDI)), smt)
    ADX

// TTI
// See also: https://www.tradingview.com/script/B6a7HzVn/
tti(price, fast, slow) =>
    fastMA = ta.vwma(price, fast)
    slowMA = ta.vwma(price, slow)
    VWMACD = fastMA - slowMA
    vMult  = math.pow((fastMA / slowMA), 2)
    VEFA   = fastMA * vMult
    VESA   = slowMA / vMult
    TTI    = VEFA - VESA
    signal = ta.sma(TTI, smtTTI)
    [TTI, signal]

// VPCI
// See also: https://www.tradingview.com/script/lmTqKOsa-Indicator-Volume-Price-Confirmation-Indicator-VPCI/
vpci(long, short) =>
    VPC    = ta.vwma(close, long)  - ta.sma(close, long)
    VPR    = ta.vwma(close, short) / ta.sma(close, short)
    VM     = ta.sma(volume, short) / ta.sma(volume, long)
    VPCI   = VPC * VPR * VM
    VPCI


// Calculations
float ADX     = adx(lenADX, smt)
[TTI, signal] = tti(close, fastTTI, slowTTI)
float VPCI    = vpci(longVP, shortVP)


// Plot
col1  = #4daf4a50
col2  = #e41a1c20
col0  = #ffffff00
adxL1 = plot(ADX,    "ADX", #984ea3)
adxL0 = plot(30,     "ADX Threshold", #984ea350)
ttiL1 = plot(TTI,    "TTI", #ff7f00)
ttiL0 = plot(signal, "TTI Signal", #ff7f0050)
vpcL1 = plot(VPCI*10,"VPCI", #377eb8)
vpcL0 = plot(0,      "VPCI Zero", #377eb850)
fill(adxL1, adxL0, ADX > 30 ? col1 : col0)
fill(ttiL1, ttiL0, TTI > signal ? col1 : col0)
fill(vpcL1, vpcL0, VPCI > 0 ? col1 : col2)


// Strategy entry/exit rules
if ADX > 30
    if TTI > signal
        if VPCI > 0
            strategy.entry("entry", strategy.long)
if VPCI < 0
    strategy.close_all("exit")