概述
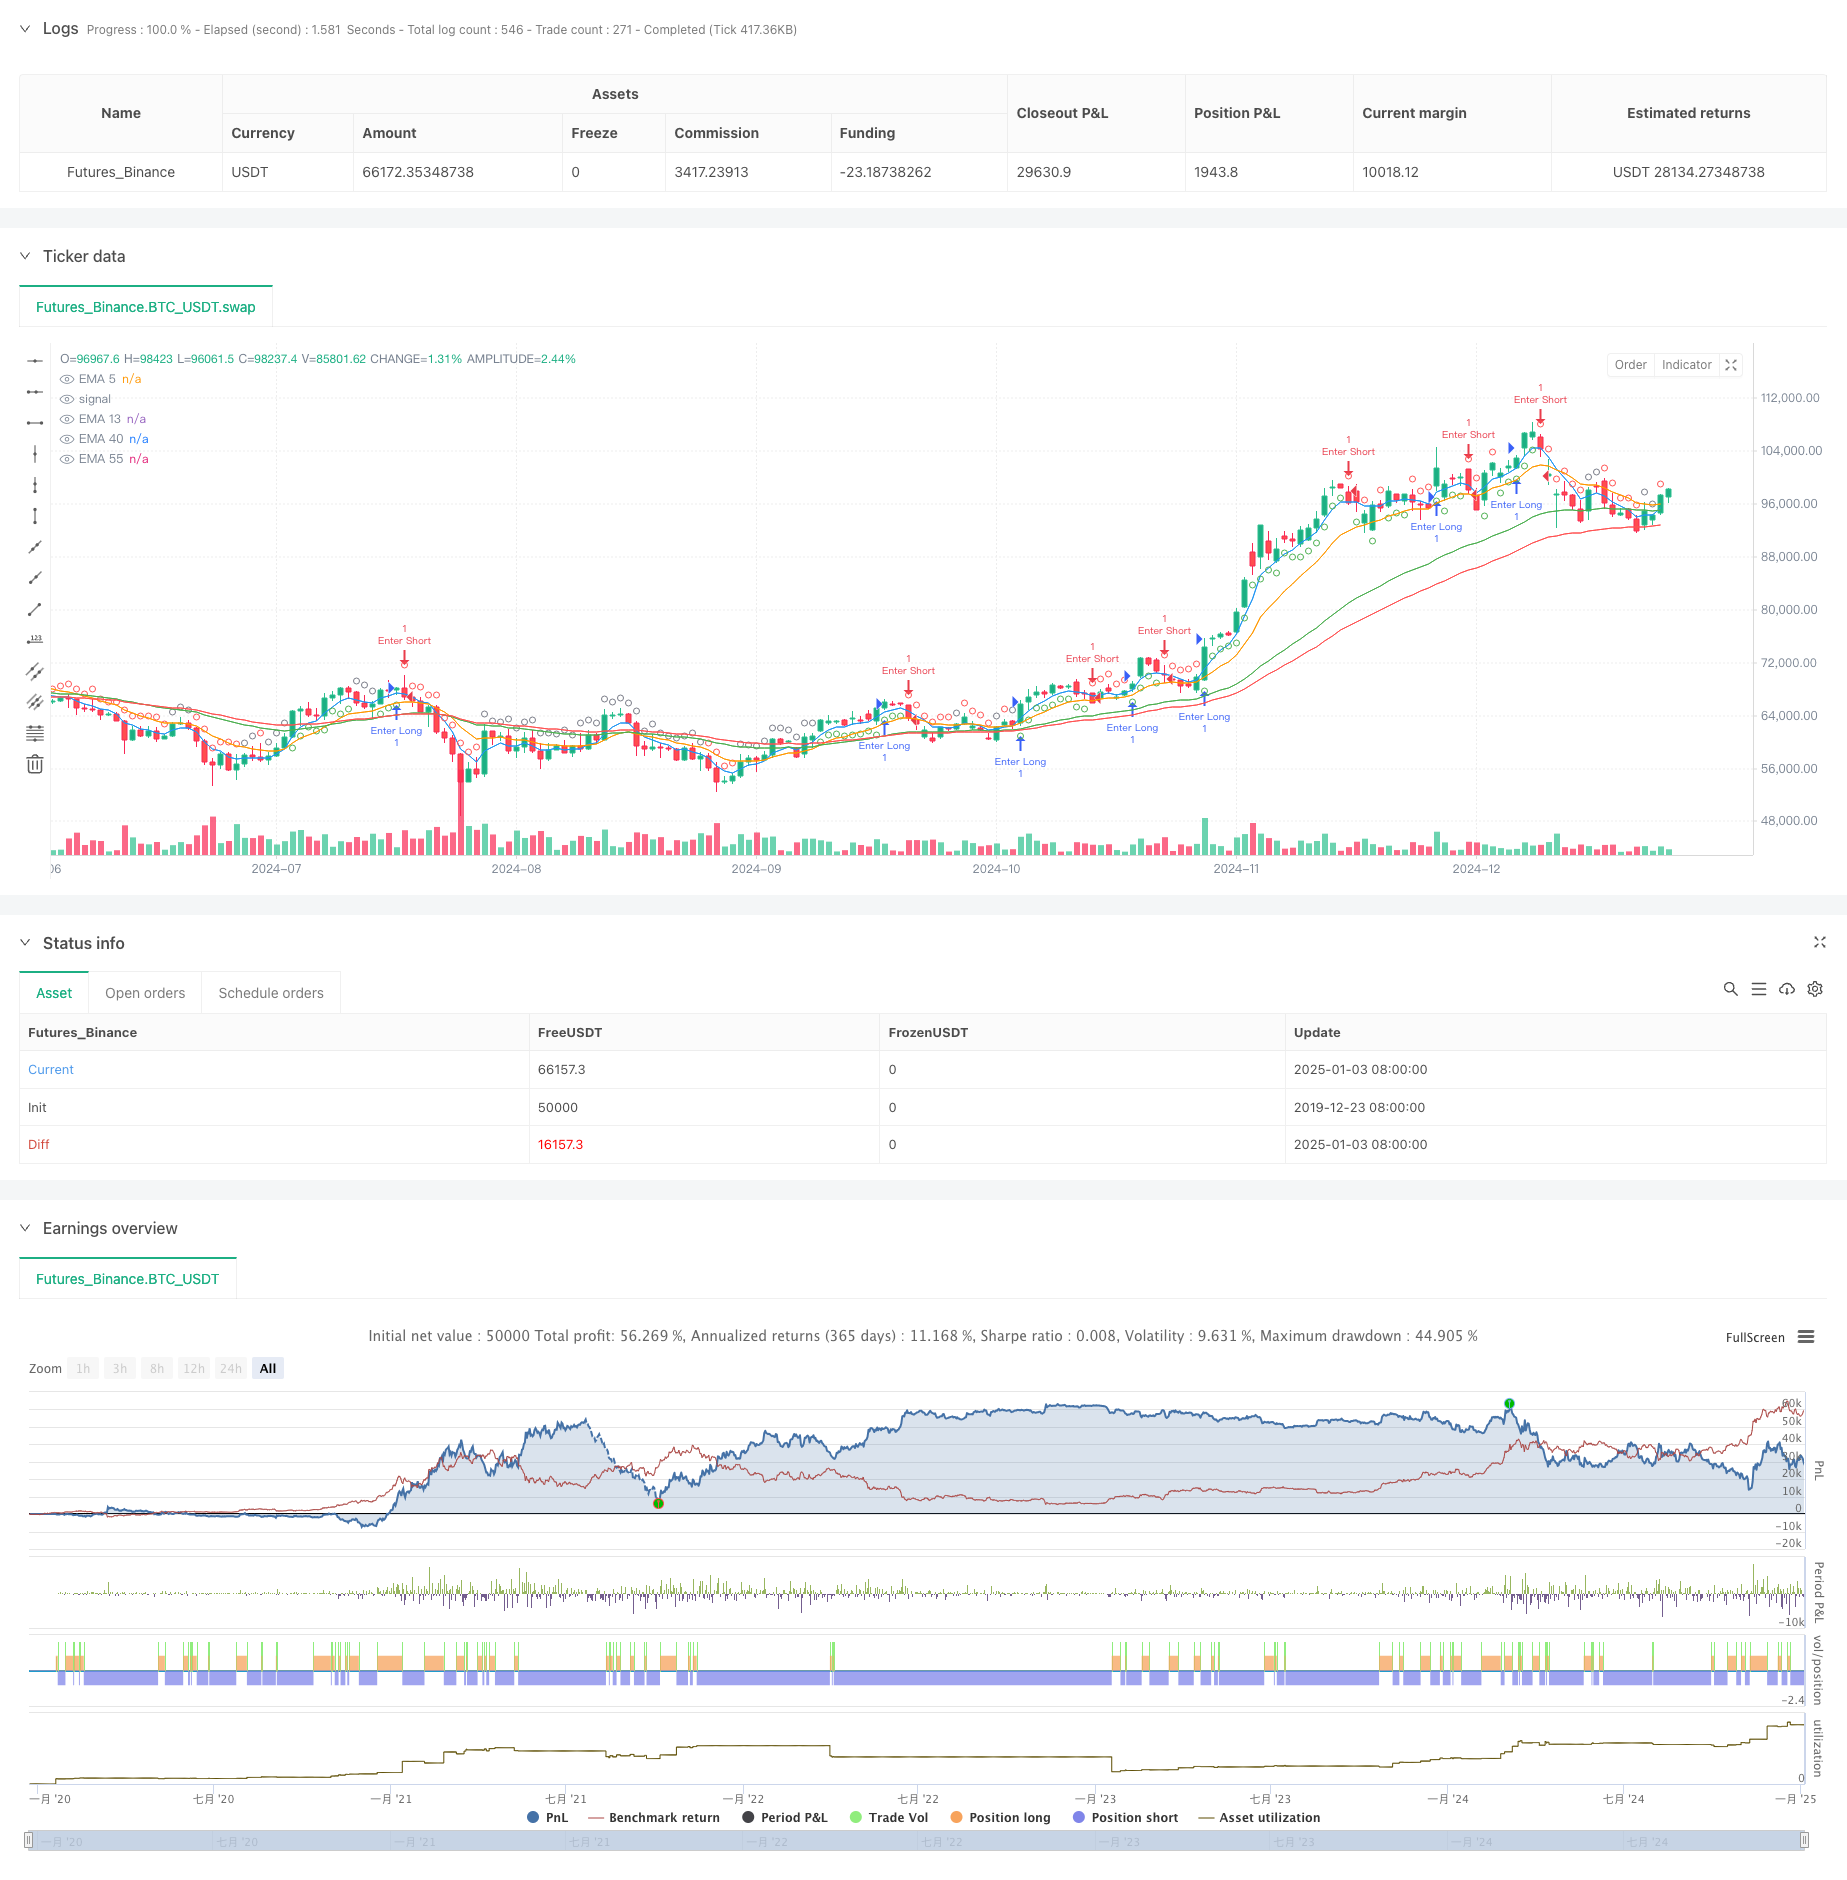
该策略是一个基于多重技术指标的交易系统,主要结合了指数移动平均线(EMA)、相对强弱指标(RSI)和距离计算三个核心组件。策略通过动态监测市场趋势强度和动量变化,在保持信号稳定性的同时,有效规避假突破和震荡行情。系统采用多重确认机制,通过计算指标之间的相对距离和动态阈值,实现了对市场状态的精确判断。
策略原理
策略采用四条不同周期的EMA线(5、13、40、55周期)构建趋势框架,通过RSI指标(14周期)增强市场方向判断。具体来说: 1. 当5周期EMA上穿13周期EMA且40周期EMA上穿55周期EMA时,系统发出多头信号 2. 当RSI值大于50且高于其14周期平均值时,确认多头趋势 3. 系统计算EMA5与EMA13之间的距离,将其与过去5根K线的平均距离比较,用于判断趋势强度 4. 当RSI超过60时发出强烈买入信号,低于40时发出强烈卖出信号 5. 通过计算EMA40与EMA13之间的距离变化,验证趋势持续性
策略优势
- 多重确认机制显著降低虚假信号
- 动态距离计算帮助识别趋势强度变化
- RSI阈值设计提供了额外的市场强弱判断
- 信号持续性判断机制降低了频繁交易风险
- 趋势转折点预警功能助于提前布局
- 系统具有良好的自适应性,能够适应不同市场环境
策略风险
- 在横盘震荡市场可能产生过多中性信号
- 多重指标可能导致信号滞后
- 参数优化过度可能造成过拟合
- 快速趋势反转时可能出现较大回撤
- EMA交叉产生的假突破需要额外过滤
策略优化方向
- 引入成交量指标增强信号可靠性
- 优化RSI参数,提高市场拐点预判能力
- 添加ATR指标动态调整止损位置
- 开发自适应参数体系提升策略稳定性
- 构建多时间周期信号确认机制
- 增加波动率过滤器降低假信号
总结
该策略通过多重技术指标的协同配合,在保持信号稳定性的同时有效控制风险。系统设计充分考虑了市场的多样性,采用动态阈值和距离计算方法提高了适应能力。通过不断优化和完善,策略有望在不同市场环境下保持稳定的表现。
策略源码
/*backtest
start: 2019-12-23 08:00:00
end: 2025-01-04 08:00:00
period: 1d
basePeriod: 1d
exchanges: [{"eid":"Futures_Binance","currency":"BTC_USDT"}]
*/

//@version=6
strategy("EMA Crossover Strategy with RSI Average, Distance, and Signal Persistence", overlay=true, fill_orders_on_standard_ohlc=true)

// Define EMAs
ema5 = ta.ema(close, 5)
ema13 = ta.ema(close, 13)
ema40 = ta.ema(close, 40)
ema55 = ta.ema(close, 55)

// Calculate 14-period RSI
rsi = ta.rsi(close, 14)

// Calculate the RSI average
averageRsiLength = 14  // Length for RSI average
averageRsi = ta.sma(rsi, averageRsiLength)

// Define conditions
emaShortTermCondition = ema5 > ema13  // EMA 5 > EMA 13
emaLongTermCondition = ema40 > ema55  // EMA 40 > EMA 55
rsiCondition = rsi > 50 and rsi > averageRsi  // RSI > 50 and RSI > average RSI

// Track the distance between ema5 and ema13 for the last 5 candles
distance = math.abs(ema5 - ema13)
distanceWindow = 5
distances = array.new_float(distanceWindow, 0.0)
array.shift(distances)
array.push(distances, distance)

// Calculate the average distance of the last 5 distances
avgDistance = array.avg(distances)

// Track distance between EMA40 and EMA13 for the last few candles
distance40_13 = math.abs(ema40 - ema13)
distanceWindow40_13 = 5
distances40_13 = array.new_float(distanceWindow40_13, 0.0)
array.shift(distances40_13)
array.push(distances40_13, distance40_13)

// Calculate the average distance for EMA40 and EMA13
avgDistance40_13 = array.avg(distances40_13)

// Neutral condition: if the current distance is lower than the average of the last 5 distances
neutralCondition = distance < avgDistance or ema13 > ema5

// Short signal condition: EMA40 crosses above EMA55
shortCondition = ema40 > ema55

// Conditions for Green and Red signals (based on RSI thresholds)
greenSignalCondition = rsi > 60  // Green if RSI > 60, regardless of EMAs
redSignalCondition = rsi < 40  // Red if RSI < 40, regardless of EMAs

// Combine conditions for a buy signal (Long)
longCondition = emaShortTermCondition and emaLongTermCondition and rsiCondition and not neutralCondition

// Store the last signal (initialized as na)
var string lastSignal = na

// Track previous distance between EMA40 and EMA13
var float prevDistance40_13 = na

// Check if the current distance between EMA40 and EMA13 is greater than the previous
distanceCondition = (not na(prevDistance40_13)) ? (distance40_13 > prevDistance40_13) : true

// Update the lastSignal only if the current candle closes above EMA5, otherwise recalculate it
if (close > ema5)
    if (longCondition and distanceCondition)
        lastSignal := "long"
    else if (shortCondition and distanceCondition)
        lastSignal := "short"
    else if (neutralCondition)
        lastSignal := "neutral"
    // Add green signal based on RSI
    else if (greenSignalCondition)
        lastSignal := "green"
    // Add red signal based on RSI
    else if (redSignalCondition)
        lastSignal := "red"

// If current candle doesn't close above EMA5, recalculate the signal based on current conditions
if (close <= ema5)
    if (longCondition)
        lastSignal := "long"
    else if (shortCondition)
        lastSignal := "short"
    else if (greenSignalCondition)
        lastSignal := "green"
    else if (redSignalCondition)
        lastSignal := "red"
    else
        lastSignal := "neutral"

// Update previous distance for next comparison
prevDistance40_13 := distance40_13

// Set signal conditions based on lastSignal
isLong = lastSignal == "long"
isShort = lastSignal == "short"
isNeutral = lastSignal == "neutral"
isGreen = lastSignal == "green"
isRed = lastSignal == "red"

// Plot signals with preference for long (green) and short (red), no multiple signals per bar
plotshape(isLong, style=shape.circle, color=color.green, location=location.belowbar, size=size.tiny)
plotshape(isShort and not isLong, style=shape.circle, color=color.red, location=location.abovebar, size=size.tiny)
plotshape(isNeutral and not isLong and not isShort, style=shape.circle, color=color.gray, location=location.abovebar, size=size.tiny)
plotshape(isGreen and not isLong and not isShort and not isNeutral, style=shape.circle, color=color.green, location=location.belowbar, size=size.tiny)
plotshape(isRed and not isLong and not isShort and not isNeutral, style=shape.circle, color=color.red, location=location.abovebar, size=size.tiny)

// Plot EMAs for visualization
plot(ema5, color=color.blue, title="EMA 5")
plot(ema13, color=color.orange, title="EMA 13")
plot(ema40, color=color.green, title="EMA 40")
plot(ema55, color=color.red, title="EMA 55")

// Plot RSI average for debugging (optional, remove if not needed)
// plot(averageRsi, title="Average RSI", color=color.orange)
// hline(50, title="RSI 50", color=color.gray)  // Optional: Comment this out too if not needed


if isLong
    strategy.entry("Enter Long", strategy.long)
else if isShort
    strategy.entry("Enter Short", strategy.short)
相关推荐