资源加载中... loading...

Enhanced Dynamic Bollinger Bands Trading Strategy

Author: ChaoZhang, Date: 2024-06-28 15:31:19
Tags: BBSMASDMA

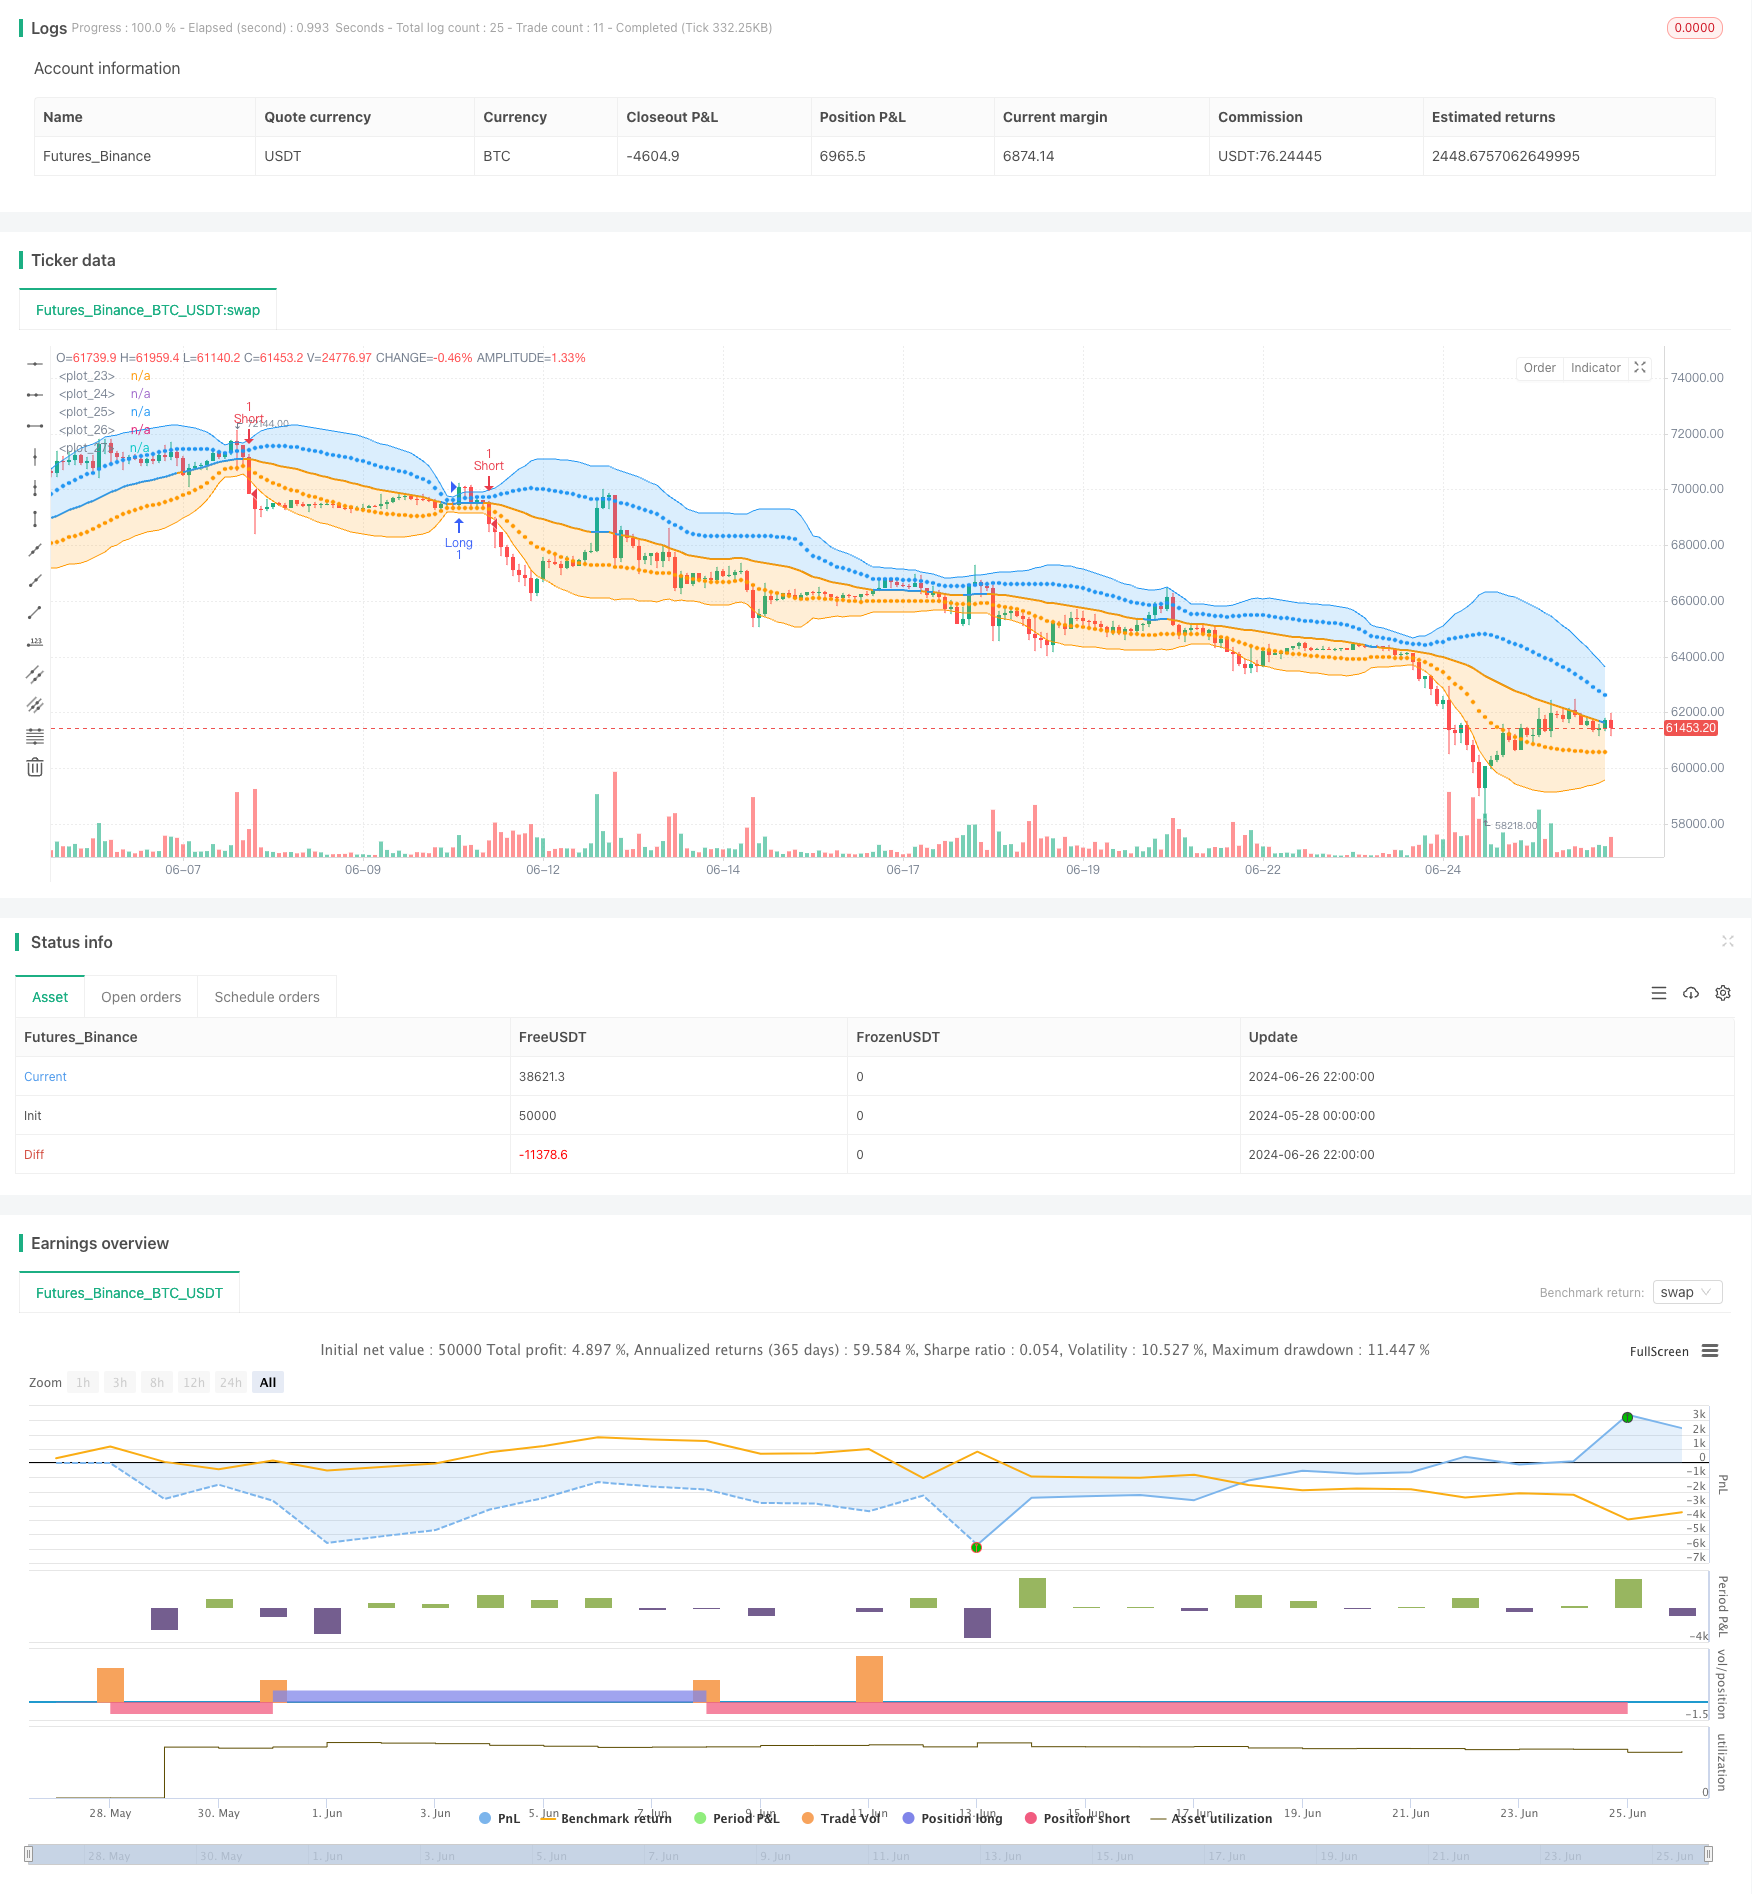
img

Overview

This strategy is an enhanced trading system based on the Bollinger Bands indicator, optimizing the traditional Bollinger Bands strategy by using double standard deviation bands. The strategy utilizes price interactions with different standard deviation levels to generate trading signals, aiming to capture both trend and reversal opportunities in the market.

Strategy Principle

The core of this strategy lies in using two different levels of Bollinger Bands:

  1. Bollinger Bands are calculated based on a 34-period Simple Moving Average (SMA).
  2. The inner Bollinger Bands use 1 standard deviation, while the outer Bollinger Bands use 2 standard deviations.
  3. A long signal is triggered when the price breaks above the outer upper Bollinger Band; a short signal is triggered when it breaks below the lower band.
  4. Long positions are closed when the price falls back to the outer lower Bollinger Band; short positions are closed when it rises back to the upper band.

This dual-layer Bollinger Band design allows the strategy to operate flexibly under different market conditions, capturing strong trends while also identifying potential reversal points.

Strategy Advantages

  1. Dynamic Adaptability: Bollinger Bands automatically adjust based on market volatility, enabling the strategy to adapt to different market environments.
  2. Trend Following and Reversal: The strategy can both follow strong trends and seek reversal opportunities in extreme cases.
  3. Risk Management: Using the outer Bollinger Bands as stop-loss points helps control risk for each trade.
  4. Visual Feedback: The strategy provides clear visual feedback, helping traders intuitively understand market conditions.
  5. Flexibility: Parameters can be adjusted, allowing traders to optimize according to different markets and personal preferences.

Strategy Risks

  1. False Breakouts: In ranging markets, prices may frequently touch Bollinger Band boundaries, leading to excessive false signals.
  2. Lag: As a lagging indicator, Bollinger Bands may not react timely in rapidly changing markets.
  3. Overtrading: In highly volatile markets, the strategy may generate too many trading signals, increasing transaction costs.
  4. Trend Dependency: The strategy may not perform well in markets without clear trends.
  5. Parameter Sensitivity: Strategy performance highly depends on chosen parameters, which may require different optimization settings for various markets.

Strategy Optimization Directions

  1. Introduce Additional Filters: Combine with other technical indicators (such as RSI or MACD) to confirm signals and reduce false breakouts.
  2. Dynamic Parameter Adjustment: Automatically adjust Bollinger Band parameters based on market volatility to improve strategy adaptability.
  3. Incorporate Volume Analysis: Use volume as an auxiliary indicator to enhance signal reliability.
  4. Implement Adaptive Periods: Use adaptive periods instead of fixed periods to better capture market rhythms.
  5. Optimize Position Management: Dynamically adjust position sizes based on Bollinger Band width, increasing positions when certainty is high.
  6. Add Market State Recognition: Incorporate market state (trend/range) judgment in the strategy to adapt to different market conditions.

Summary

The Enhanced Dynamic Bollinger Bands Trading Strategy is a flexible and powerful trading system that effectively balances trend-following and reversal trading needs through a dual-layer Bollinger Band structure. The strategy’s main advantages lie in its dynamic adaptability and clear visual feedback, making it a potent tool suitable for various market conditions. However, traders need to be aware of the risks of false breakouts and overtrading, and consider introducing additional filters and dynamic parameter adjustments to optimize strategy performance. Through continuous testing and optimization, this strategy has the potential to become a reliable trading system, providing traders with stable profit opportunities.


/*backtest
start: 2024-05-28 00:00:00
end: 2024-06-27 00:00:00
period: 2h
basePeriod: 15m
exchanges: [{"eid":"Futures_Binance","currency":"BTC_USDT"}]
*/

//@version=5
// Bollinger Bands: Madrid : 14/SEP/2014 11:07 : 2.0
// This displays the traditional Bollinger Bands, the difference is 
// that the 1st and 2nd StdDev are outlined with two colors and two
// different levels, one for each Standard Deviation

strategy(shorttitle='MBB', title='Bollinger Bands', overlay=true)
src = input(close)
length = input.int(34, minval=1)
mult = input.float(2.0, minval=0.001, maxval=50)

basis = ta.sma(src, length)
dev = ta.stdev(src, length)
dev2 = mult * dev

upper1 = basis + dev
lower1 = basis - dev
upper2 = basis + dev2
lower2 = basis - dev2

colorBasis = src >= basis ? color.blue : color.orange

pBasis = plot(basis, linewidth=2, color=colorBasis)
pUpper1 = plot(upper1, color=color.new(color.blue, 0), style=plot.style_circles)
pUpper2 = plot(upper2, color=color.new(color.blue, 0))
pLower1 = plot(lower1, color=color.new(color.orange, 0), style=plot.style_circles)
pLower2 = plot(lower2, color=color.new(color.orange, 0))

fill(pBasis, pUpper2, color=color.new(color.blue, 80))
fill(pUpper1, pUpper2, color=color.new(color.blue, 80))
fill(pBasis, pLower2, color=color.new(color.orange, 80))
fill(pLower1, pLower2, color=color.new(color.orange, 80))


if (close > upper2)
    strategy.entry("Long", strategy.long)
if (close < lower2)
    strategy.entry("Short", strategy.short)
if (close <= lower2)
    strategy.close("Long")
if (close >= upper2)
    strategy.close("Short")

Related

More