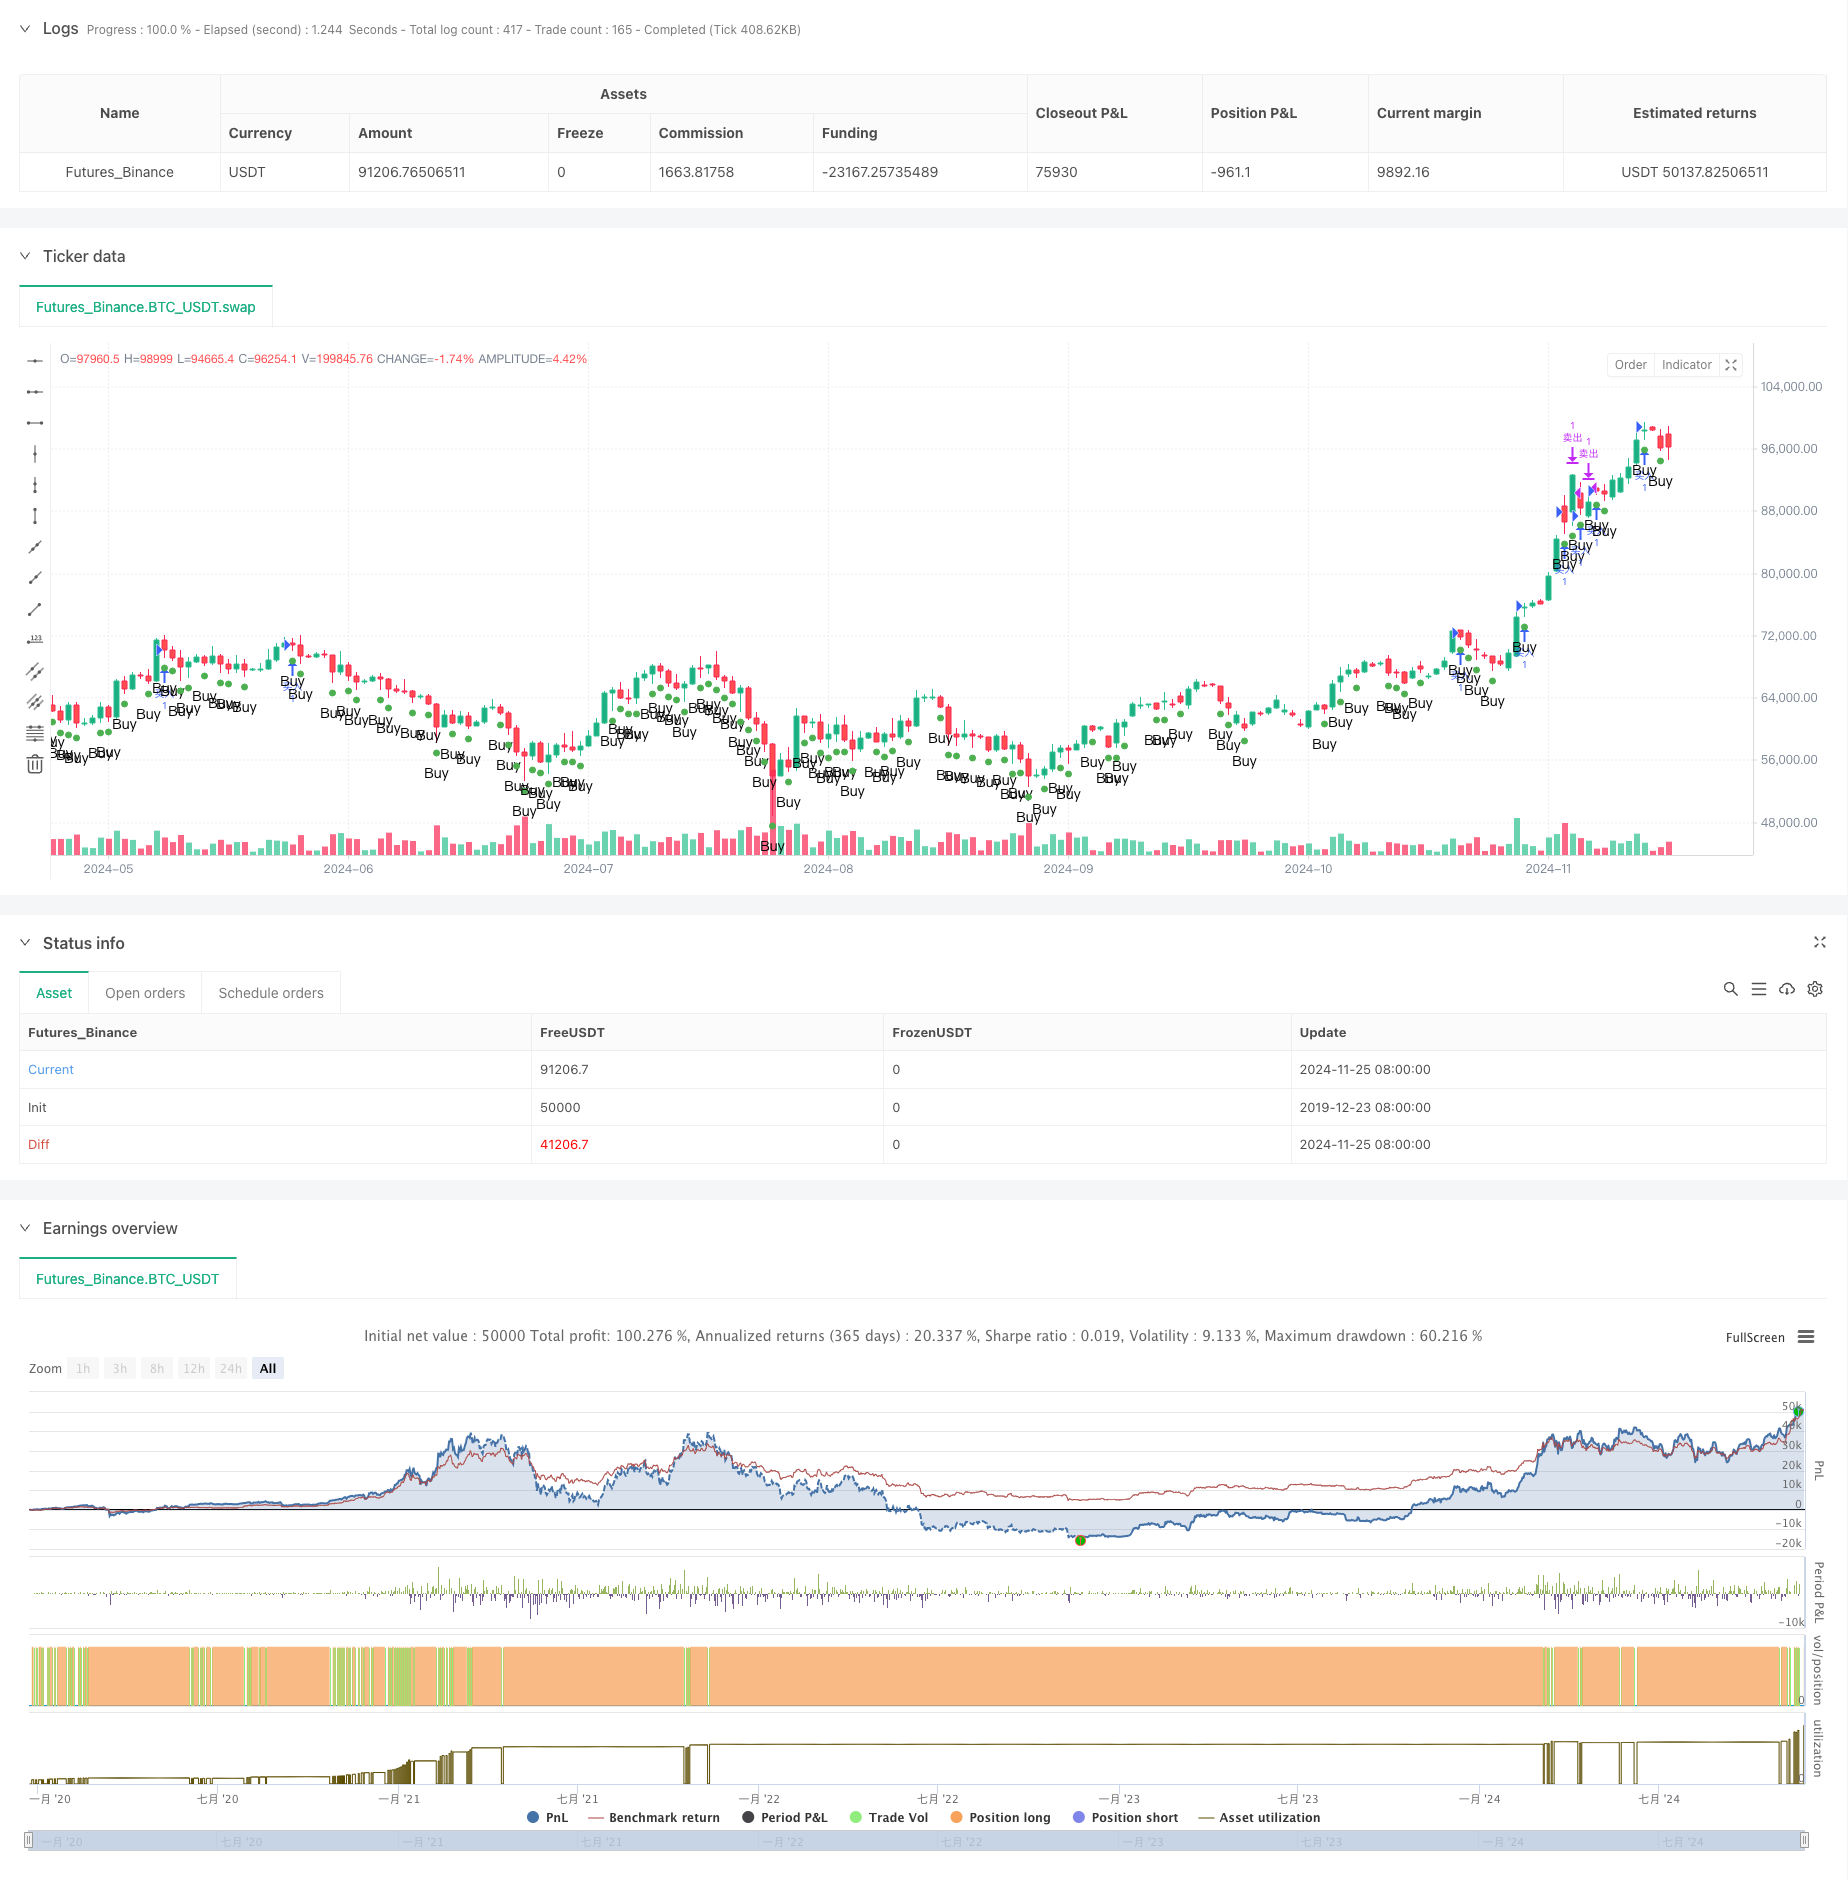
Dynamic Take-Profit Smart Trailing Strategy
Author: ChaoZhang, Date: 2024-11-27 16:41:16Tags:

Overview
This strategy is an intelligent trading system based on price drop signals, combining dynamic take-profit and trailing stop-loss features. The strategy identifies potential buying opportunities by monitoring price drops while employing flexible profit-taking schemes and trailing stop mechanisms to protect profits. The core idea is to enter positions during significant price drops and maximize returns through intelligent position management.
Strategy Principles
The strategy operates through three core components: First, it identifies buy signals by setting a price drop percentage threshold (default -0.98%), triggering when a candle’s low price falls below the opening price multiplied by (1 + drop percentage). Second, it uses a fixed percentage (default 1.23%) as the target profit for setting take-profit levels. Finally, it incorporates a trailing stop mechanism (default 0.6%) to protect profits during price retracements. The strategy includes visualization components, displaying buy signals through various marker shapes.
Strategy Advantages
- Precise Signal Identification: Accurately identifies potential buying opportunities through precise price drop calculations, avoiding false signals.
- Comprehensive Risk Management: Combines fixed take-profit and trailing stop-loss, ensuring profit potential while effectively controlling risk.
- Flexible Parameters: Main parameters can be adjusted according to market conditions and trading requirements, providing high adaptability.
- Excellent Visualization: Buy signals are clearly visible, facilitating quick judgment and decision-making.
- Clear Execution Logic: Entry and exit conditions are well-defined, eliminating uncertainty from subjective judgment.
Strategy Risks
- False Breakout Risk: Frequent false signals may occur in ranging markets. Consider adding volume indicators for confirmation.
- Stop-Loss Setting Risk: Too tight trailing stops may result in premature exits, while too loose stops might sacrifice profits. Adjustment based on actual volatility is necessary.
- Market Environment Dependency: Strategy performs better in trending markets but may incur losses due to frequent trading in ranging markets.
- Parameter Sensitivity: Strategy effectiveness is sensitive to parameter settings, requiring backtesting to find optimal combinations.
Strategy Optimization Directions
- Signal Filtering: Add volume and volatility indicators as auxiliary conditions to improve signal quality.
- Dynamic Parameter Adjustment: Dynamically adjust take-profit and stop-loss parameters based on market volatility.
- Timeframe Optimization: Incorporate multiple timeframe analysis to enhance signal reliability.
- Position Management: Introduce dynamic position sizing based on signal strength and market conditions.
- Market Environment Assessment: Add market condition evaluation to adapt parameters to different market states.
Summary
This strategy builds a complete trading system by combining price drop signal identification, dynamic take-profit, and trailing stop-loss mechanisms. Its strengths lie in accurate signal identification and comprehensive risk management, though attention must be paid to false breakouts and parameter sensitivity risks. The strategy’s stability and profitability can be further enhanced by adding auxiliary indicators and optimizing parameter adjustment mechanisms. It provides a valuable strategic framework suitable for in-depth research and optimization.
/*backtest
start: 2019-12-23 08:00:00
end: 2024-11-26 00:00:00
period: 1d
basePeriod: 1d
exchanges: [{"eid":"Futures_Binance","currency":"BTC_USDT"}]
*/

//@version=5
strategy("Price Drop Buy Signal Strategy", overlay=true)

// 输入参数
percentDrop = input.float(defval=-0.98, title="Price Drop Percentage", minval=-100, step=0.01) / 100
plotShapeStyle = input.string("shape_triangle_up", "Shape", options=["shape_xcross", "shape_cross", "shape_triangle_up", "shape_triangle_down", "shape_flag", "shape_circle", "shape_arrow_up", "shape_arrow_down", "shape_label_up", "shape_label_down", "shape_square", "shape_diamond"], tooltip="Choose the shape of the buy signal marker")
targetProfit = input.float(1.23, title="目标利润百分比", step=0.01) / 100
trailingStopPercent = input.float(0.6, title="Trailing Stop Percentage", step=0.01) / 100

// 计算每根K线的涨跌幅
priceDrop = open * (1.0 + percentDrop)
isBuySignal = low <= priceDrop

// 在当前K线下方标注买入信号(可选)
plotshape(series=isBuySignal, location=location.belowbar, color=color.green, style=plotShapeStyle, size=size.small, title="Buy Signal", text="Buy")

// 显示信息
if bar_index == na
    label.new(x=bar_index, y=na, text=str.tostring(percentDrop * 100, format.mintick) + "% Drop", xloc=xloc.bar_index, yloc=yloc.price, style=label.style_label_down, color=color.new(color.green, 0))
else
    label.delete(na)

// 策略逻辑
if (isBuySignal)
    strategy.entry("买入", strategy.long)

// 目标卖出价
if (strategy.position_size > 0)
    targetSellPrice = strategy.position_avg_price * (1 + targetProfit)
    strategy.exit("卖出", from_entry="买入", limit=targetSellPrice, trail_offset=strategy.position_avg_price * trailingStopPercent)
- Triple Exponential Moving Average Trend Trading Strategy
- Multi-Timeframe EMA Trend Strategy with Daily High-Low Breakout System
- Advanced Flexible Multi-Period Moving Average Crossover Strategy
- T3 Moving Average Trend Following Strategy with Trailing Stop Loss
- Multi-Technical Indicator Trend Following Strategy with Ichimoku Cloud Breakout and Stop-Loss System
- Dual Standard Deviation Bollinger Bands Momentum Breakout Strategy
- Advanced Timeframe Fibonacci Retracement with High-Low Breakout Trading System
- RSI Dynamic Exit Level Momentum Trading Strategy
- Multi-Indicator Cross-Trend Tracking and Volume-Price Combined Adaptive Trading Strategy
- Advanced Dual Moving Average Momentum Trend Following Trading System
- Multi-Timeframe Trend Following Strategy with ATR Volatility Management
- Dynamic Cost Averaging Strategy System Based on Bollinger Bands and RSI
- Multi-SMA Support Level False Breakout Strategy with ATR Stop-Loss System
- EMA Crossover Strategy with Stop Loss and Take Profit Optimization System
- VWAP-MACD-RSI Multi-Factor Quantitative Trading Strategy
- Triple Moving Average Trend Following and Momentum Integration Quantitative Trading Strategy
- Z-Score and Supertrend Based Dynamic Trading Strategy: Long-Short Switching System
- Adaptive Bollinger Breakout with Moving Average Quantitative Strategy System
- AI-Optimized Adaptive Stop-Loss Trading System with Multiple Technical Indicator Integration
- Multi-Period Moving Average Crossover with Volume Analysis System