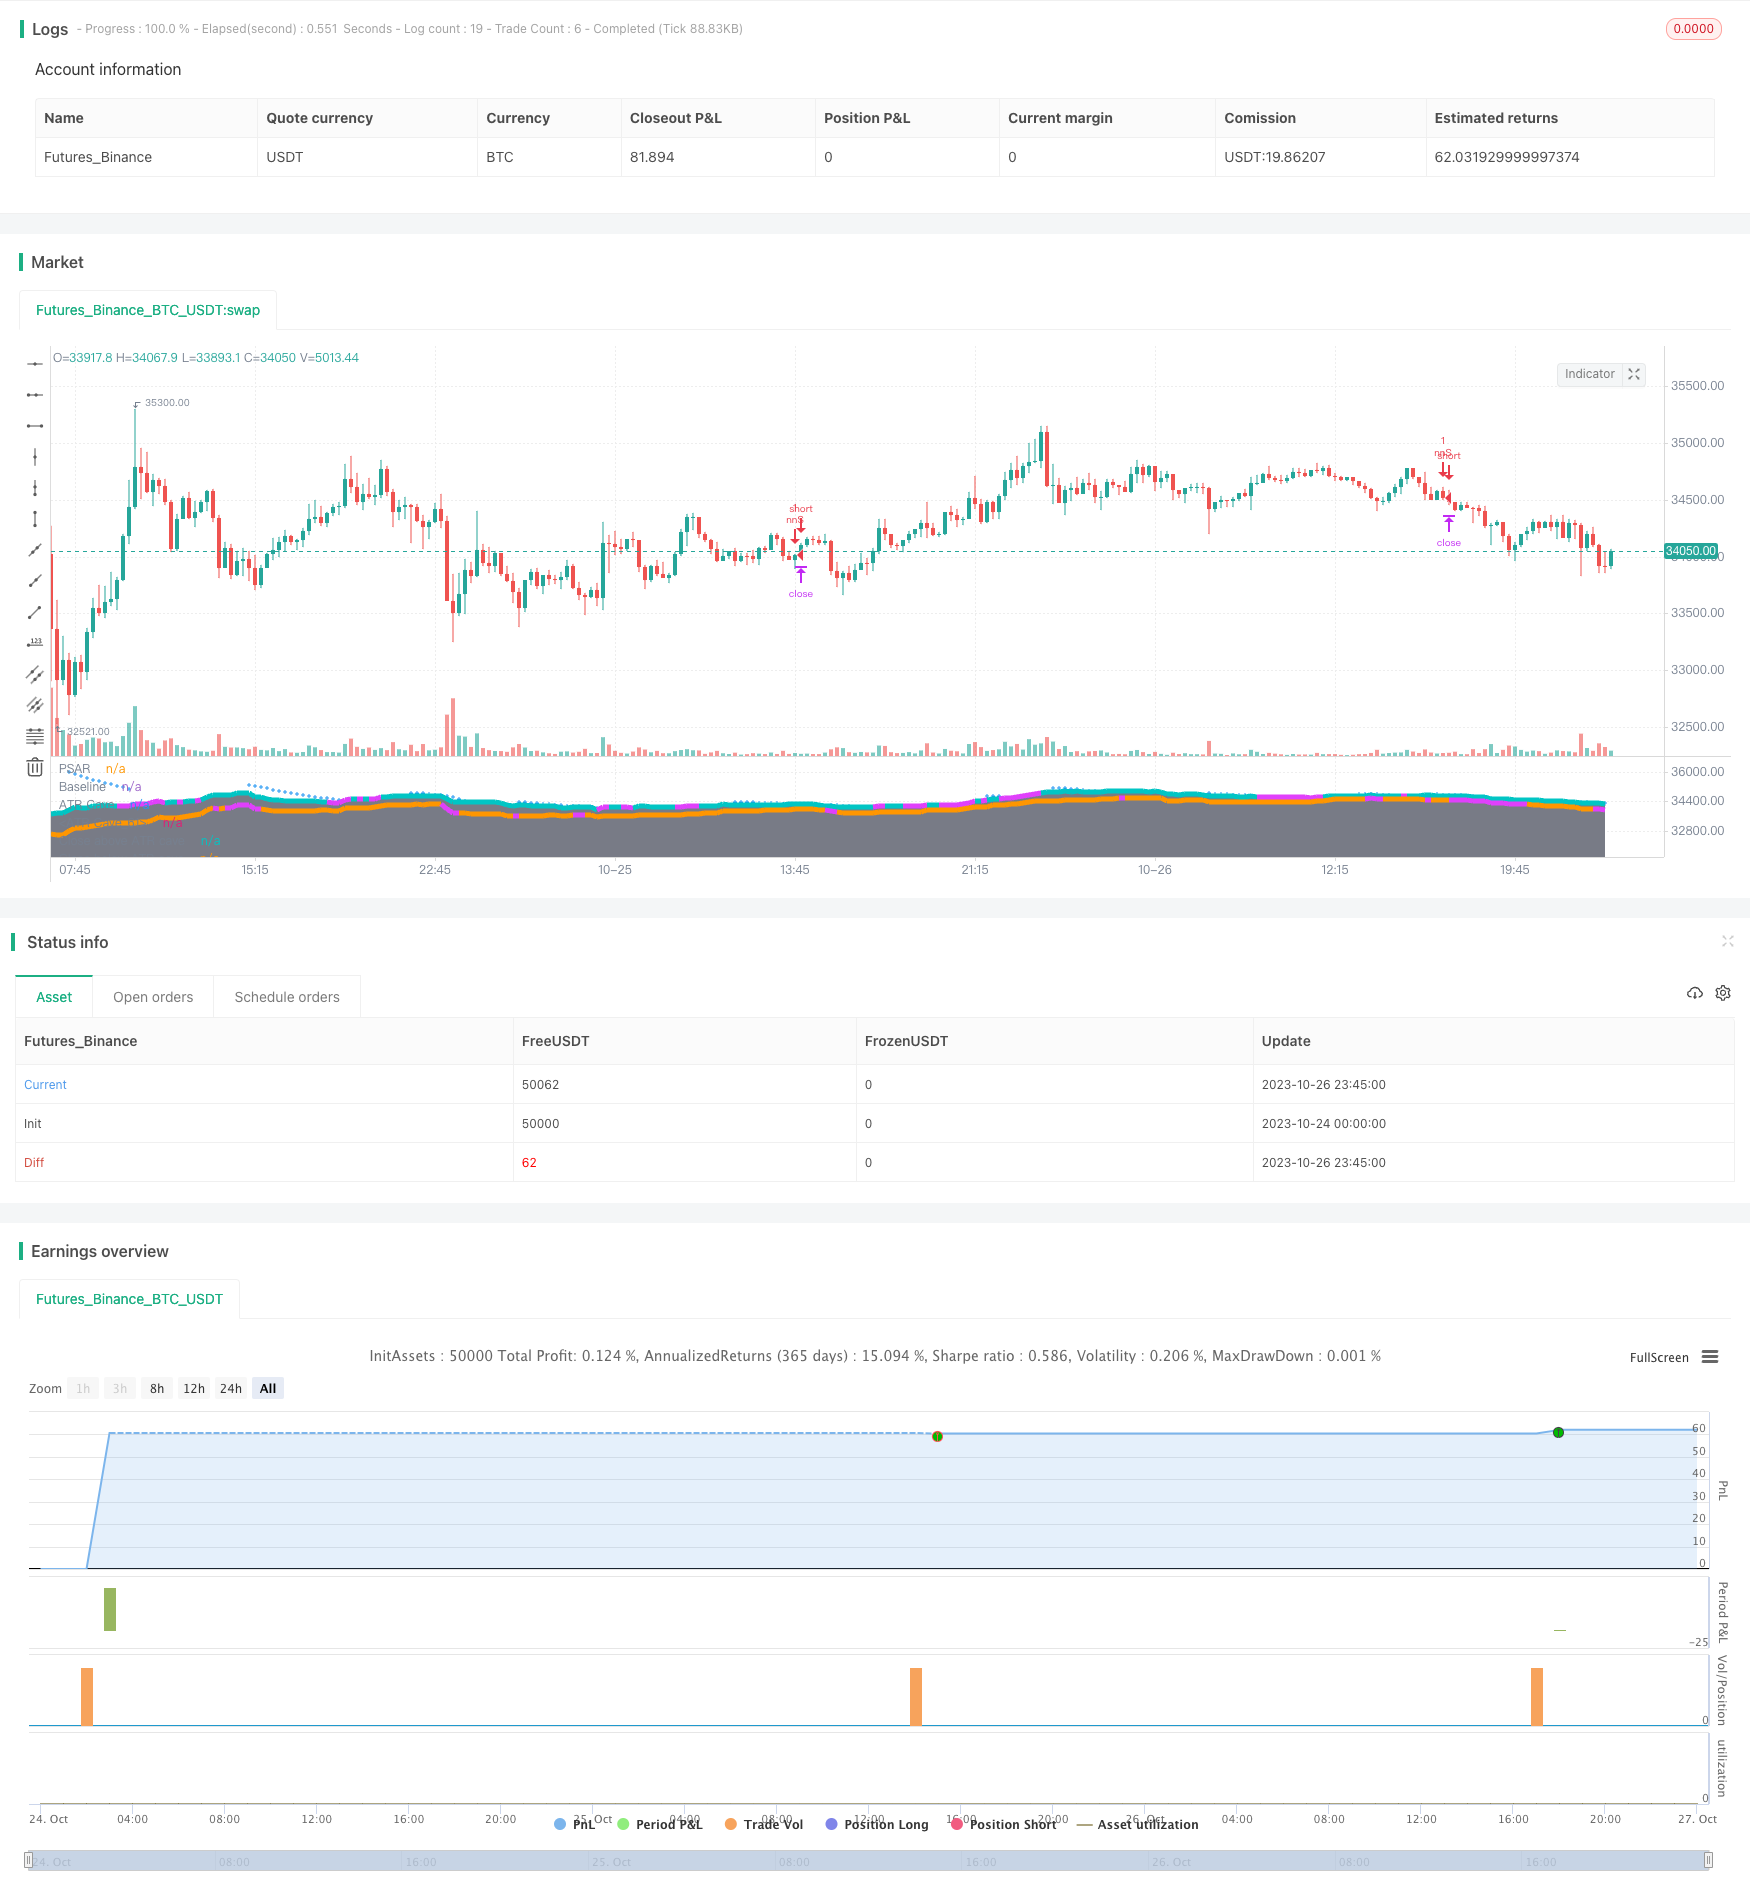
দ্বিমুখী ATR তরঙ্গ ট্রেডিং কৌশল

ওভারভিউ
দ্বি-মুখী এটিআর ওয়েভ ট্রেডিং কৌশল হল একটি প্রবণতা-অনুসরণ কৌশল যা গড় লাইন, এটিআর এবং একাধিক প্রযুক্তিগত সূচককে একত্রিত করে এবং প্রবণতা-অনুসরণ ট্রেডিংয়ের জন্য প্রবণতা-অনুসরণ করে।
কৌশল নীতি
এই কৌশলটি কিজুন লাইনকে মূল সমান্তরাল সূচক হিসাবে ব্যবহার করে এবং দামের প্রবণতার দিক নির্ধারণ করে। কৌশলটি একই সাথে এটিআর চ্যানেলের সাথে মিলিত হয়, দামের ক্রিয়াকলাপের পরিসীমা সীমাবদ্ধ করে। দাম যখন উচ্চতর হয় তখন বেশি কিছু করবেন না এবং যখন দাম নীচে নেমে আসে তখন খালি করবেন না, উচ্চতা এবং পতন অনুসরণ করা এড়াতে।
যখন কিজুন লাইনটি উপরে উঠে যায় তখন একটি কেনার সংকেত উত্পন্ন হয় এবং যখন এটি নীচে চলে যায় তখন একটি বিক্রয় সংকেত উত্পন্ন হয়। ত্রুটিযুক্ত সংকেতগুলি ফিল্টার করার জন্য, কৌশলটি একাধিক প্রযুক্তিগত সূচকও প্রবর্তন করে যার মধ্যে রয়েছে অ্যারন সূচক, আরএসআই সূচক, এমএসিডি সূচক এবং পিএসএআর সূচক। সমস্ত সূচকের নিশ্চিতকরণের শর্ত পূরণ হলে কেনার এবং বিক্রয় সংকেত উত্পন্ন হয়।
বাজারে প্রবেশের পর, কৌশলটি স্টপ লস এবং স্টপ-অফ পদ্ধতি ব্যবহার করে পজিশন পরিচালনা করে। স্টপ লস পয়েন্টটি 0.5 এটিআর এবং স্টপ-অফ পয়েন্টটি 0.5%। যখন দাম আবার কিজুন লাইন বিপরীত হয়, তখন অবিলম্বে স্টপ লস প্রস্থান নির্বাচন করুন।
কৌশলগত সুবিধা
- কিজুন লাইন ব্যবহার করে ট্রেন্ডের দিকনির্দেশনা জেনে নিন এবং বাজারের ধাক্কা থেকে বাঁচুন
- ATR চ্যানেল মূল্য ক্রিয়াকলাপের পরিসীমা সীমাবদ্ধ করে, ঝুঁকি নিয়ন্ত্রণে উপকারী
- একাধিক প্রযুক্তিগত সূচক নিশ্চিত করেছে, যা ত্রুটিপূর্ণ সংকেতগুলিকে ব্যাপকভাবে ফিল্টার করতে পারে
- স্টপ লস স্টপ রিস্ক ম্যানেজমেন্টের সাথে মিলিত, লাভজনকভাবে মুনাফা লক করা
কৌশলগত ঝুঁকি
- একাধিক সূচক সংকেত বিলম্বিত হওয়ার বিষয়টি নিশ্চিত করেছে, যা প্রবণতার শুরুতে মিস হতে পারে
- স্টপপয়েন্ট খুব ছোট হলে, প্রায়শই স্টপপয়েন্ট করা হয়
- কিজুন লাইন এবং এটিআর প্যারামিটারগুলি অযৌক্তিকভাবে ঘন ঘন ত্রুটিযুক্ত সংকেত হতে পারে
- প্যারামিটার অপ্টিমাইজেশান এবং ঐতিহাসিক ডেটা মিলে যাওয়ার উপর নির্ভর করে, ফিক্সড ডিস্কটি দুর্বল হতে পারে
অপ্টিমাইজেশান দিক
- ইচিমোকু মেঘের মতো আরও উন্নত ট্রেন্ডিং ইন্ডিকেটর ব্যবহার করে দেখুন
- স্টপ লস স্টপ পয়েন্টের সমন্বয়, লভ্যাংশ অনুপাতের অপ্টিমাইজেশন
- বিভিন্ন বাজারের জন্য সর্বোত্তম প্যারামিটার সমন্বয় পরীক্ষা করা
- রিয়েল-টাইম মার্কেটের উপর ভিত্তি করে প্যারামিটারগুলি সামঞ্জস্য করার জন্য একটি স্বয়ংক্রিয় প্যারামিটারিং বৈশিষ্ট্য যুক্ত করা হয়েছে
- বিভিন্ন কনফার্মেশন সূচক সমন্বয় পরীক্ষা করুন
সারসংক্ষেপ
দ্বি-মুখী এটিআর ওয়েভ ট্রেডিং কৌশলটি গড়রেখা, এটিআর চ্যানেল এবং একাধিক সহায়ক প্রযুক্তিগত সূচকগুলির সমন্বিত ব্যবহার করে, প্রবণতা দিকনির্দেশের পরে ট্রেন্ড ট্র্যাকিং অপারেশন করে। একক সূচক কৌশলগুলির তুলনায়, এটি সংকেতের গুণমান এবং মুনাফা অর্জনের সম্ভাবনাকে ব্যাপকভাবে উন্নত করতে পারে।
/*backtest
start: 2023-10-24 00:00:00
end: 2023-10-27 00:00:00
period: 15m
basePeriod: 5m
exchanges: [{"eid":"Futures_Binance","currency":"BTC_USDT"}]
*/

//@version=4
// strategy(title="NoNonsense Forex", overlay=true, default_qty_value=100000, initial_capital=100)

//////////////////////
////// BASELINE //////
//////////////////////
ma_slow_type = input(title="Baseline Type", type=input.string, defval="Kijun", options=["ALMA", "EMA", "DEMA", "TEMA", "WMA", "VWMA", "SMA", "SMMA", "HMA", "LSMA", "Kijun", "McGinley"])
ma_slow_src = close //input(title="MA Source", type=input.source, defval=close)
ma_slow_len = input(title="Baseline Length", type=input.integer, defval=20)
ma_slow_len_fast = input(title="Baseline Length Fast", type=input.integer, defval=12)

lsma_offset  = input(defval=0, title="* Least Squares (LSMA) Only - Offset Value", minval=0)
alma_offset  = input(defval=0.85, title="* Arnaud Legoux (ALMA) Only - Offset Value", minval=0, step=0.01)
alma_sigma   = input(defval=6, title="* Arnaud Legoux (ALMA) Only - Sigma Value", minval=0)

ma(type, src, len) =>
    float result = 0
    if type=="SMA" // Simple
        result := sma(src, len)
    if type=="EMA" // Exponential
        result := ema(src, len)
    if type=="DEMA" // Double Exponential
        e = ema(src, len)
        result := 2 * e - ema(e, len)
    if type=="TEMA" // Triple Exponential
        e = ema(src, len)
        result := 3 * (e - ema(e, len)) + ema(ema(e, len), len)
    if type=="WMA" // Weighted
        result := wma(src, len)
    if type=="VWMA" // Volume Weighted
        result := vwma(src, len)
    if type=="SMMA" // Smoothed
        w = wma(src, len)
        result := na(w[1]) ? sma(src, len) : (w[1] * (len - 1) + src) / len
    if type=="HMA" // Hull
        result := wma(2 * wma(src, len / 2) - wma(src, len), round(sqrt(len)))
    if type=="LSMA" // Least Squares
        result := linreg(src, len, lsma_offset)
    if type=="ALMA" // Arnaud Legoux
        result := alma(src, len, alma_offset, alma_sigma)
    if type=="Kijun" //Kijun-sen
        kijun = avg(lowest(len), highest(len))
        result :=kijun
    if type=="McGinley"
        mg = 0.0
        mg := na(mg[1]) ? ema(src, len) : mg[1] + (src - mg[1]) / (len * pow(src/mg[1], 4))
        result :=mg
    result

baseline = ma(ma_slow_type, ma_slow_src, ma_slow_len)
plot(baseline, title='Baseline', color=rising(baseline,1) ? color.green : falling(baseline,1) ? color.maroon : na, linewidth=3)

//////////////////
////// ATR ///////
//////////////////
atrlength=input(14, title="ATR Length")
one_atr=rma(tr(true), atrlength)
upper_atr_band=baseline+one_atr
lower_atr_band=baseline-one_atr
plot(upper_atr_band, color=color.gray, style=plot.style_areabr, transp=95, histbase=50000, title='ATR Cave')
plot(lower_atr_band, color=color.gray, style=plot.style_areabr, transp=95, histbase=0, title='ATR Cave')
plot(upper_atr_band, color=close>upper_atr_band ? color.fuchsia : na, style=plot.style_line, linewidth=5, transp=50, title='Close above ATR cave')
plot(lower_atr_band, color=close<lower_atr_band ? color.fuchsia : na, style=plot.style_line, linewidth=5, transp=50, title='Close below ATR cave')
donttradeoutside_atrcave=input(true)
too_high = close>upper_atr_band and donttradeoutside_atrcave
too_low = close<lower_atr_band and donttradeoutside_atrcave

////////////////////////////
////// CONFIRMATION 1 ////// the trigger actually
////////////////////////////
lenaroon = input(8, minval=1, title="Length Aroon")
c1upper = 100 * (highestbars(high, lenaroon+1) + lenaroon)/lenaroon
c1lower = 100 * (lowestbars(low, lenaroon+1) + lenaroon)/lenaroon
c1CrossUp=crossover(c1upper,c1lower)
c1CrossDown=crossunder(c1upper,c1lower)


////////////////////////////////
////// CONFIRMATION: MACD //////
////////////////////////////////
dont_use_macd=input(false)
macd_fast_length = input(title="Fast Length", type=input.integer, defval=13)
macd_slow_length = input(title="Slow Length", type=input.integer, defval=26)
macd_signal_length = input(title="Signal Smoothing", type=input.integer, minval = 1, maxval = 50, defval = 9)
macd_fast_ma = ema(close, macd_fast_length)
macd_slow_ma = ema(close, macd_slow_length)
macd = macd_fast_ma - macd_slow_ma
macd_signal = ema(macd, macd_signal_length)
macd_hist = macd - macd_signal

macdLong=macd_hist>0 or dont_use_macd
macdShort=macd_hist<0 or dont_use_macd

/////////////////////////////
///// CONFIRMATION: RSI /////
/////////////////////////////
dont_use_rsi=input(false)
lenrsi = input(14, minval=1, title="RSI Length") //14
up = rma(max(change(close), 0), lenrsi)
down = rma(-min(change(close), 0), lenrsi)
rsi = down == 0 ? 100 : up == 0 ? 0 : 100 - (100 / (1 + up / down))
rsiLong=rsi>50 or dont_use_rsi
rsiShort=rsi<50 or dont_use_rsi

//////////////////////////////
///// CONFIRMATION: PSAR /////
//////////////////////////////
dont_use_psar=input(false)
psar_start = input(0.03, step=0.01)
psar_increment = input(0.018, step=0.001)
psar_maximum = input(0.11, step=0.01) //default 0.08
psar = sar(psar_start, psar_increment, psar_maximum)

plot(psar, style=plot.style_cross, color=color.blue, title='PSAR')
psarLong=close>psar or dont_use_psar
psarShort=close<psar or dont_use_psar

/////////////////////////
///// CONFIRMATIONS /////
/////////////////////////
Long_Confirmations=psarLong and rsiLong and macdLong
Short_Confirmations=psarShort and rsiShort and macdShort

GoLong=c1CrossUp and Long_Confirmations and not too_high
GoShort=c1CrossDown and Short_Confirmations and not too_low

////////////////////
///// STRATEGY /////
////////////////////

use_exit=input(false)
KillLong=c1CrossDown and use_exit
KillShort=c1CrossUp and use_exit

SL=input(0.5, step=0.1)/syminfo.mintick
TP=input(0.005, step=0.001)/syminfo.mintick

strategy.entry("nnL", strategy.long, when = GoLong)
strategy.entry("nnS", strategy.short, when = GoShort)
strategy.exit("XL-nn", from_entry = "nnL", loss = SL, profit=TP)
strategy.exit("XS-nn", from_entry = "nnS", loss = SL, profit=TP)
strategy.close("nnL", when = KillLong)
strategy.close("nnS", when = KillShort)