Beste TradingView-Strategie
Schriftsteller:ChaoZhang, Datum: 2022-05-09 21:08:17Tags:RSI- Nein.
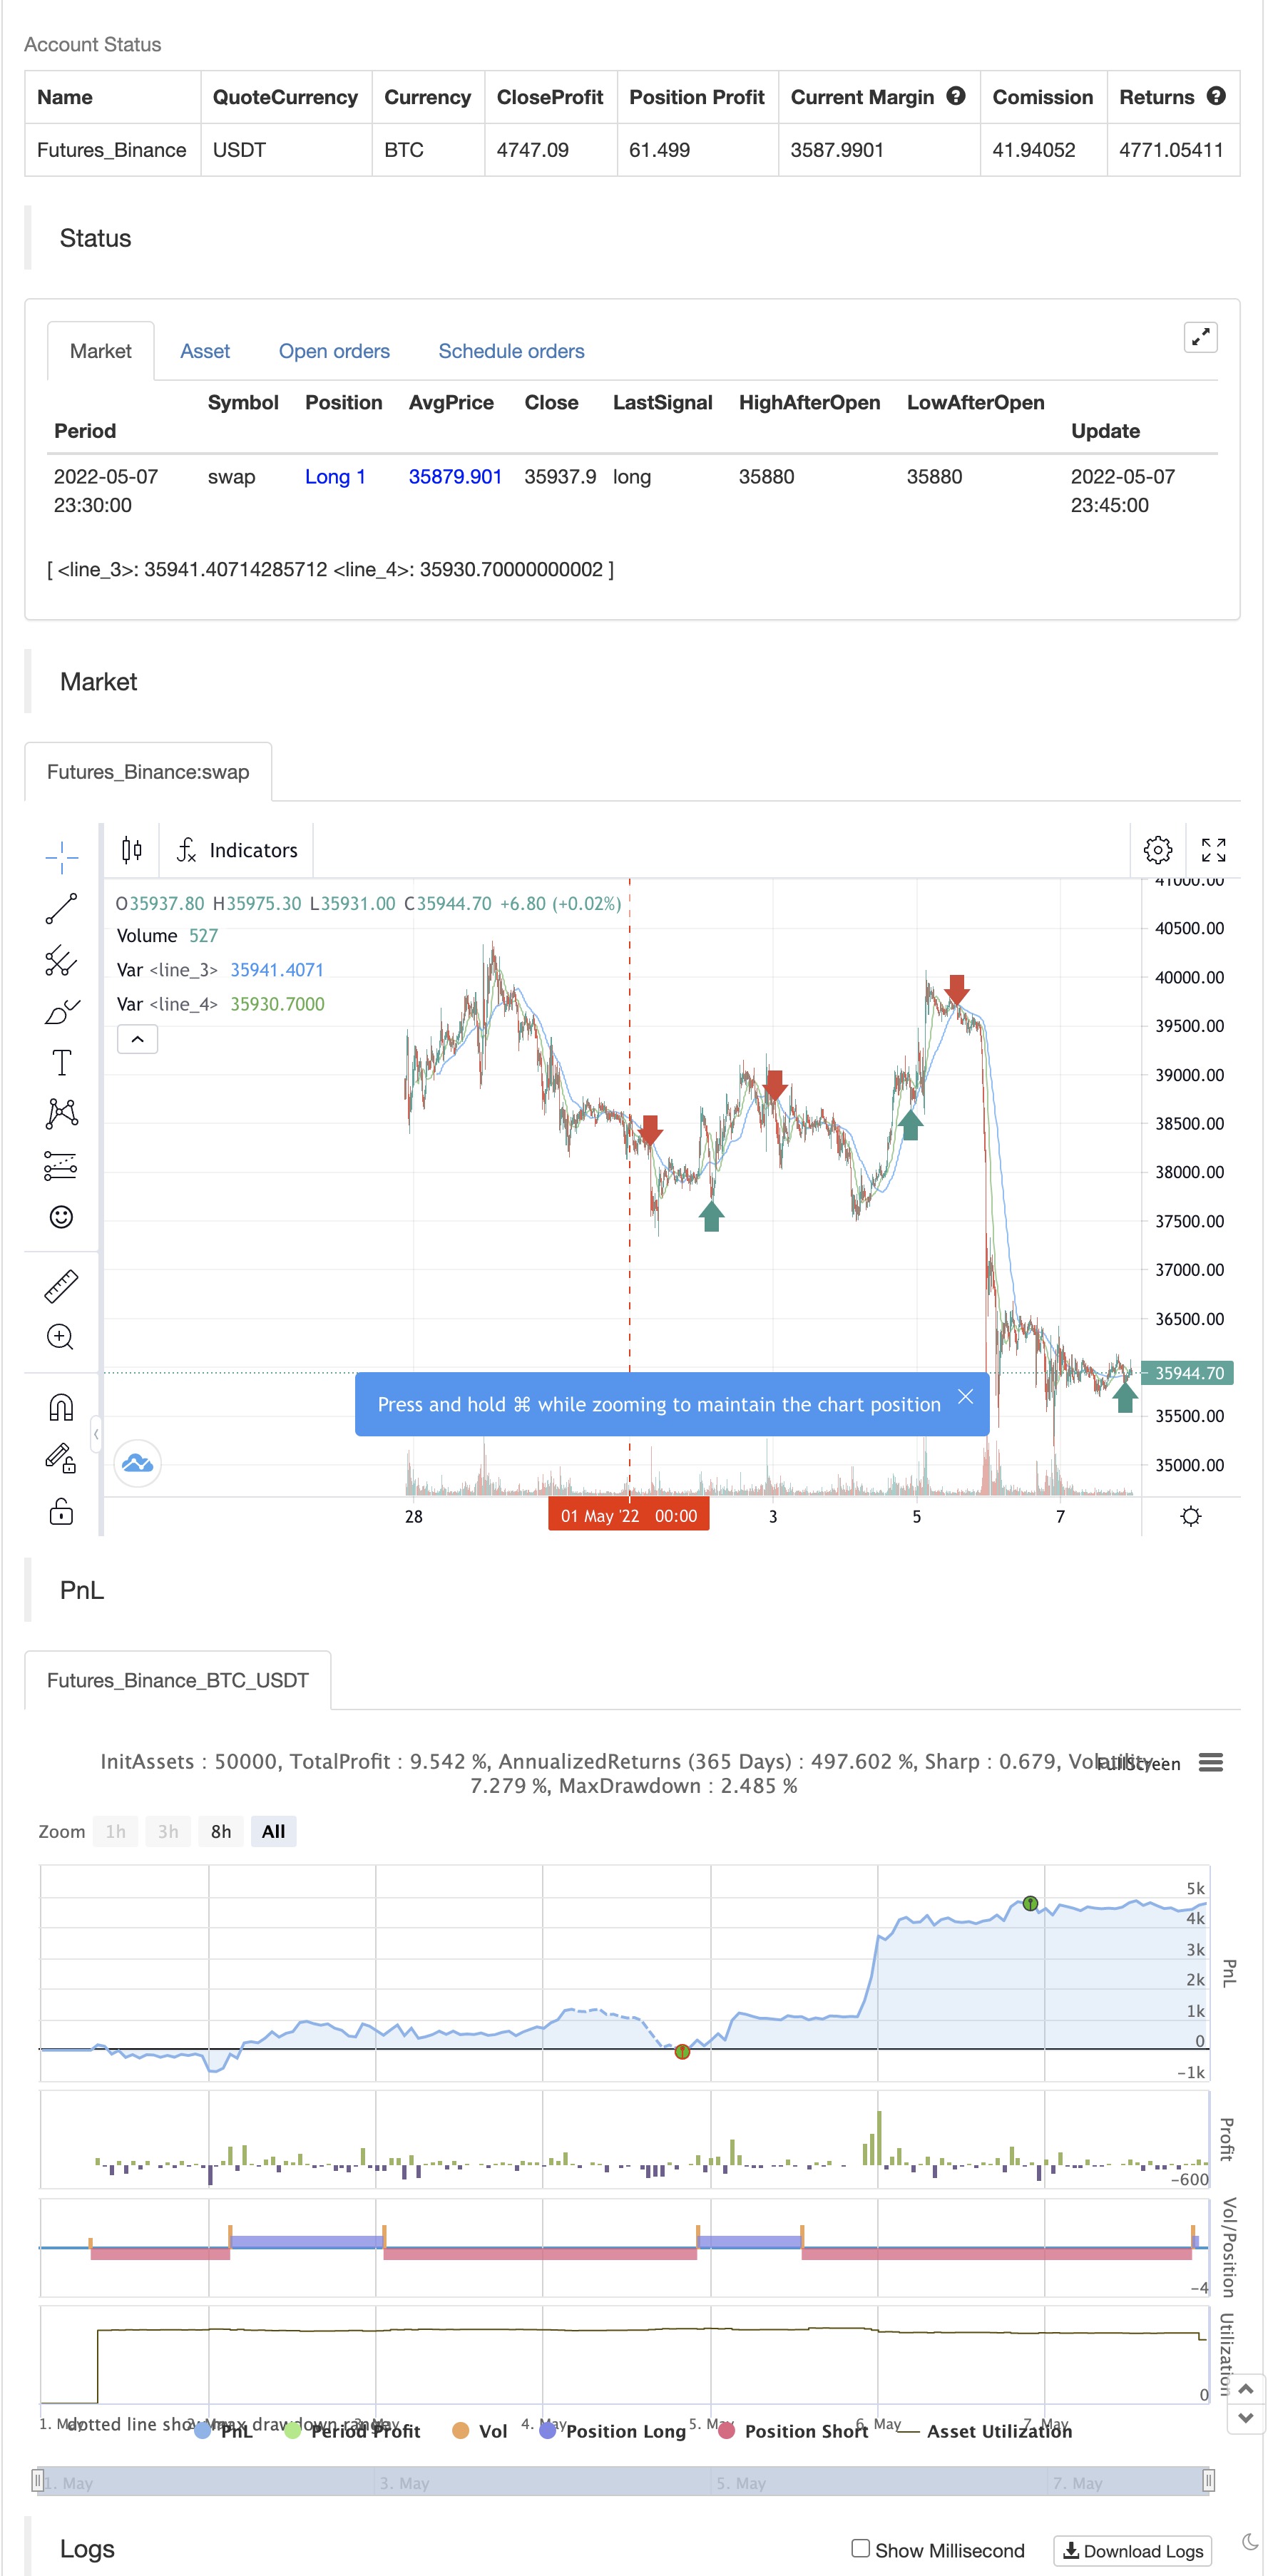
Das Drehbuch basiert vollständig auf Dynamik, Volumen und Preis. 1: Bollinger Band drückt, um zu wissen, wann ein Ausbruch passieren könnte. 2: Um die Richtung zu ermitteln, werden gleitende Durchschnitte (SMA und EMA) verwendet. 3: Die Erfolgsquote dieser Strategie liegt bei über 75% und kann, wenn wenig Preisaktion hinzugefügt wird, leicht die Erfolgsquote von 90% überschreiten. 4: Sorgen Sie sich nicht um Rückzüge, wir haben trailing SL implementiert, so dass Sie vielleicht ein wenig mehr Rückzug sehen, aber in Wirklichkeit ist es ziemlich weniger. 5. Ich selbst habe diese Strategie 41 Tage lang mit einem Konto von 250$ getestet und habe jetzt 2700$.
Zurückprüfung

/*backtest
start: 2022-05-01 00:00:00
end: 2022-05-07 23:59:00
period: 15m
basePeriod: 5m
exchanges: [{"eid":"Bitfinex","currency":"BTC_USD"}]
*/

// This source code is subject to the terms of the Mozilla Public License 2.0 at https://mozilla.org/MPL/2.0/
// © The_Bigger_Bull
//@version=5
strategy("Best TradingView Strategy", overlay=true, margin_long=0, margin_short=0)
//Bollinger Bands
source1 = close
length1 = input.int(15, minval=1)
mult1 = input.float(2.0, minval=0.001, maxval=50)
basis1 = ta.sma(source1, length1)
dev1 = mult1 * ta.stdev(source1, length1)
upper1 = basis1 + dev1
lower1 = basis1 - dev1
//buyEntry = ta.crossover(source1, lower1)
//sellEntry = ta.crossunder(source1, upper1)

//RSI
ma(source, length, type) =>
    switch type
        "SMA" => ta.sma(source, length)
        "Bollinger Bands" => ta.sma(source, length)
        "EMA" => ta.ema(source, length)
        "SMMA (RMA)" => ta.rma(source, length)
        "WMA" => ta.wma(source, length)
        "VWMA" => ta.vwma(source, length)

rsiLengthInput = input.int(14, minval=1, title="RSI Length", group="RSI Settings")
rsiSourceInput = input.source(close, "Source", group="RSI Settings")
maTypeInput = input.string("SMA", title="MA Type", options=["SMA", "Bollinger Bands", "EMA", "SMMA (RMA)", "WMA", "VWMA"], group="MA Settings")
maLengthInput = input.int(14, title="MA Length", group="MA Settings")
bbMultInput = input.float(2.0, minval=0.001, maxval=50, title="BB StdDev", group="MA Settings")

up = ta.rma(math.max(ta.change(rsiSourceInput), 0), rsiLengthInput)
down = ta.rma(-math.min(ta.change(rsiSourceInput), 0), rsiLengthInput)
rsi = down == 0 ? 100 : up == 0 ? 0 : 100 - (100 / (1 + up / down))
rsiMA = ma(rsi, maLengthInput, maTypeInput)
isBB = maTypeInput == "Bollinger Bands"

//plot(rsi, "RSI", color=#7E57C2)
//plot(rsiMA, "RSI-based MA", color=color.yellow)
rsiUpperBand = hline(70, "RSI Upper Band", color=#787B86)
hline(50, "RSI Middle Band", color=color.new(#787B86, 50))
rsiLowerBand = hline(30, "RSI Lower Band", color=#787B86)
//fill(rsiUpperBand, rsiLowerBand, color=color.rgb(126, 87, 194, 90), title="RSI Background Fill")
bbUpperBand = plot(isBB ? rsiMA + ta.stdev(rsi, maLengthInput) * bbMultInput : na, title = "Upper Bollinger Band", color=color.green)
bbLowerBand = plot(isBB ? rsiMA - ta.stdev(rsi, maLengthInput) * bbMultInput : na, title = "Lower Bollinger Band", color=color.green)
//fill(bbUpperBand, bbLowerBand, color= isBB ? color.new(color.green, 90) : na, title="Bollinger Bands Background Fill")

//ADX

adxlen = input(14, title="ADX Smoothing")
dilen = input(14, title="DI Length")
dirmov(len) =>
	up1 = ta.change(high)
	down1 = -ta.change(low)
	plusDM = na(up1) ? na : (up1 > down1 and up1 > 0 ? up1 : 0)
	minusDM = na(down1) ? na : (down1 > up1 and down1 > 0 ? down1 : 0)
	truerange = ta.rma(ta.tr, len)
	plus = fixnan(100 * ta.rma(plusDM, len) / truerange)
	minus = fixnan(100 * ta.rma(minusDM, len) / truerange)
	[plus, minus]
adx(dilen, adxlen) =>
	[plus, minus] = dirmov(dilen)
	sum = plus + minus
	adx = 100 * ta.rma(math.abs(plus - minus) / (sum == 0 ? 1 : sum), adxlen)
sig = adx(dilen, adxlen)


out = ta.sma(close, 14)

sma1=ta.sma(close,42)

ema200=ta.ema(close,200)


longCondition = (out>sma1) and ta.crossover(source1, lower1)

if (longCondition )
    strategy.entry("long", strategy.long)

shortCondition = (out<sma1) and ta.crossunder(source1, lower1)

if (shortCondition )
    strategy.entry("short", strategy.short)


stopl=strategy.position_avg_price-50
tptgt=strategy.position_avg_price+100
stopshort=strategy.position_avg_price+50
tptgtshort=strategy.position_avg_price-100

strategy.exit("longclose","long",trail_offset=50,trail_points=100,when=ta.crossover(sma1,out))
strategy.exit("shortclose","short",trail_offset=50,trail_points=100,when=ta.crossover(out,sma1))


//if strategy.position_avg_price<0


plot(sma1 , color=color.blue)
plot(out, color=color.green)
//plot(ema200,color=color.red)
Verwandt
- Mehrfachbestätigung Umkehrung Kaufstrategie
- Die RSI-Dynamik ist eine dynamische Anziehungs-Stop-Loss-Strategie.
- Erweiterte dynamische Fibonacci-Retracement-Trend-Quantitative Handelsstrategie
- Bei der Berechnung der Vermögenswerte für die Berechnung der Vermögenswerte für die Berechnung der Vermögenswerte für die Berechnung der Vermögenswerte für die Berechnung der Vermögenswerte für die Berechnung der Vermögenswerte für die Berechnung der Vermögenswerte für die Berechnung der Vermögenswerte
- Dynamische RSI-Überverkauft-Rebound-Handelsstrategie mit Stop-Loss-Optimierungsmodell
- Kurzfristige Handelsstrategie auf Basis von Bollinger-Bändern, gleitenden Durchschnitten und RSI
- Strategie zur Umstellung am Dienstag (Wochenendfilter)
- Strategie für die Dynamik des doppelten gleitenden Durchschnitts des RSI auf Basis von EMA und Trendline-Breakouts
- RSI-ATR-Momentums-Volatilität Kombinierte Handelsstrategie
- Mehrzeitägige gleitende Durchschnitts- und RSI-Momentums-Kreuzstrategie
Mehr
- Nik Stoch
- Stoch supertrd ATR 200mA
- MTF-RSI und STOCH-Strategie
- EMA + AROON + ASH
- Momentum 2.0
- EHMA-Bereichsstrategie
- Beweglicher durchschnittlicher Kauf-Verkauf
- Midas Mk. II - Der ultimative Krypto-Swing
- TMA-Legacy
- TV-Hoch-Niedrig-Strategien
- Der Wert des Wertpapiers ist der Wert des Wertpapiers, der für den Wertpapiermarkt verwendet wird.
- Chande Kroll Stopp
- CCI + EMA mit RSI-Kreuzstrategie
- EMA-Bänder + leledc + Bollinger-Bänder Trend-Catching-Strategie
- RSI MTF Ob+Os
- MACD-Willystrategie
- RSI - Kauf-Verkaufssignale
- Heikin-Aschi-Trend
- HA Marktverzerrung
- Ichimoku Wolken glatter Oszillator