概述
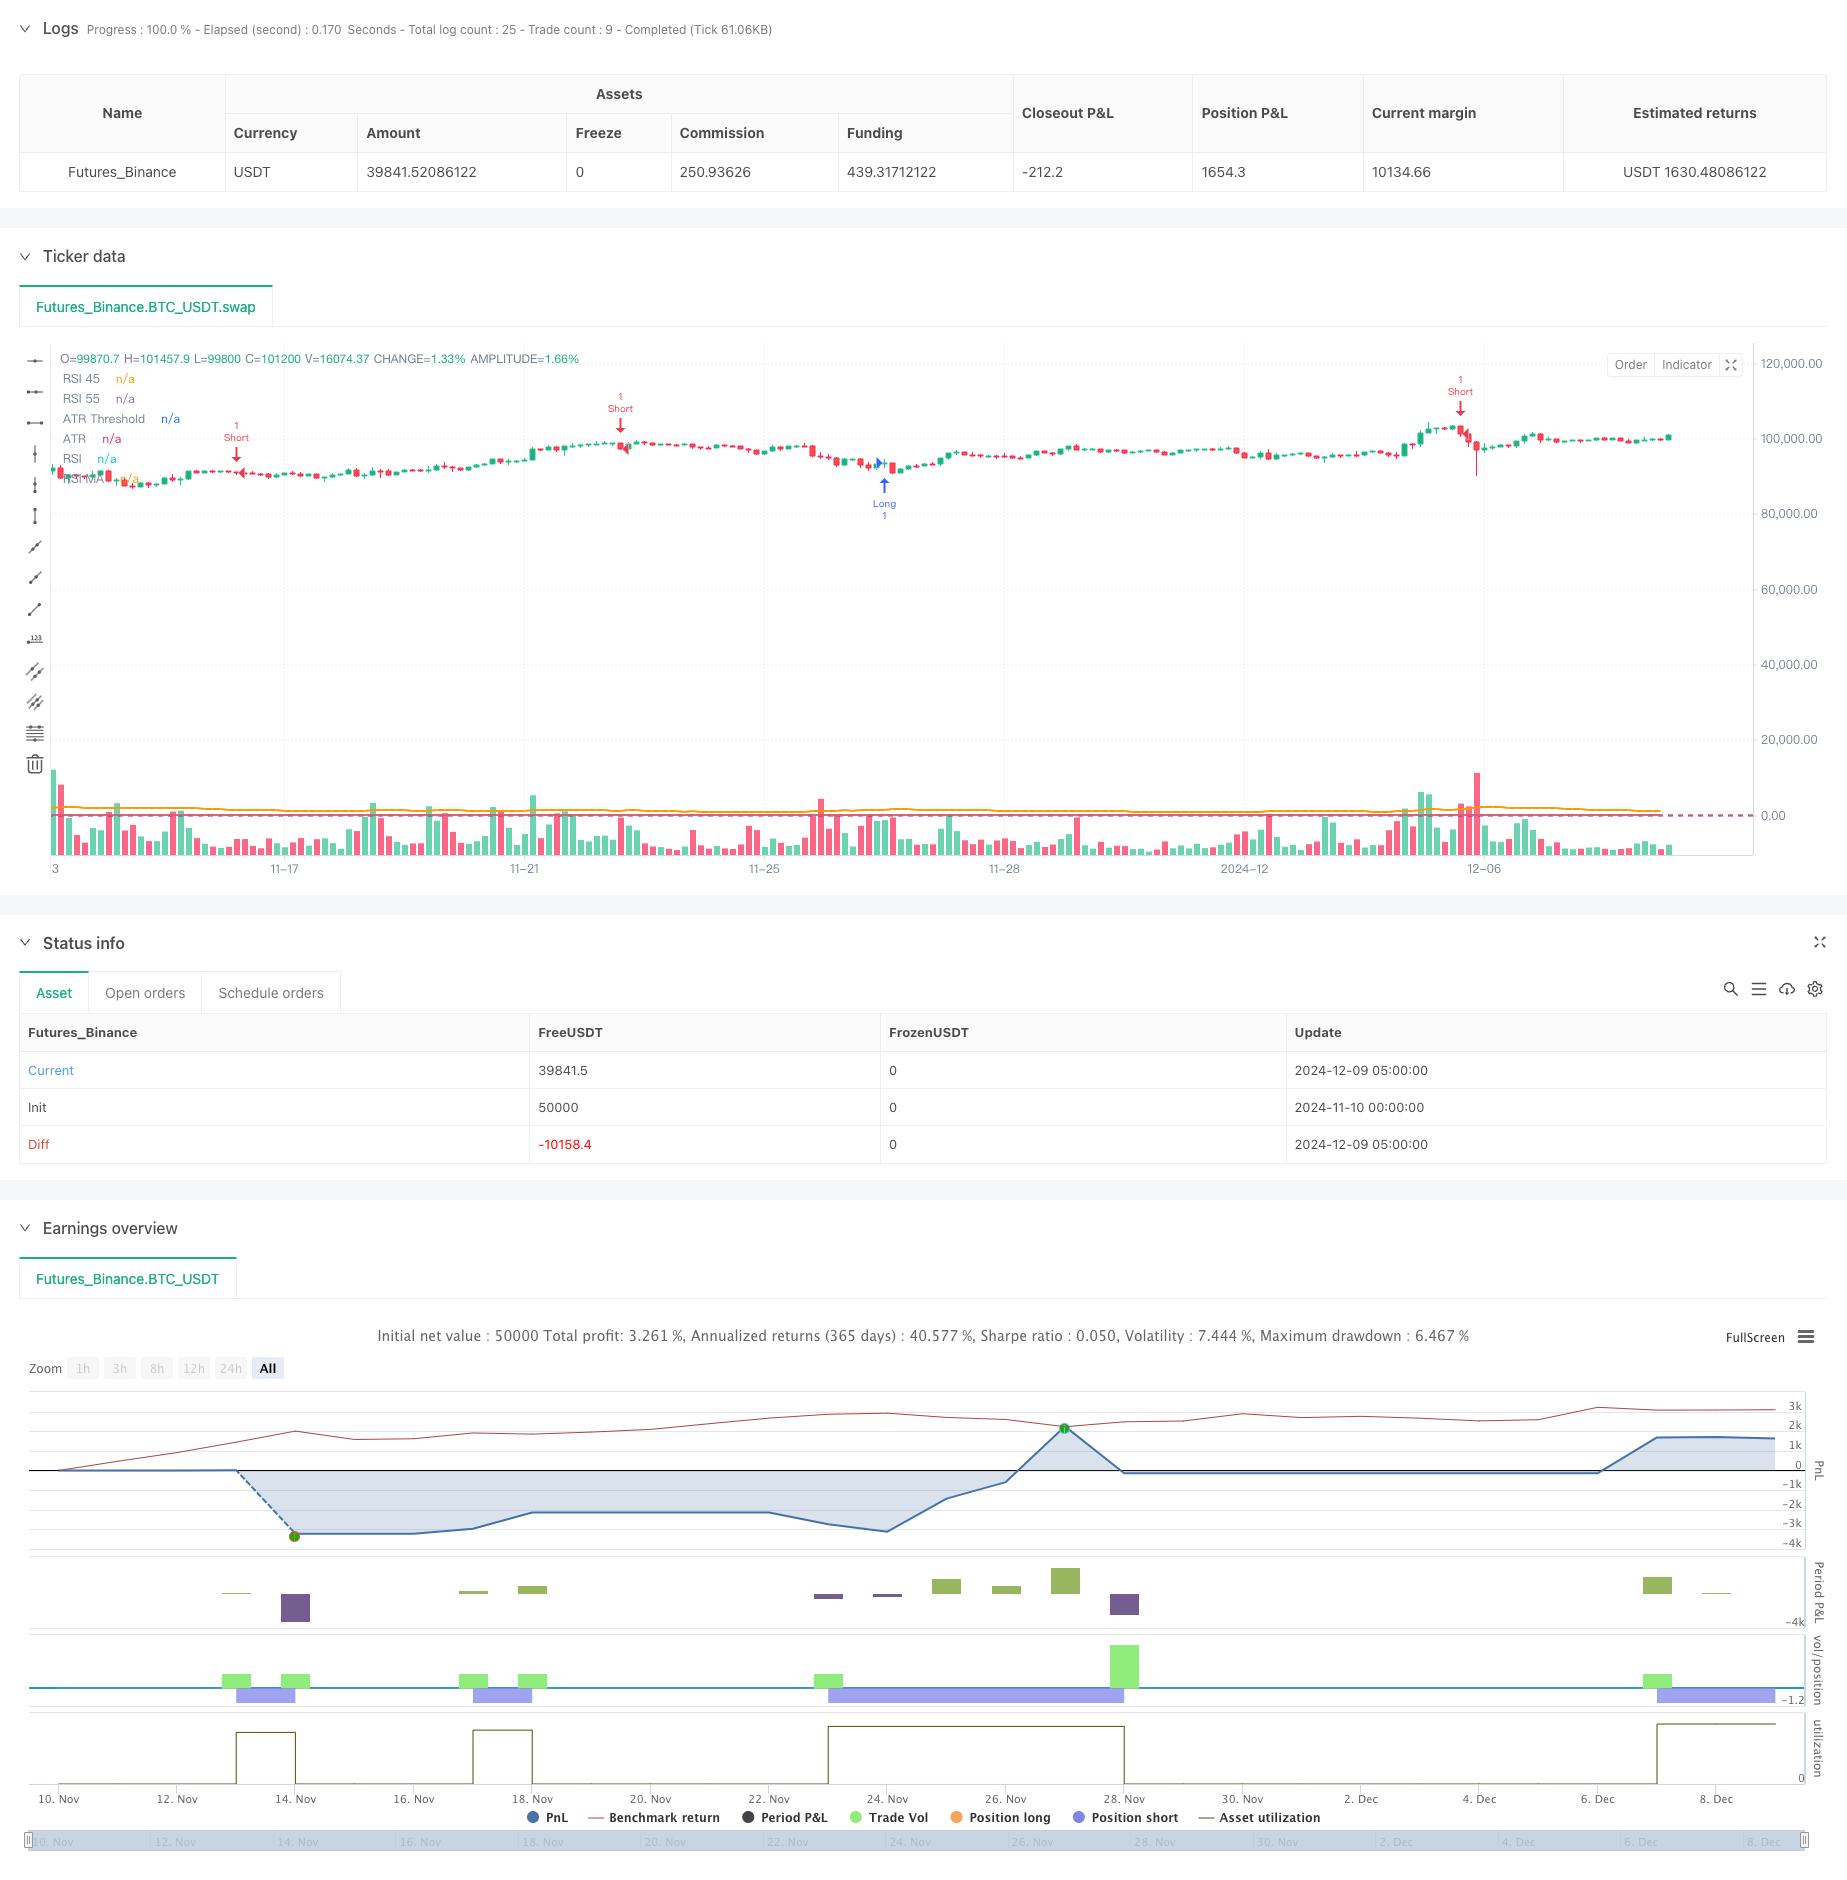
这是一个结合RSI动量指标和ATR波动指标的交易策略系统。该策略通过监控RSI与其移动平均线的交叉情况来识别潜在的交易机会,同时利用ATR指标作为波动率过滤器来确保市场具有足够的波动性。策略在欧洲交易时段(布拉格时间8:00-21:00)运行,采用5分钟时间周期,并设置了固定的止盈止损水平。
策略原理
策略的核心逻辑基于以下几个关键组件: 1. RSI指标用于识别超买超卖区域,当RSI低于45视为超卖区域,高于55视为超买区域 2. RSI与其移动平均线的交叉作为入场信号触发条件 3. ATR指标用于过滤低波动率环境,只有当ATR高于设定阈值时才允许交易 4. 交易时间限制在布拉格时间8:00-21:00之间 5. 采用固定止盈止损策略,默认设置为5000个点
具体的交易规则如下: - 做多条件:RSI在45以下与其移动平均线向上交叉,且满足交易时间和波动率条件 - 做空条件:RSI在55以上与其移动平均线向下交叉,且满足交易时间和波动率条件 - 出场条件:触及止盈位或止损位自动平仓
策略优势
- 多重过滤机制:结合了动量指标(RSI)和波动率指标(ATR),能有效降低虚假信号
- 时间过滤:通过限定交易时间窗口,避免了低流动性时段的干扰
- 风险管理完善:设置了固定的止盈止损,便于资金管理
- 参数可调:关键参数如RSI长度、ATR阈值等都可根据不同市场情况进行优化
- 回测结果稳健:在考虑滑点和佣金的情况下,胜率达到64.4%,盈亏比为1.1
策略风险
- 固定止盈止损可能不适合所有市场环境,在剧烈波动时期可能导致过早出场
- RSI指标在趋势市场中可能产生频繁的虚假信号
- ATR过滤可能使策略错过一些重要的市场机会
- 时间窗口限制可能导致错过其他时段的优质交易机会
- 策略依赖参数优化,过度优化可能导致过拟合风险
策略优化方向
- 动态止盈止损:可以考虑根据ATR动态调整止盈止损幅度,使其更适应市场波动
- 趋势过滤:增加趋势判断指标,如移动平均线系统,以降低震荡市场中的虚假信号
- 改进入场时机:可以考虑添加成交量指标作为辅助确认,提高入场质量
- 优化时间窗口:根据不同市场的特点,调整交易时间窗口,以捕捉更多机会
- 增加资金管理模块:实现动态持仓规模管理,更好地控制风险
总结
该策略通过结合RSI和ATR指标,构建了一个相对完整的交易系统。策略的主要优势在于多重过滤机制和完善的风险管理,但同时也存在一些局限性。通过提出的优化方向,策略有望获得更好的表现。关键是要根据实际交易环境不断调整和优化参数,保持策略的适应性。
策略源码
/*backtest
start: 2024-11-10 00:00:00
end: 2024-12-09 08:00:00
period: 3h
basePeriod: 3h
exchanges: [{"eid":"Futures_Binance","currency":"BTC_USDT"}]
*/

//@version=5
strategy("Custom RSI + ATR Strategy", overlay=true)

// === Настройки индикаторов ===
rsi_length = input.int(14, minval=1, title="RSI Length")
rsi_ma_length = input.int(10, minval=1, title="RSI MA Length")
atr_length = input.int(14, minval=1, title="ATR Length")
atr_threshold = input.float(0.5, minval=0.1, title="ATR Threshold")

// === Параметры стоп-лосса и тейк-профита ===
stop_loss_ticks = input.int(5000, title="Stop Loss Ticks")
take_profit_ticks = input.int(5000, title="Take Profit Ticks")

// === Получение значений индикаторов ===
rsi = ta.rsi(close, rsi_length)
rsi_ma = ta.sma(rsi, rsi_ma_length)
atr_value = ta.atr(atr_length)

// === Время для открытия сделок ===
start_time = timestamp("Europe/Prague", year, month, dayofmonth, 8, 0)
end_time = timestamp("Europe/Prague", year, month, dayofmonth, 21, 0)
in_trading_hours = (time >= start_time and time <= end_time)

// === Условие по волатильности ===
volatility_filter = atr_value > atr_threshold

// === Условия для лонгов ===
long_condition = ta.crossover(rsi, rsi_ma) and rsi < 45 and in_trading_hours and volatility_filter
if (long_condition)
    strategy.entry("Long", strategy.long)
    strategy.exit("Take Profit/Stop Loss", "Long", stop=low - stop_loss_ticks * syminfo.mintick, limit=high + take_profit_ticks * syminfo.mintick)

// === Условия для шортов ===
short_condition = ta.crossunder(rsi, rsi_ma) and rsi > 55 and in_trading_hours and volatility_filter
if (short_condition)
    strategy.entry("Short", strategy.short)
    strategy.exit("Take Profit/Stop Loss", "Short", stop=high + stop_loss_ticks * syminfo.mintick, limit=low - take_profit_ticks * syminfo.mintick)

// === Отображение индикаторов на графике ===
plot(rsi, color=color.blue, title="RSI")
plot(rsi_ma, color=color.red, title="RSI MA")
hline(45, "RSI 45", color=color.green)
hline(55, "RSI 55", color=color.red)
plot(atr_value, color=color.orange, title="ATR", linewidth=2)
hline(atr_threshold, "ATR Threshold", color=color.purple)
相关推荐