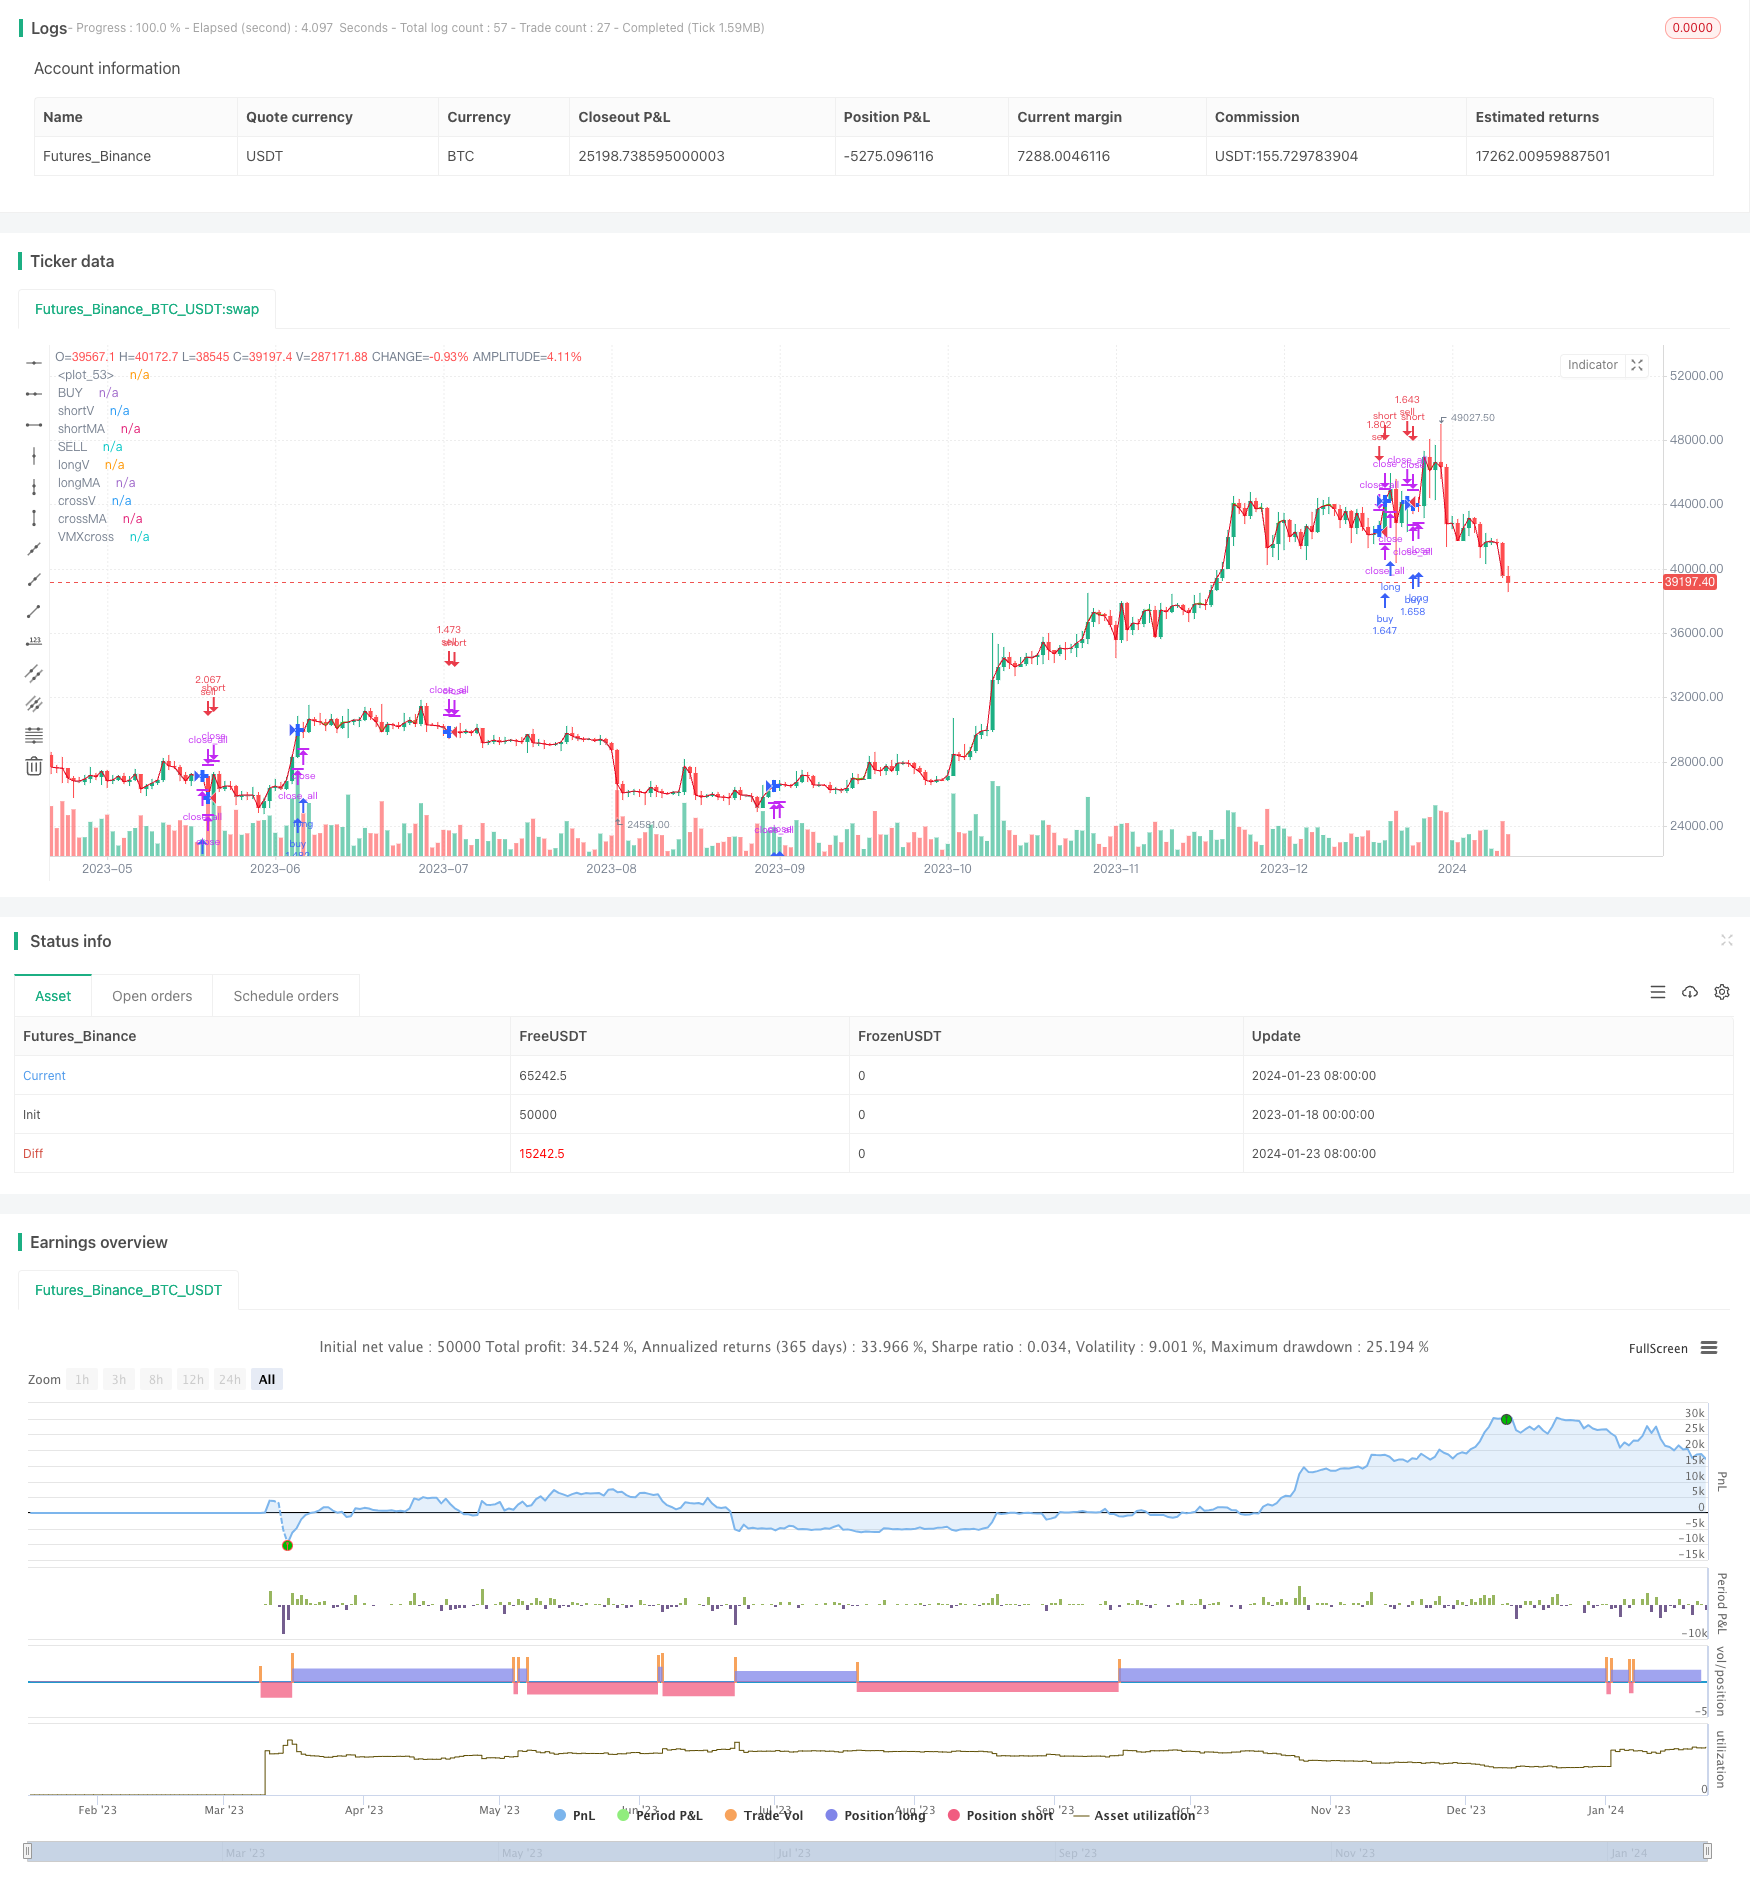
Dual Exponential Moving Average Crossover Algorithmische Handelsstrategie
Schriftsteller:ChaoZhang, Datum: 2024-01-25 14:04:23Tags:

Übersicht
Die Strategie trägt den Namen
Strategie Logik
Darüber hinaus wird der Vortex-Indikator verwendet, um den Trend zu identifizieren und Handelssignale zu generieren. Der Vortex-Indikator bestimmt die bullische oder bärische Dynamik, indem er die Differenz zwischen dem höchsten Preis und dem gestern geschlossenen und dem niedrigsten Preis und dem gestern geöffneten Preis über einen Zeitraum von 1 Tag und 3 Tagen vergleicht.
Wenn ein Handelssignal generiert wird, hilft das integrierte Geldmanagement-Modul bei der Risikomanagement, indem die Positionsgröße basierend auf vordefinierten Gewinn-Verlust-Verhältnissen gesteuert wird.
Analyse der Vorteile
-
Die Strategie integriert doppelte EMA-Crossovers und den Vortex-Indikator, um beides zu nutzen und somit die Signalgenauigkeit zu verbessern
-
Das automatisierte Handelssystem beseitigt emotionale menschliche Fehler und minimiert Risiken
-
Die automatische Stop-Loss-/Take-Profit-Funktionen begrenzen den maximalen Verlust für jeden Trade
-
Das Geldmanagementmodul steuert die Kapitalzuweisung für jeden Handel und verwaltet somit die Gesamtrisiken
Risikoanalyse
-
Schwarze Schwäne können zu großen Verlusten bei offenen Positionen führen.
-
Die Strategie beruht auf Stop-Losses, um Drawdowns zu kontrollieren. Wenn sie gestoppt wird, können Verluste die Erwartungen übersteigen.
Verbesserungsmöglichkeiten:
-
Die EMA-Parameter können weiter optimiert werden, um die Signalqualität zu verbessern
-
Mehr Indikatoren können zu besseren Filtersignalen hinzugefügt werden
-
Algorithmen für maschinelles Lernen können helfen, Parameter automatisch zu optimieren
Schlussfolgerung
Insgesamt handelt es sich um eine typische doppelte EMA-Crossover-Strategie für den mittelfristigen Handel. Sie identifiziert Handelschancen aus EMA-Crossovers. Der größte Vorteil liegt in der Verwendung von Indikatoren wie Vortex, um Signale zu filtern, die automatisierte Strategie zuverlässig auszuführen, sowie die eingebetteten Stop-Loss/Take-Profit-Funktionen, um Risiken zu mindern.
/*backtest
start: 2023-01-18 00:00:00
end: 2024-01-24 00:00:00
period: 1d
basePeriod: 1h
exchanges: [{"eid":"Futures_Binance","currency":"BTC_USDT"}]
*/

// This source code is subject to the terms of the Mozilla Public License 2.0 at https://mozilla.org/MPL/2.0/
// © smottybugger

//@version= 5
strategy("The  Averages Moving_X_Vortex", shorttitle="2.5billion BTC lol" , calc_on_order_fills=true, calc_on_every_tick=true, commission_type=strategy.commission.percent, commission_value=0.02, default_qty_type=strategy.percent_of_equity, default_qty_value=100, initial_capital=100, margin_long=0, margin_short=0,overlay=true)
// Dual Vortex
period_1 = input(15, "short Time")
period_2 = input(25, "long time")
VMP = math.sum(math.abs(high - low[3]), period_1)
VMM = math.sum(math.abs(low - high[1]), period_2)
STR = math.sum(ta.atr(1), period_1)
STR2 = math.sum(ta.atr(1), period_2)
VXpower= (input(5,"Vortex Power")/10000)*close
shorterV =(VMP / STR)*VXpower
longerV = (VMM / STR2)*VXpower

// MACross
shortlen = input(20, "ShortMa")
longlen = input(29, "LongMA")
shorterMA = ta.sma(close, shortlen)
longerMA = ta.sma(close, longlen)

// Vortex "MACross Stabilized"
Varance = input(1, "Vortex Stabilize")
Vpercent = (Varance / 100)
shortV= ((((shorterMA-close)* Vpercent)+shorterV)/2)+close
longV = ((((longerMA -close )*Vpercent)+longerV)/2)+close

//MAcross vortex stabilized
Marance = input(1, "MACross Stabilize")
MApercent = Marance / 100
shortMA = ((((shorterMA-close)*MApercent)+shorterV)/2)+close
longMA = ((((longerMA-close)*MApercent)+longerV)/2)+close

//VMXadveraged Moving cross adveraged
VMXL=(longV+longMA)/2
VMXS=(shortV+shortMA)/2
VXcross= ta.cross(VMXS,VMXL) ? VMXS : na
VMXcross= ta.cross(VMXS,VMXL)

//plot
plot(VMXS,"BUY",color=#42D420)
plot(VMXL,"SELL",color=#e20420)
crossV= ta.cross(shortV, longV) ? shortV : na
plot(shortV ,"shortV", color=#42D420)
plot(longV,"longV", color=#e20420)
plot(crossV,"crossV", color=#2962FF, style=plot.style_cross, linewidth=4)
crossMA = ta.cross(shortMA, longMA) ? shortMA : na
plot(shortMA,"shortMA", color=#42D420)
plot(longMA,"longMA", color=#e20420)
plot(crossMA,"crossMA", color=#2962FF, style=plot.style_cross, linewidth=4)
plot(VXcross,"VMXcross",color=#2962FF, style= plot.style_cross,linewidth=4)
plot(close,color=#999999)

// Vortex Condistyle
is_Vlong =shortV< longV
is_Vshort =shortV>longV


// Vortex commands
Vlong =  ta.crossunder(longV, shortV)
Vshort =ta.crossover(shortV,longV)
VorteX = ta.cross(longV, shortV)

// MACross Conditions
is_MAlong = shortMA < longV
is_MAshort = shortMA > shortV


//VMX Conditions
is_VMXlong=VMXS<VMXL
is_VMXshort=VMXS>VMXL

// MA commands
MAlong = ta.crossunder(shortMA, longV)
MAshort =ta.crossover(shortMA, shortV)
MAcross =  ta.cross(shortMA, longMA)

//VMX COMMANss
VMXBUY=ta.crossover( VMXS,VMXL)
VMXSELL=ta.crossunder(VMXS,VMXL)

// Close Crossing PositionLMXs

CS=is_MAshort or is_VMXshort
CL= is_MAlong or is_VMXlong
OS=MAshort or VMXSELL
OL=MAlong or VMXBUY


if VMXcross
    strategy.close_all ("closed")

//if CS and  OL
    strategy.close("Short",comment="Short Closed")


//if CL and  OS
    strategy.close("Long",comment="Long Closed" )

//CA1= is_MAcross and is_VorteX
//if CA1
   // strategy.close_all(comment="X2X")

// Defalongyntry qty

if is_VMXlong and VMXSELL
    strategy.entry("sell",strategy.short)


if is_VMXshort and VMXBUY
    strategy.entry("buy",strategy.long)


// Stop Losses & Taking Profit
sllp = input(0, "Stop Loss Long")
sll = (1 - sllp / 100) * strategy.position_avg_price
is_sll = input(true, "Stop Long")

tplp = input(0, "Take Profit Long")
tpl = (1 + tplp / 100) * strategy.position_avg_price
is_tpl = input(true, "Take Long")

slsp = input(0, "Stop Loss Short")
sls = (1 + slsp / 100) * strategy.position_avg_price
is_sls = input(true, "Stop Short")

tpsp = input(0, "Take Profit Short")
tps = (1 - tpsp / 100) * strategy.position_avg_price
is_tps = input(true, "Take Short")

if (is_sll or is_sls)
    strategy.close("Stop Losses", qty_percent=100)

if (is_tpl or is_tps)
    strategy.close("Take Profits", qty_percent=100)


 //Strategy Backtest
//plot(strategy.equity, "Equity", color=color.red, linewidth=2, style=plot.style_areabr)
- MT-Koordinierungshandelsstrategie
- Kombinationsstrategie der Umkehrung der doppelten Faktoren und Verbesserung der Preisvolumenentwicklung
- Trendwinkel bewegliche Durchschnitts-Kreuzung
- Diese Strategie trifft Handelsentscheidungen basierend auf dem Trend des MACD Histogramms
- Momentum-Oszillator & 123 Musterstrategie
- Backteststrategie auf Basis des Fisher-Transformationsindikators
- Schwankungsspektrum gleitender Durchschnittshandelsstrategie
- Umkehrhandelsstrategie auf der Grundlage eines gleitenden Durchschnittsbereichs
- Kalman-Filter-basierte Trendverfolgungsstrategie
- Saisonumkehrung zwischenzeitliche Handelsstrategie
- Quantitative Handelsstrategie mit mehreren Faktoren
- Verzögerung der Handelsstrategie für die Nachverfolgung von Span 2-Linien
- Adaptiver Volatilitätsbruch
- Strategie zur Dynamikfindung
- Strategie zur Umkehrung der Piercing Pin Bar
- Nifty-Handelsstrategie auf Basis des RSI-Indikators
- RSI- und EMA-basierte Trendstrategie
- Trendbestätigungs-Verfolgungsstrategie