资源加载中... loading...

Lagging Span 2 Line Tracking Trading Strategy

Author: ChaoZhang, Date: 2024-01-25 13:00:51
Tags:

img

Overview

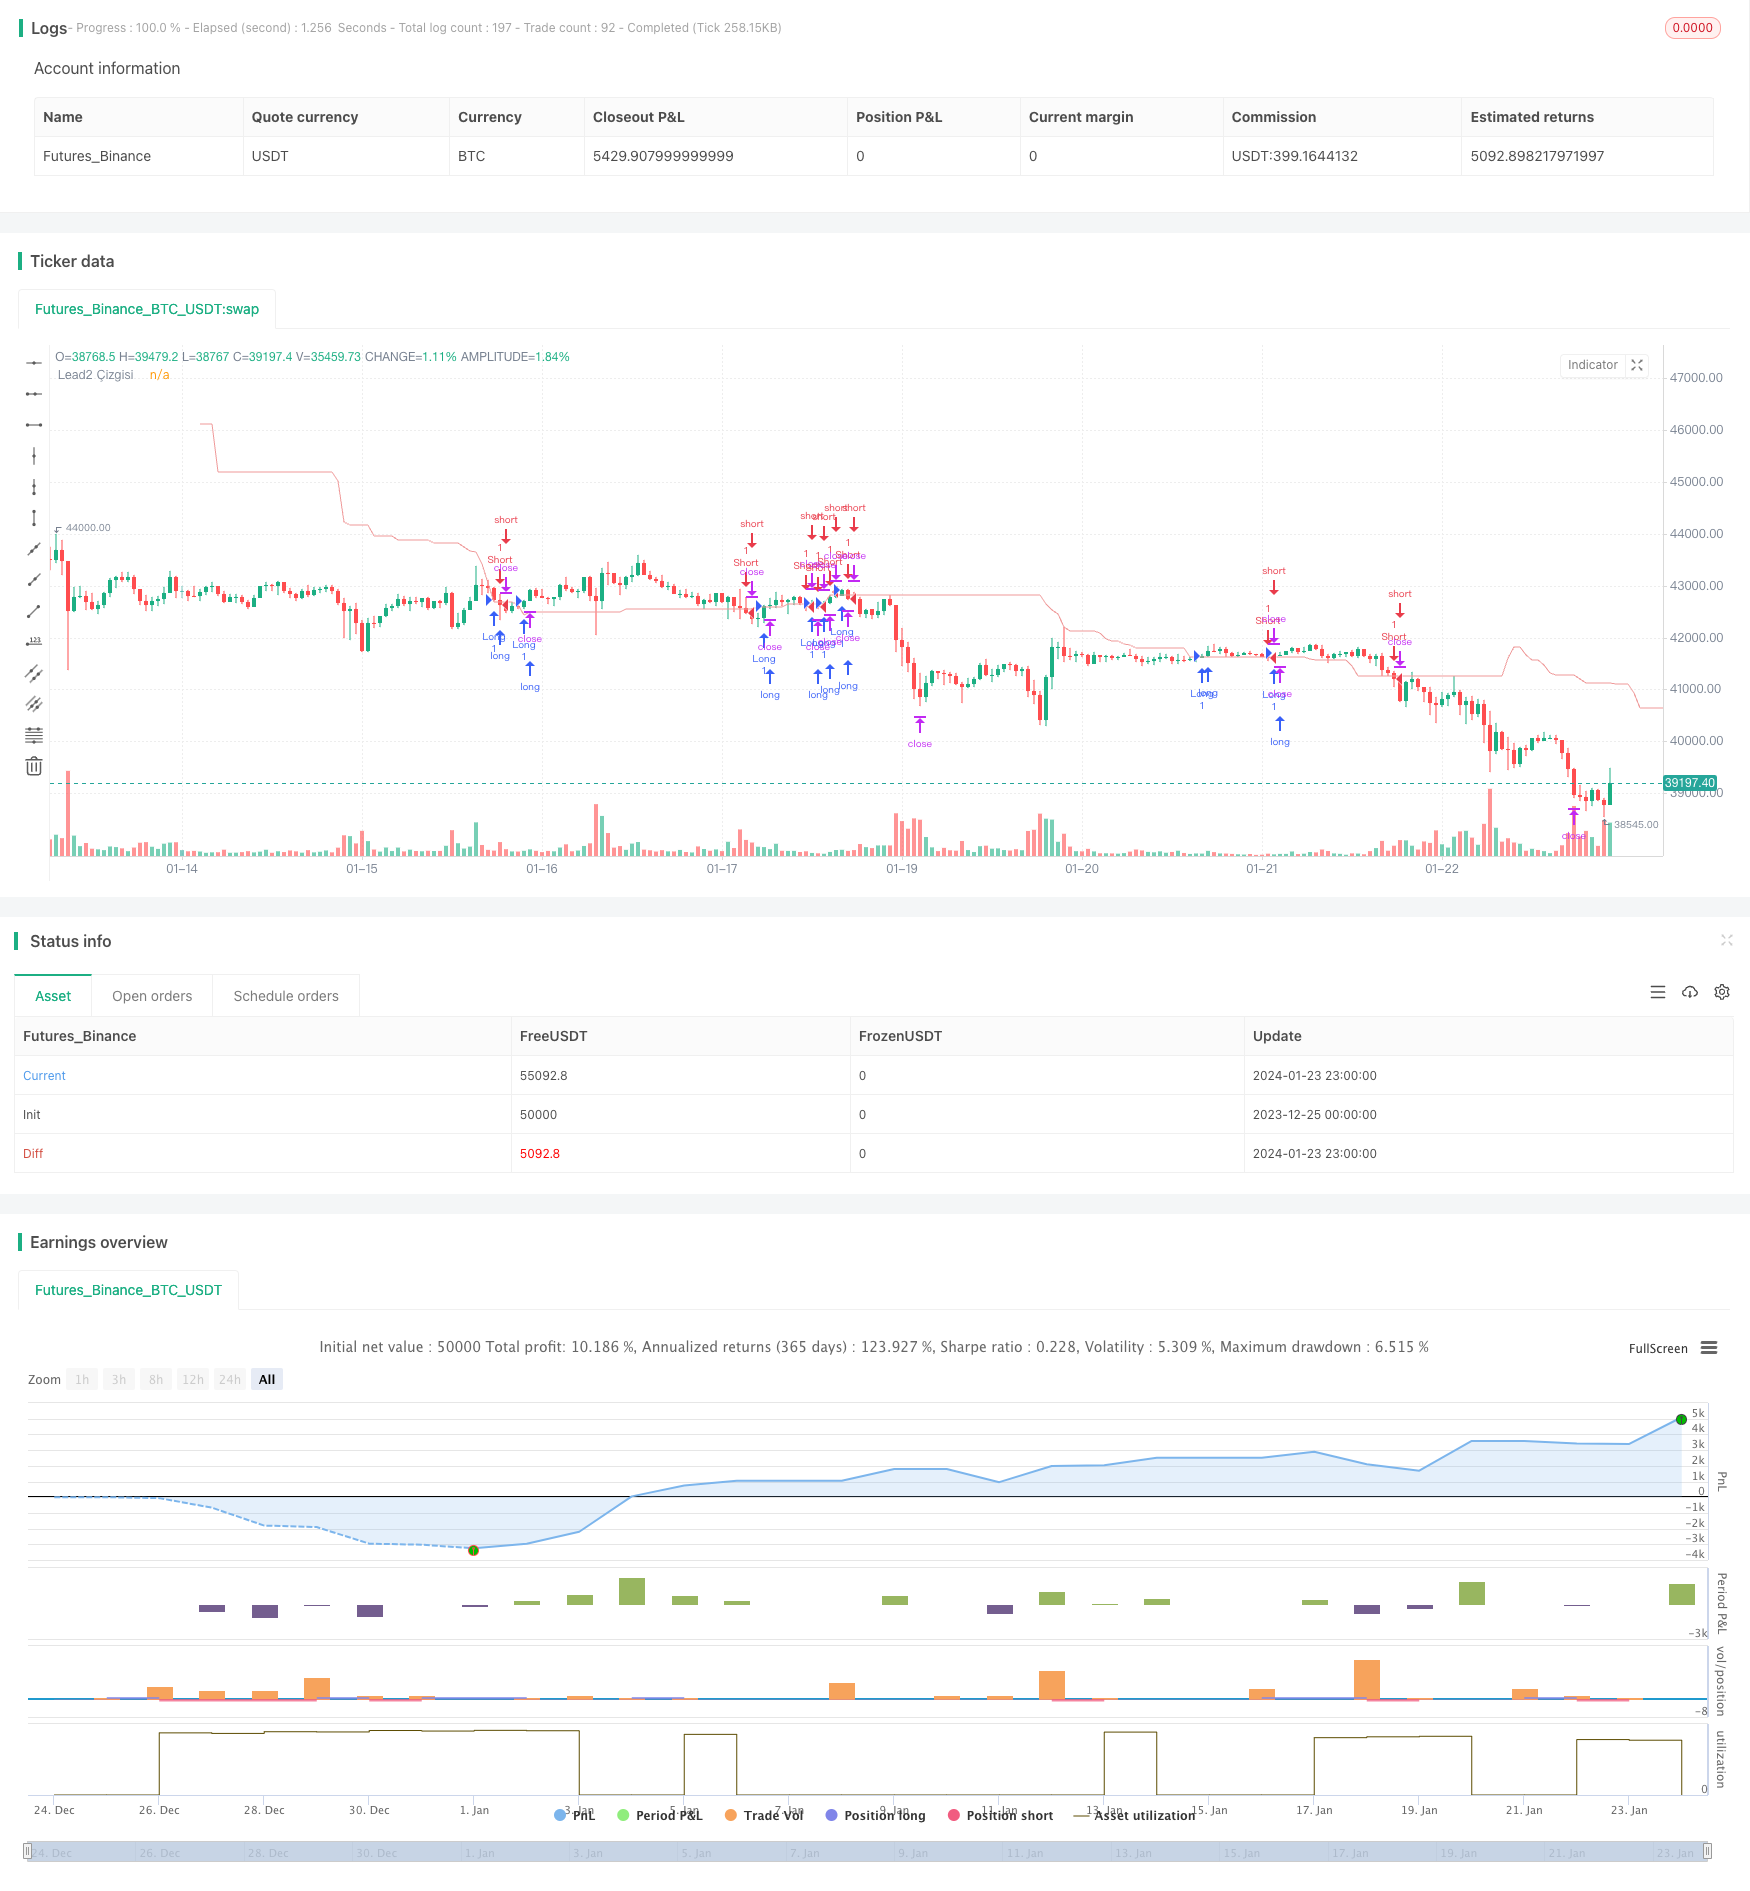
This strategy is based on the Lagging Span 2 line in the Ichimoku cloud indicator to determine the trend direction and establish positions. When the price breaks through the Lagging Span 2 line, it is judged as an inflection point of the trend, at which time a new position can be established.

Strategy Principle

This strategy mainly judges the movement of the Lagging Span 2 line in the Ichimoku cloud indicator. The Lagging Span 2 line is a smooth moving average line based on prices, and its sensitivity can be adjusted through smooth parameters. When the price breaks through the Lagging Span 2 line from top to bottom, go short; when the price breaks through the Lagging Span 2 line from bottom to top, go long.

Specifically, the strategy calculates the Lagging Span 2 line through the Donchian function. Then make a displacement offset for the line to obtain the final trading signal line. When the price breaks through this signal line, it is judged as a turning point in the price trend, at which point long and short positions can be established.

When entering the market, the strategy also sets take profit and stop loss points. Set take profit and stop loss for long positions when going long; set take profit and stop loss for short positions when going short.

Advantage Analysis

The main advantages of this strategy are:

  1. Use the Lagging Span 2 line in the Ichimoku cloud indicator to determine the trend. This line has good smoothness and avoids false breakouts.

  2. Long and short signals are clear and easy to determine.

  3. Take profit and stop loss are set at the same time to effectively control risks.

Risk Analysis

The main risks of this strategy are:

  1. The Lagging Span 2 line itself has a lag and may miss better entry points in the trend. The smooth parameters can be optimized as appropriate.

  2. Improper stop profit and stop loss settings may lead to greater losses. Can be optimized according to the characteristics of different varieties.

  3. Breakthrough trading itself carries the risk of being trapped by scalpers. Trend filters or confirmation of breakthrough can be set to avoid this.

Optimization Directions

The strategy can be optimized in the following aspects:

  1. Adjust the smooth parameter of the Lagging Span 2 line to optimize its sensitivity and find a balance between discovering trend reversal points and preventing false breakouts.

  2. Set separate take profit and stop loss for long and short positions, while optimizing the take profit and stop loss settings to prevent excessive losses.

  3. Add trend judgment conditions to avoid trading against the trend. For example, determine the overall trend direction in conjunction with other indicators.

  4. Increase confirmation mechanism. Do not enter the market at the first breakout, but wait for the confirmation signal of the callback breakout again.

Conclusion

The strategy is relatively simple and practical. It uses the Lagging Span 2 line in the Ichimoku cloud indicator as the basis to determine the turning point of the price trend. At the same time, take profit and stop loss are set to control risks. The strategy has large room for optimization, and can be adjusted in multiple aspects to obtain better entry opportunities as well as further control risks, thereby achieving better strategy results.


/*backtest
start: 2023-12-25 00:00:00
end: 2024-01-24 00:00:00
period: 1h
basePeriod: 15m
exchanges: [{"eid":"Futures_Binance","currency":"BTC_USDT"}]
*/

// This source code is subject to the terms of the Mozilla Public License 2.0 at https://mozilla.org/MPL/2.0/
// © MGULHANN

//@version=5
strategy("TPS - FX Trade", overlay=true)

laggingSpan2Periods = input.int(52, minval=1, title="Lead Look Back")
displacement = input.int(26, minval=1, title="Displacement")

pozyonu = input.bool(false,title="Sadece Long Yönlü Poz Aç")

// Stop Loss ve Kar Al Seviye Girişleri
TPLong = input.int(10000, minval = 30, title ="Long Kar Al Puanı", step=10)
SLLong = input.int(7500, minval = 30, title ="Long Zarar Durdur Puanı", step=10)
TPShort = input.int(20000, minval = 30, title ="Short Kar Al Puanı", step=10)
SLShort = input.int(7500, minval = 30, title ="Short Zarar Durdur Puanı", step=10)


donchian(len) => math.avg(ta.lowest(len), ta.highest(len))
leadLine = donchian(laggingSpan2Periods)
plot(leadLine, offset = displacement - 1, color=#EF9A9A,title="Lead2 Çizgisi")

buycross = ta.crossover(close,leadLine[displacement-1]) 
sellcross = ta.crossover(leadLine[displacement-1],close)


if (buycross) and (pozyonu == true) or buycross 
    strategy.entry("Long", strategy.long)
    strategy.exit("Exit Long", "Long", profit=TPLong, loss=SLLong)
if (sellcross) and pozyonu == false
    strategy.entry("Short", strategy.short)
    strategy.exit("Exit Short", "Short", profit=TPShort, loss=SLShort)


More