Multi-Trend Following und Struktur Breakout-Strategie
Schriftsteller:ChaoZhang, Datum: 2024-11-29 15:27:01Tags:EMARSISLTPBOS

Übersicht
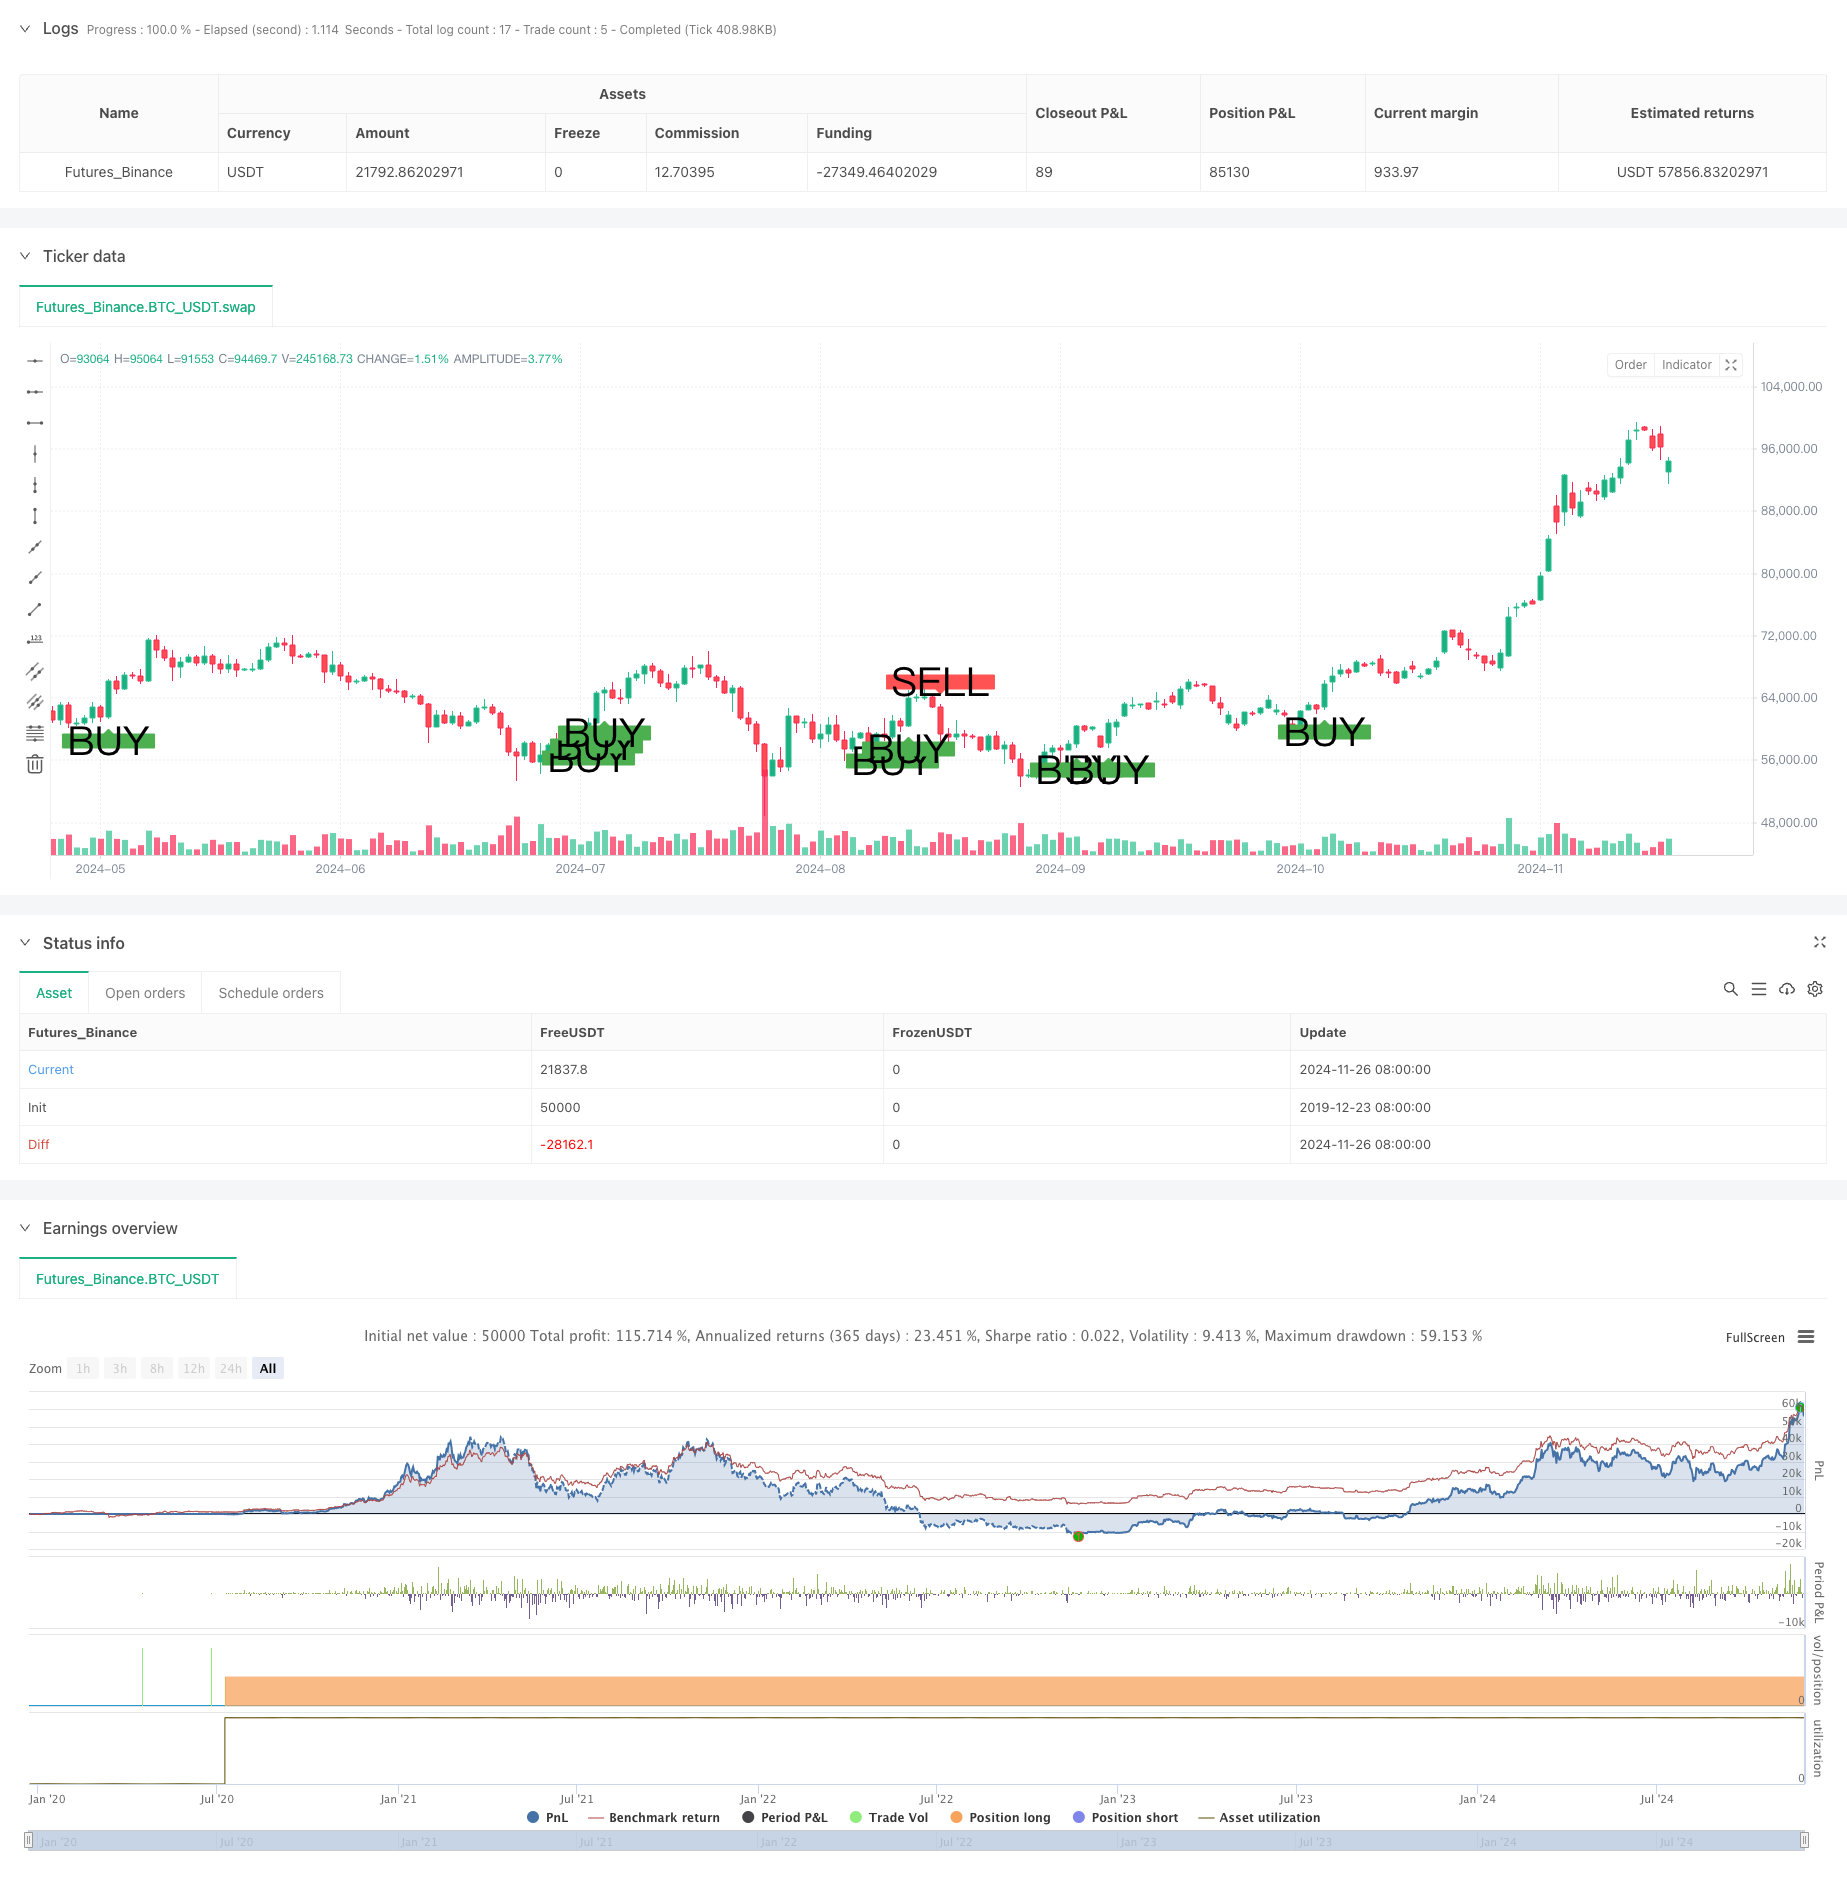
Es handelt sich um eine umfassende Handelsstrategie, die mehrere gleitende Durchschnitte, Trendverfolgung, Struktur-Breakouts und Momentum-Indikatoren kombiniert. Die Strategie bestimmt Handelssignale, indem sie Trends über mehrere Zeitrahmen hinweg analysiert und gleichzeitig Preisstruktur-Breakouts und Pullback-Einträge einbezieht.
Strategieprinzipien
Die Strategie verwendet drei exponentielle gleitende Durchschnitte (EMA25, EMA50 und EMA200), um Markttrends zu bestimmen. Ein Aufwärtstrend wird identifiziert, wenn der Preis über der EMA200 liegt und die EMA200 nach oben neigt; das Gegenteil zeigt einen Abwärtstrend an. Nachdem die Trendrichtung bestimmt wurde, sucht die Strategie nach Preisrückschlägen auf die EMA25 oder EMA50. Darüber hinaus erfordert die Strategie die Bestätigung der jüngsten Höchst- oder Tiefst-Break-outs und die Position der Schlusskurse im Verhältnis zu den Eröffnungspreisen, um die Dynamikrichtung zu überprüfen. Der RSI-Indikator dient als zusätzlicher Filter und erfordert einen RSI über 50 für Kaufsignale und unter 50 für Verkaufssignale.
Strategische Vorteile
- Mehrere Validierungsmechanismen verbessern die Handelssicherheit erheblich
- Die Integration von Trend- und Dynamikanalyse verringert das Risiko eines falschen Ausbruchs
- Klare Stop-Loss- und Take-Profit-Ziele helfen beim emotionalen Management
- Einfache und klare Strategielogik, leicht zu verstehen und umzusetzen
- Anwendbar auf verschiedene Marktumgebungen und Handelsinstrumente
Strategische Risiken
- Mehrere Bedingungen können zu verpassten Handelsmöglichkeiten führen
- Festgelegte Stop-Loss- und Take-Profit-Ziele entsprechen möglicherweise nicht allen Marktbedingungen
- Kann häufige Stopps auf stark volatilen Märkten auslösen
- Erfordert eine kontinuierliche Marktüberwachung zur Gewährleistung der Eignung der Parameter
- Kann falsche Signale in verschiedenen Märkten erzeugen
Strategieoptimierungsrichtlinien
- Einführung adaptiver Stop-Loss- und Take-Profit-Berechnungsmethoden
- Zusätzliche Volumenanalyse als Bestätigungsindikator
- Erwägen Sie die Einführung von Marktvolatilitätsfiltern
- Optimierung der Zeitrahmenwahl für die Trendbestimmung
- Verbesserung der Anpassungsfähigkeit der Strategie unter unterschiedlichen Marktbedingungen
Zusammenfassung
Es handelt sich um eine gut konzipierte umfassende Handelsstrategie, die durch den koordinierten Einsatz mehrerer technischer Indikatoren Handelschancen und Risikokontrolle effektiv ausgleicht. Die Kernstärke der Strategie liegt in ihrem strengen Mechanismus für mehrfache Validierung, der dazu beiträgt, die Handelserfolgsraten zu verbessern.
/*backtest
start: 2019-12-23 08:00:00
end: 2024-11-27 08:00:00
period: 1d
basePeriod: 1d
exchanges: [{"eid":"Futures_Binance","currency":"BTC_USDT"}]
*/

//@version=5
strategy("Custom Buy/Sell Strategy", overlay=true)

// Input parameters
ema25 = ta.ema(close, 25)
ema50 = ta.ema(close, 50)
ema200 = ta.ema(close, 200)
rsi = ta.rsi(close, 14)
sl_pips = 10
tp_pips = 15

// Convert pips to price units
sl_price_units = sl_pips * syminfo.pointvalue
tp_price_units = tp_pips * syminfo.pointvalue

// Define conditions for buy and sell signals
uptrend_condition = ema200 < close and ta.rising(ema200, 1)
downtrend_condition = ema200 > close and ta.falling(ema200, 1)

pullback_to_ema25 = low <= ema25
pullback_to_ema50 = low <= ema50
pullback_condition = pullback_to_ema25 or pullback_to_ema50

break_of_structure = high > ta.highest(high, 5)[1]
candle_imbalance = close > open

buy_condition = uptrend_condition and pullback_condition and rsi > 50 and break_of_structure and candle_imbalance

pullback_to_ema25_sell = high >= ema25
pullback_to_ema50_sell = high >= ema50
pullback_condition_sell = pullback_to_ema25_sell or pullback_to_ema50_sell

break_of_structure_sell = low < ta.lowest(low, 5)[1]
candle_imbalance_sell = close < open

sell_condition = downtrend_condition and pullback_condition_sell and rsi < 50 and break_of_structure_sell and candle_imbalance_sell

// Plot signals on the chart
plotshape(series=buy_condition, location=location.belowbar, color=color.green, style=shape.labelup, text="BUY", size=size.large)
plotshape(series=sell_condition, location=location.abovebar, color=color.red, style=shape.labeldown, text="SELL", size=size.large)

// Calculate stop loss and take profit levels for buy signals
var float buy_sl = na
var float buy_tp = na

if buy_condition and strategy.position_size == 0
    buy_sl := close - sl_price_units
    buy_tp := close + tp_price_units
    strategy.entry("Buy", strategy.long)
    strategy.exit("TP/SL Buy", from_entry="Buy", limit=buy_tp, stop=buy_sl)
    label.new(bar_index, high, text="Entry: " + str.tostring(close) + "\nSL: " + str.tostring(buy_sl) + "\nTP: " + str.tostring(buy_tp), style=label.style_label_up, color=color.green, textcolor=color.white, size=size.small)

// Calculate stop loss and take profit levels for sell signals
var float sell_sl = na
var float sell_tp = na

if sell_condition and strategy.position_size == 0
    sell_sl := close + sl_price_units
    sell_tp := close - tp_price_units
    strategy.entry("Sell", strategy.short)
    strategy.exit("TP/SL Sell", from_entry="Sell", limit=sell_tp, stop=sell_sl)
    label.new(bar_index, low, text="Entry: " + str.tostring(close) + "\nSL: " + str.tostring(sell_sl) + "\nTP: " + str.tostring(sell_tp), style=label.style_label_down, color=color.red, textcolor=color.white, size=size.small)

// // Plot stop loss and take profit levels for buy signals
// if not na(buy_sl)
//     line.new(x1=bar_index, y1=buy_sl, x2=bar_index + 1, y2=buy_sl, color=color.red, width=1)
// if not na(buy_tp)
//     line.new(x1=bar_index, y1=buy_tp, x2=bar_index + 1, y2=buy_tp, color=color.green, width=1)

// // Plot stop loss and take profit levels for sell signals
// if not na(sell_sl)
//     line.new(x1=bar_index, y1=sell_sl, x2=bar_index + 1, y2=sell_sl, color=color.red, width=1)
// if not na(sell_tp)
//     line.new(x1=bar_index, y1=sell_tp, x2=bar_index + 1, y2=sell_tp, color=color.green, width=1)
- Multi-RSI-EMA-Momentum-Hedging-Strategie mit Skalierung von Positionen
- Doppel-EMA-Crossover mit RSI-Momentum-Verstärkter Handelsstrategie
- Mehrzeitrahmen-RSI-Überverkaufs-Umkehrstrategie
- Adaptiver Trend nach Strategie mit dynamischem Abzugsteuerungssystem
- Multi-Indikator-Dynamische Handelsstrategie
- Multi-EMA-Crossover mit Dynamikindikatoren Handelsstrategie
- Erweiterte Multi-Indikator-Strategie zur Trendumkehrung
- KRK ADA 1H Stochastische langsame Strategie mit mehr Einträgen und KI
- Multi-Indikator-Crossover-Momentum-Handelsstrategie mit optimiertem Take Profit und Stop Loss-System
- Dynamische Long/Short-Swing-Handelsstrategie mit gleitendem Durchschnitts-Crossover-Signalsystem
- Trend der Doppel-EMA-Dynamischen Zone nach der Strategie
- Multi-MA-Crossover mit RSI Dynamic Trailing Stop Loss Quantitative Handelsstrategie
- Handelsstrategie mit doppelter EMA-Trendmomentum
- Multi-Trend-Momentum-Crossover-Strategie mit Volatilitätsoptimierungssystem
- Mehrindikatorische Trendbreakout-Quantitative Handelsstrategie
- Momentumindikator Schwingungsschwelle Erweiterte Handelsstrategie
- Intelligenter Trend nach Strategie auf Basis der Multi-Zone-SMC-Theorie
- Dynamische mehrjährige quantitative Handelsstrategie, die RSI und EMA kombiniert
- Trend der mehrdimensionalen technischen Indikatoren nach einer quantitativen Strategie
- Zweigliedrige gleitende Durchschnitts-Adaptive Crossover-Parameter-Handelsstrategie
- TRAMA Dual Moving Average Crossover Intelligente quantitative Handelsstrategie
- Multi-Timeframe RSI-EMA-Momentum-Handelsstrategie mit Skalierung der Positionen
- Multi-MA-Trend folgt mit RSI-Momentum-Strategie
- Multi-Level-Fibonacci-EMA-Trend nach der Strategie
- Trendfolgendes Gap Breakout Handelssystem mit SMA-Filter
- Dual EMA Crossover Trend nach Strategie mit Risikomanagement und Zeitfiltersystem
- Doppelglätteter gleitender Durchschnittstrend nach Strategie - basierend auf modifiziertem Heikin-Ashi
- MACD Multi-Interval Dynamisches Stop-Loss- und Take-Profit-Handelssystem
- Dynamisches Handelssystem mit stochastischem RSI und Candlestick-Bestätigung
- Doppel gleitender Durchschnittstrend nach Strategie mit ATR-basiertem Risikomanagementsystem